CAPITALAND INTEGRATED COMMERCIAL TRUST - UBS OneASEAN Virtual Conference 2021 18 June 2021 - Investor Relations
←
→
Page content transcription
If your browser does not render page correctly, please read the page content below
CAPITALAND INTEGRATED COMMERCIAL TRUST
UBS OneASEAN Virtual Conference 2021
18 June 2021
Disclaimer
This presentation may contain forward-looking statements. Actual future performance, outcomes and results may differ materially from those
expressed in forward-looking statements as a result of a number of risks, uncertainties and assumptions. Representative examples of these factors
include (without limitation) general industry and economic conditions, interest rate trends, cost of capital and capital av ailability, availability of real
estate properties, competition from other developments or companies, shifts in customer demands, shifts in expected levels of occupancy rate,
property rental income, charge out collections, changes in operating expenses (including employee w ages, benefits and training, property
operating expenses), governmental and public policy changes and the continued availability of financing in the amounts and the terms necessary
to support future business.

You are cautioned not to place undue reliance on these forward-looking statements, which are based on the current view of management
regarding future events. No representation or w arranty expressed or implied is made as to, and no reliance should be placed on, the fairness,
accuracy, completeness or correctness of the information or opinions contained in this presentation. Neither CapitaLand I ntegrated Commercial
Trust Management Limited (“Manager”) nor any of its affiliates, advisers or representatives shall have any liability whatsoever (in negligence or
otherwise) for any loss howsoever arising, whether directly or indirectly, from any use, reliance or distribution of this presentation or its contents or
otherwise arising in connection with this presentation.

The past performance of CapitaLand Integrated Commercial Trust (“CICT”) is not indicativ e of future performance. The listing of the units in the CI CT
(“Units”) on the Singapore Exchange Securities Trading Limited (the “SGX-ST”) does not guarantee a liquid market for the Units. The v alue of the Units
and the income derived from them may fall as well as rise. Units are not obligations of, deposits in, or guaranteed by, the Manager or any of its
affiliates. An investment in the Units is subject to investment risks, including the possible loss of the principal amount invested. I nvestors have no right
to request that the Manager redeem or purchase their Units w hile the Units are listed on the SGX-ST. I t is intended that holders of Units may only deal
in their Units through trading on the SGX-ST.

This presentation is for information only and does not constitute an inv itation or offer to acquire, purchase or subscribe for the Units.

                                                                                                                                                                2
Contents
                                                                                                                  Slide No.
1.      About CICT and Key Market Updates                                                                          04
2.      1Q 2021 Business Updates                                                                                   08
3.      1Q 2021 Financial Performance by Asset                                                                     15
4.      Information by Asset Type for 1Q 2021                                                                      19
5.      Creating Value                                                                                             34
6.      Ensuring Sustainability                                                                                    42
7.      Summary                                                                                                    45
8.      Market Information                                                                                         47
9.      Additional Information                                                                                     61

* Any discrepancies in the tables and charts between the listed figures and totals thereof are due to rounding.

                                                                                                                              3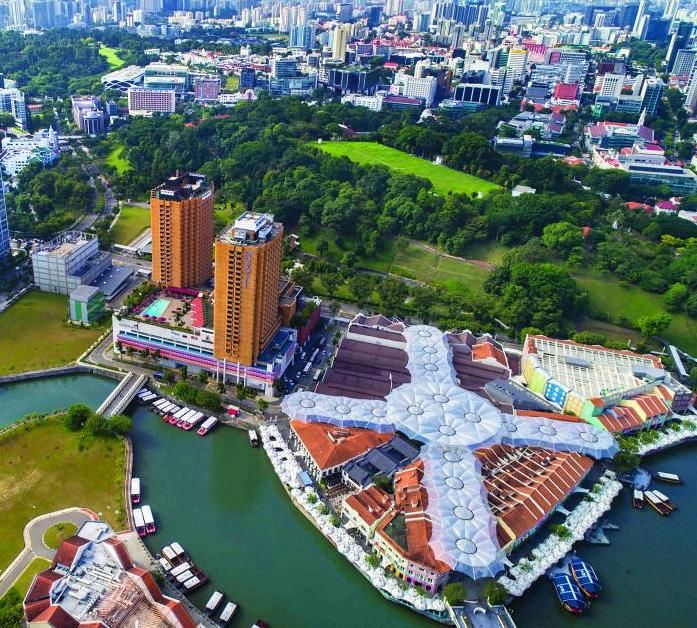
About CICT
and
Key Market
Environment
Updates

              Raffles City Singapore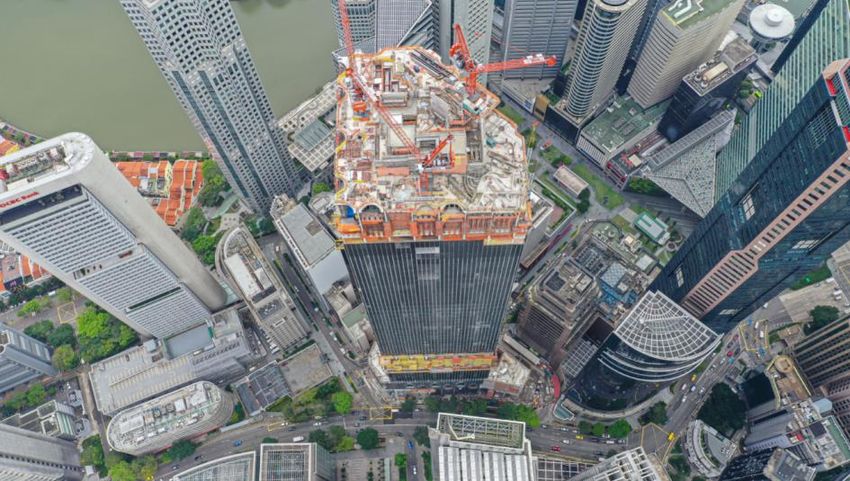
CapitaLand Integrated Commercial Trust
Largest proxy for Singapore’s commercial real estate market

     Market Capitalisation                         S$13.5              billion(1)               Portfolio Property Value                       S$22.3               billion(2)

    Total Net Lettable Area                        10.4 million sq ft              (3)
                                                                                                                    NAV per Unit               S$2.00             (4)

 Leading integrated commercial REIT underpinned by                                                                Predominantly Singapore-focused
 resilience and growth
                                                                                                                             Singapore
                                                                                                                                96%
                                                                                                                                                  Portfolio
                                                                                                                                                  property
                                                                                                                                                 value(2) by
                                                                                                                                                 geography
              Retail                 Office         Integrated Developments                                                                                             Germany
               11                      8                        5                                                                                                         4%
Notes:
(1) Based on closing price of S$2.09 as at 31 May 2021.
(2) Based on v aluations as at 31 December 2020.
(3) Excludes CapitaSpring which is undergoing redev elopment.
(4) As at 31 December 2020 and excludes distributable income. Change in NAV per unit to S$2.00 as at 31 December 2020 from S$2.07as at 31 December 2019 was due to a larger total units
    outstanding as a result of the merger and change in v aluation of Inv estment Properties.                                                                                             5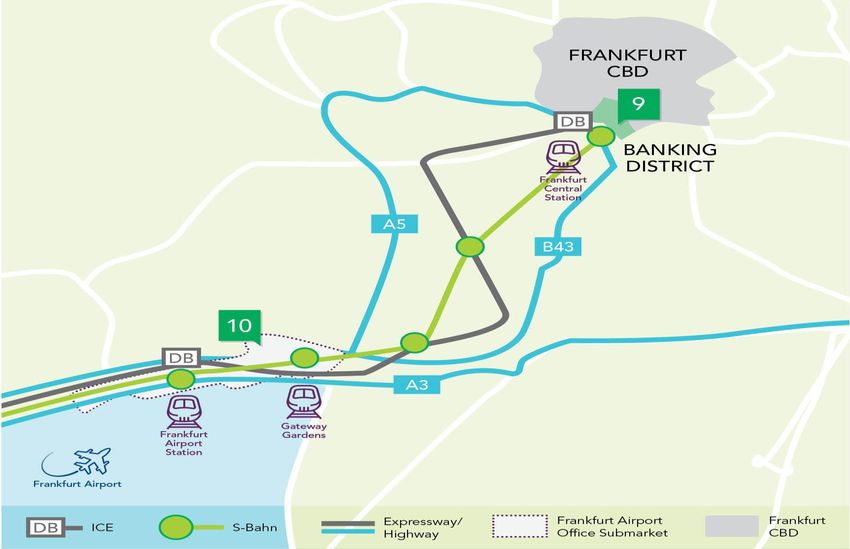
Key market environment updates
Staying vigilant and agile amidst fluid COVID-19 situation
                  •    Progressing to Phase 3 (Heightened Alert) in 2 phases.
Update on              From 14 June 2021:
COVID-19               – Group size for social gatherings increased from 2 to 5 persons
Situation in           – Capacity limits in malls and large standalone stores relaxed from 16m2 per person of GFA to
                          10m2 per person
Singapore              – Work-from-home remains the default at workplaces
                       – Serv ices which requires masks to be remov ed (e.g. facial, saunas) to resume
                       – Cinemas can accommodate up to 250 people with pre-event testing and up to 50 without
                          and no sale and consumption of food and drinks allowed
                       Further re-opening from 21 June 2021 (if situation is under control):
                       – Dining-in allowed up to group size of 5
                       – Cinemas may resume serv ing food and bev erage
                       – Gyms and fitness studios may resume with a limited of 30 persons in groups of up to 5 persons
                  •    Singapore’s gov ernment $800 million Cov id-19 provides targeted support for:
                       – Affected gyms, fitness studios and performing arts and arts education centres will get 50% of
                          salary support (Apr to Jun) for local employees under the Job Support Scheme (JSS)
                       – Sectors that do not have to suspend operations but are significantly affected by the measures
                          will get 30% of JSS subsidies for Apr to Jun salaries
                       – 0.5 month rental relief cash payout for qualifying SME tenants
                   •   Effective from 1 June 2021, landlords and tenants hav e to abide by the Code of Conduct (CoC)
Fair Tenancy           which provides a set of clear leasing guidelines and negotiation principles which is fair to both
Framework              parties. This will lead to a more collaborativ e, open, honest, and transparent relationship which is
                       mutually beneficial.
(Retail)               (the CoC can be found here)
                                                                                                                               6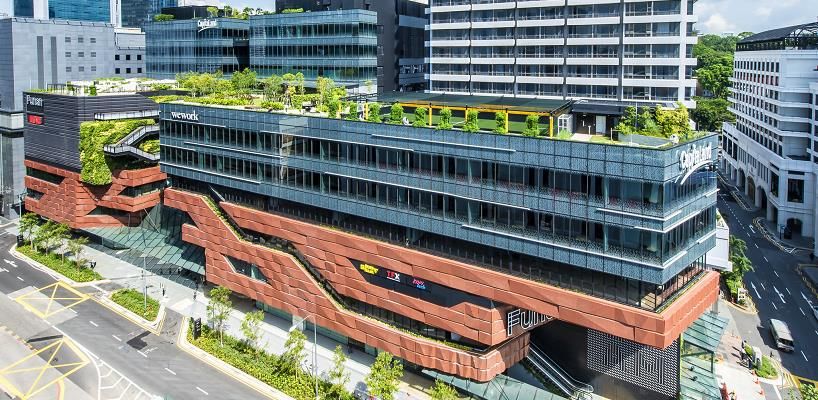
CICT’s supportive actions
                                                                            Update on shopper traffic and
► Continue to ensure safety and well-being of our stakeholders              return of office community:
  by adopting the safe management measures.
► Targeted assistance provided for retailers whose operations               Shopper traffic:
  are directly or indirectly impacted by the latest measures                Portfolio▼30.7%
    ►   Includes rental waivers and operational support to continue         Downtown ▼34.1%
        online sales through CapitaLand’s digital platforms, waiv ing the   Suburban ▼28.1%
        platform and commission fees for existing and new F&B operators     (Comparing total traffic in the two weeks
        who sign up with Capita3Eats.                                       of 10 - 23 May 2021 v s total traffic in the
                                                                            preceding two weeks of 26 Apr - 9 May
► Curated a seamless shopping experience for shoppers with                  2021)
  delivery services, as well as click and collect options available
  on eCapitaMall.                                                           Return of office community:
► To-date, CapitaLand’s Capita3Eats and eCapitaMall                         Declined to 15.0%
                                                                            (for the week ended 21 May 2021from
  platforms have signed on more than 560 brands.                            51.3% for the week ended 16 April 2021)
► Set-up designated dining areas at our premises, so that the
  front-line staff and delivery riders can take their meals in a safe
  and comfortable zone.
► Extended grace period for drivers visiting our malls to 30
  minutes from 19 May 2021.

                                                                                                                           7
1Q 2021
Business Updates

                   IMM Building
1Q 2021 financial performance
                                                Gross Revenue                                                    Net Property Income

                                          S$334.8 million                                                       S$247.1 million
                                                 ▲63.9% Y-o-Y                                                          ▲66.6% Y-o-Y

      Retail Asset Performance                                         Office Asset Performance (1)                                             Integrated Development
                      (S$ m)                                                                  (S$ m)                                                  Performance (2)
                                                                                                                                                                (S$ m)

   153.5
             142.2
                                    110.2                                                                                                               96.5
                                             101.2
                                                                             96.1
                                                                                                              74.0                                                                      71.9
                                                                                                                                              50.8
                                                                                                                                                                               38.1

 Gross Revenue                            NPI                         Gross Revenue                           NPI                           Gross Revenue                           NPI
                1Q 2020         1Q 2021                                                                                                                   1Q 2020         1Q 2021
                                                                                            1Q 2021

Notes:
(1) Income contribution from office assets is from 21 October 2020 onwards. Hence, there is no data for 1Q 2020. Income contribution excludes One George Street as it is a joint v enture.
(2) Income contribution from Raffles City Singapore is on a 100.0% basis for 1Q 2021. Excludes income contribution from Raffles City Singapore for 1Q 2020 as it was a joint v enture of CICT on a 40.0%
    basis prior to the merger.
                                                                                                                                                                                                           9
Key operating metrics for 1Q 2021
Proactive leasing strategy remains a priority while striking a right balance between
occupancy and rents

                       Portfolio                                                                       Portfolio Weighted Average Lease
          Committed Occupancy                                                                              Expiry by Gross Rental Income
                        (as at 31 March 2021)                 95.9%                                                                       (as at 31 March 2021)                3.1         years(1)

                  Retail Tenants’ Sales                                                                             Return of Office Community
                                                              ▲ 2.9%                                                                                                           51.3%
                                                                                   (2)
                                      (for 1Q 2021)                                                         (average for week ended 16 April 2021)

Notes:
(1) Based on 50.0% interest in One George Street, Singapore and 94.9% interest in Gallileo and Main Airport Center, Frankfurt; and W eW ork’s 7-year lease at 21 Collyer Quay. Excludes gross turnov er rents.
(2) Year-on-year comparison of tenants sales per square foot per month and adjusted for non-trading days.

                                                                                                                                                                                                                 10
Key financial indicators
As at As at
31 March 2021 31 December 2020
Unencumbered Assets as % of Total Assets 95.8% 95.8%
Aggregate Leverage(1) 40.8% 40.6%
Net Debt / EBITDA(2) N.M. N.M.
Interest Coverage(3) 3.7x 3.8x
Average Term to Maturity (years) 4.4 4.1
Average Cost of Debt(4) 2.4% 2.8%
CICT’s Issuer Rating(5) ‘A3’ by Moody’s ‘A3’ by Moody’s
‘A-’ by S&P ‘A-’ by S&P
Notes:
(1) In accordance with Property Funds Appendix, CICT’s proportionate share of its joint v entures’ borrowings and deposited property v alues are included when computing aggregate leverage.
Correspondingly, the ratio of total gross borrowings to total net assets is 71.7%.
(2) Net Debt comprises Gross Debt less total cash and EBITDA refers to earnings of CICT Group, before interest, tax, depreciation and amortisation (excluding effects of any fair v alue changes of
deriv atives and inv estment properties, foreign exchange translation and non-operational gain/loss), on a trailing 12-month basis.
(3) Ratio of earnings of CI CT Group, before interest, tax, depreciation and amortisation (excluding effects of any fair v alue changes of deriv ativ es and inv estment properties, foreign exchange
translation and non-operational gain/loss) ov er interest expense and borrowing-related costs, on a trailing 12-month basis.
(4) Ratio of interest expense ov er weighted av erage borrowings.
(5) Moody’s Inv estors Service downgraded CICT’s issuer rating to ‘A3’ on 1 October 2020. S&P Global Ratings assigned ‘A-’ issuer rating to CICT on 30 September 2020.
N.M.: Not meaningful
11CICT debt maturity profile as at 31 March 2021
Average term to maturity extended to 4.4 years
S$ million
Issued two long tenor notes with lower interest rates
1,800 17% through its unsecured S$7.0 billion Multicurrency Medium
Refinancing completed 17%
in 1Q 2021 Term Note Programme (MTN Programme) in 1Q 2021:
1,603
1,600 1,576
14%
• Issued S$460 million fixed rate notes due 8 March
1,400 4% 1,345 2028 through MTN Programme at 2.10% per annum.
355 12%
11% • Issued HK$713 million 2.53% fixed rate notes due 1
1,200 February 2033 through MTN Programme which was
1,105 870
900 1,066
10% swapped to S$125 million at 2.15% per annum.
1,000 917
265
832
418
800 857 299
600 459
5%
186 4%
290
400 213
733 676 2%
175 2%
432 460 1% 1%
200 381 358 407
300 250
180 150 125
75
0
2021 2022 2023 2024 2025 2026 2027 2028 2029 2030 2031 2032 2033
Medium Term Notes (“MTN”) Secured Bank Loans Unsecured Bank Loans
Note:
(1) Please v isit CICT website for details of the respective MTN.
12Portfolio
Portfolio lease expiry profile(1)(2) as at
31 March 2021
Portfolio Weighted Average Lease Expiry by Monthly Gross Rental Income
3.1 Years
20.5%
13.4%
12.4%
9.8%
8.5%
6.3% 7.0%6.3%
5.2% 4.6%
1.8%2.4% 1.8%
2021 2022 2023 2024 2025 2026 and
beyond
Retail Office Hospitality
Notes:
(1) Excludes gross turnov er rents.
(2) Based on 50.0% interest in One George Street, Singapore and 94.9% interest in Gallileo and Main Airport Center, Frankfurt; and W eW ork’s 7-year lease at 21 Collyer Quay.
13Portfolio
No single tenant contributes more than 5.0% of
CICT’s total gross rental income(1)
% of Total
Ranking Top 10 Tenants for March 2021 Trade Sector
Gross Rent
1 RC Hotels (Pte) Ltd 5.0% Hotel
Supermarket / Beauty & Health / Services /
2 NTUC Enterprise Co-operative Limited 2.2%
Food & Beverage / Education / Warehouse
3 Temasek Holdings (Private) Limited 2.0% Financial Services
4 Commerzbank AG(2) 1.9% Banking
5 GIC Private Limited 1.7% Financial Services
Supermarket / Beauty & Health / Services /
6 Cold Storage Singapore (1983) Pte Ltd 1.7%
Warehouse
7 Mizuho Bank, Ltd 1.6% Banking
8 BreadTalk Group Limited 1.6% Food & Beverage
9 JPMorgan Chase Bank, N.A. 1.3% Banking
10 BHG (Singapore) Pte. Ltd. 1.2% Department Store
Total top 10 tenants’ contribution 20.2%
Notes:
(1) For month of March 2021 and excludes gross turnov er rent.
(2) Based on 94.9% interest in Gallileo, Frankfurt.
141Q 2021
Financial
Performance
by Asset
Capital Tower1Q 2021 gross revenue(1)
DORSCON level was raised to Orange on 7 February 2020; travel restrictions and safe
distancing measures were imposed and still in force as at 31 Mar 2021
(S$ m) 54.1
47.7
26.5
24.4
22.722.2 22.5 21.6
20.4 19.7 21.1
20.3 18.8
17.6 15.8 15.7 17.6
15.4 14.2 13.7
14.7 12.7 12.4 12.5 13.7
10.4 11.5
10.0 9.5 8.3 7.8 7.2 6.7
3.8
-
21 Collyer Quay (4)
Other Assets (2)
(3)
CapitaGreen
Main Airport Center
Capital Tower
Junction 8
Gallileo
Asia Square Tower 2
Six Battery Road
Funan
Lot One Shoppers' Mall
Bugis+
Bugis Junction
Raffles City Singapore
Westgate
Bedok Mall
Clarke Quay
Tampines Mall
IMM Building
Plaza Singapura
The Atrium@Orchard
1Q 2020 1Q 2021 1Q 2020 1Q 2021 1Q 2021
Notes:
(1) Income contribution from office assets is from 21 October 2020 onwards and excludes One George Street, a joint v enture.
(2) Comprises JCube and Bukit Panjang Plaza.
(3) For 1Q 2020, income contribution from Raffles City Singapore is on a 100.0% basis and for illustration only. Actual income contribution from Raffles City Singapore was on a 40.0% basis as it was a
joint v enture of CICT prior to the merger. For 1Q 2021, income contribution from Raffles City Singapore is on a 100.0% basis.
(4) 21 Collyer Quay is currently undergoing upgrading. 161Q 2021 operating expenses(1)
(S$ m)
11.7
(4)
7.4
6.3 6.3
5.5 5.7
5.3 5.2 5.5 5.4
5.3 5.1 4.7
4.9 4.5 4.6
4.2 4.3
4.0 4.0
3.8 3.7 3.6
3.3 3.2 3.0 3.3
3.1 2.7 2.8
2.4 2.4
2.1
1.2
0.6
Raffles City Singapore(3)
Other Assets(2)
Asia Square Tower 2
CapitaGreen
21 Collyer Quay
Main Airport Center
Capital Tower
Funan
Gallileo
Six Battery Road
Junction 8
Bugis Junction
Tampines Mall
Lot One Shoppers' Mall
Bugis+
Bedok Mall
Westgate
Clarke Quay
IMM Building
Plaza Singapura
The Atrium@Orchard
1Q 2020 1Q 2021 1Q 2020 1Q 2021 1Q 2021
Notes:
(1) Operating expenses from office assets is from 21 October 2020 onwards and excludes One George Street, a joint v enture.
(2) Comprises JCube and Bukit Panjang Plaza.
(3) For 1Q 2020, operating expenses from Raffles City Singapore is on a 100.0% basis and for illustration only. Actual operating expenses from Raffles City Singapore was on a 40.0% basis as it was a joint
v enture of CICT prior to the merger. For 1Q 2021, operating expenses from Raffles City Singapore is on a 100.0% basis.
(4) 1Q 2020 operating expenses for Raffles City Singapore include property tax rebate. 171Q 2021 net property income(1)
46.7
(S$ m)
36.0
20.8 19.8
16.4 15.9 17.0 16.2
15.114.5 15.6
15.0 13.7
12.7 11.6 11.0 13.3
11.410.9 10.510.1
9.5 8.7 10.4
8.2 8.4
7.1 6.9 6.3 5.9 5.7 6.0 4.3
1.1 -0.6
Raffles City Singapore(3)
21 Collyer Quay(4)
Other Assets(2)
Asia Square Tower 2
Capital Tower
Main Airport Center
CapitaGreen
Funan
Gallileo
Bugis Junction
Junction 8
Six Battery Road
Tampines Mall
Lot One Shoppers' Mall
Bugis+
Bedok Mall
Clarke Quay
Westgate
IMM Building
Plaza Singapura
The Atrium@Orchard
1Q 2020 1Q 2021 1Q 2021
1Q 2020 1Q 2021
Notes:
(1) Income contribution from office assets is from 21 October 2020 onwards and excludes One George Street, a joint v enture.
(2) Comprises JCube and Bukit Panjang Plaza.
(3) For 1Q 2020, income contribution from Raffles City Singapore is on a 100.0% basis and for illustration only. Actual income contribution from Raffles City Singapore was on a 40.0% basis as it was a
joint v enture of CICT prior to the merger. For 1Q 2021, income contribution from Raffles City Singapore is on a 100.0% basis.
(4) 21 Collyer Quay is currently undergoing upgrading. 18Information by
Asset Type for
1Q 2021
Please note:
The retail and office asset information
included the respective retail and
office components of integrated
developments unless stated
otherwise, in order to show the
operating metrics and trends
CapitaGreenRetail
Retail performance overview
Retail 1Q 2021 New Retail Openings by NLA
Occupancy(1) IT &
Services, 1.2%
97.1%
Telecommunication,
Home Furnishing, 1.1%
1.4% Others,
as at 31 March 2021 Beauty & Health,
1.4% Shoes & Bags,
0.9%
3.3%
Education, 6.2%
Shopper Tenants’ Sales
Traffic Per Square Foot Food &
Beverage,
Recovered to Electrical & 42.2%
75.3% ▲2.9%
Electronics,
17.8%
of the level a year ago Y-o-Y
1Q 2021 1Q 2021
Fashion, 24.5%
Note:
(1) Retail occupancy includes retail only properties and the retail components within integrated dev elopments.
20Retail
Retail committed occupancy at 97.1%(1)
Above Singapore retail occupancy rate of 91.5% for 1Q 2021 based on URA’s island-
wide retail space vacancy rate
99.6% 99.9% 100.0% 99.4% 98.7% 98.4% 99.4% 99.9% 99.9% 99.0% 98.7% 99.3% 98.5% 98.4% 99.2% 100.0% 98.2% 98.9% 97.1% 98.8% 98.7% 96.9%
95.5% 94.2% 95.9% 94.8%
90.9%
84.7%
Clarke Quay(2)
Other assets(3)
Tampines Mall
Bugis +
The Atrium
Bugis Junction
Junction 8
Shoppers' Mall
Funan
Westgate
Raffles City
IMM Building
Plaza Singapura
@Orchard
Bedok Mall
Singapore
Lot One
As at 31 March 2020 As at 31 March 2021
Notes:
(1) Retail occupancy includes retail only properties and the retail components within integrated developments.
(2) Clarke Quay’s occupancy was affected by government-stipulated restrictions on trading hours and sales of alcohol at nightlife v enues like clubs, karaoke joints and bars without food licenses.
(3) Comprises JCube and Bukit Panjang Plaza.
21Retail
Retail lease expiry profile(1)
Weighted Average Lease Expiry by
1.8 Years
Monthly Gross Rental Income
Monthly Gross Rental Income(2)
As at 31 March 2021 Number of Leases S$’000 % of Total
2021 764 13,541 21.8
2022 1,006 22,370 36.1
2023 693 14,587 23.5
2024 325 7,665 12.3
2025 42 1,974 3.2
2026 and beyond 28 1,916 3.1
Total 2,858(3) 62,053 100.0
Notes:
(1) Based on committed leases in retail properties and retail components in Integrated Dev elopment.
(2) Excludes gross turnov er rent.
(3) Of which 2,519 leases are retail leases.
22Retail
Shopper traffic and tenants’ sales(1) on positive
trajectory
Following Phase 3 reopening on 28 Dec 2020, shopper traffic recovery gained momentum
while tenants’ sales rebounded in 1Q 2021
Year-on-year recovery levels for tenants’ sales and shopper traffic
in CICT retail portfolio
102.9%
92.5% 88.6% 94.5%
100%
90.9% 75.3%
68.6% 67.9%
59.7%
Following commencement of Phase 2 (Heightened Alert)
from 16 May 2021, shopper traffic was impacted:
Portfolio▼30.7%
28.1% Downtown ▼34.1%
Suburban ▼28.1%
(Comparing total traffic in the two weeks of 10 - 23 May
2021 vs total traffic in the preceding two weeks of 26 Apr
(2) (2)
- 9 May 2021)
1Q 2020 2Q 2020 3Q 2020 4Q 2020 1Q 2021
Shopper Traffic (Y-o-Y) Tenant Sales $psf/month (Y-o-Y)
Suburban mall recovery Downtown mall recovery Suburban mall recovery Downtown mall recovery
Shopper Tenants’ 99.2% to 113.5% 49.6% to 109.6%
64.5% to 95.1% 61.7% to 85.1%
Traffic Average: 75.8% Average: 74.8% Sales Average: 104.3% Average: 98.8%
Notes:
(1) Tenants’ sales are adjusted for non-trading days.
(2) For comparable basis, CICT portfolio excludes Funan which was closed in July 2016 for redev elopment and reopened in June 2019.
23Retail
Most trade categories saw Y-o-Y improvement
in 1Q 2021
Top five trade categories (1) 1Q 2021 tenants’ sales $ psf/month(2) 0.7% Y-o-Y
(by gross rental income for retail segment)
: Percentage of total retail gross rental income(3) > 69%
47.5%
1Q 2021 Tenants’ Sales by Trade Categories
Y-o-Y Variance of Tenants’ Sales $ psf/month (%)
14.4% 11.0% 10.7% 9.0% 6.0% 5.5% 2.8% 1.7% 0.8%
-2.6%
-6.6%
-14.1% -17.7%
-47.9%
(4)
Services (3)
Books & Stationery
Home Furnishing
Electrical & Electronics
Education
Shoes & Bags
Leisure & Entertainment
Food & Beverages
Jewellery & Watches
Supermarket
Sporting Goods
Fashion
Beauty & Health
Department Store
IT & Telecommunications
Notes:
(1) The top fiv e trade categories for 1Q 2021 include Food & Bev erage, Beauty & Health, Fashion, Supermarket and IT & Telecommunications.
(2) For the period January to March 2021. Excludes gross turnov er rent.
(3) Includes conv enience stores, bridal shops, optical shops, film processing shops, florists, magazine stores, pet shops, trav el agencies, cobblers/locksmiths, laundromats and clinics.
(4) Leisure & Entertainment was impacted by gov ernment-stipulated restrictions on trading hours and sales of alcohol at nightlife v enues like clubs, karaoke joints and bars without food licenses. 24Office
Office performance overview
Singapore and Germany office assets
Increase in leasing enquiries for
Office Total New and Renewal Leases expansion and new set-up space
Occupancy(1) (sq ft) Q-o-Q(4)
10%
94.9% 291,800
2%
as at 31 March 2021 1Q 2021 42%
8%
(New leases: 5.3%(2)) 7%
23%
Singapore office assets
46%
63%
Office Average Return of office community:
Occupancy(1) SG Office Rent(3) Week ended 16 Apr 2021
4Q 2020 1Q 2021
94.8% 51.3%
as at 31 March 2021
S$10.28psf Relocation Expansion Consolidation New set-up
as at 31 March 2021 Week ended 21 May 2021
Top three business sectors by space requirement
(CBRE SG Core CBD 1) IT, Media and Telecommunications (mainly
occupancy: 93.9%)
15.0% technology)
2) Banking, Insurance and Financial Services
(due to working from home as 3) Business Consultancy
Notes: default mode wef 16 May 2021)
(1) Based on committed occupancy as at 31 March 2021.
(2) NLA of new leases in 1Q 2021 is approximately 15,500 square feet, including Raffles City Tower and One George Street. Trade s ectors of new committed leases are from Maritime and Logistics, Financial
Serv ices, Food and Bev erage.
(3) Excludes Funan and The Atrium@Orchard. If including Funan and The Atrium@Orchard, the av erage Singapore office rent would be S$9.97psf.
(4) Observ ation based on leasing enquiries seen in CICT’s office portfolio. Percentages were based on required space and intentio n indicated by prospects and does not take into account their existing
space.
25Office
Occupancy rate of office portfolio at 94.9%
Occupancy for Singapore: Occupancy for Germany:
CICT’s office portfolio: 94.8% CICT’s portfolio: 95.4%
Core CBD: 93.9% Frankfurt Market: 93.6%(3)
96.9% 97.4% 100.0% 96.8% 100.0% 100.0% 100.0% 97.9% 100.0% 100.0% 100.0% 100.0% 100.0% 100.0%
96.4% 95.5%
92.2% 94.9% 92.2% 92.3%
78.5% 78.2%
(1)
Asia Square Tower CapitaGreen Capital Tower Six Battery Road 21 Collyer Quay(2) One George Street Raffles City Tower Funan (Office) The Atrium@ Gallileo Main Airport
2 Orchard (Office) Center
As at 31 Mar 2020 As at 31 Mar 2021
Notes:
(1) Six Battery Road’s occupancy expected to remain as such until partial upgrading is completed in phases.
(2) 21 Collyer Quay is currently undergoing upgrading; W eW ork has leased the entire NLA and the term is expected to commence in 4 Q 2021 on a gross rent basis.
(3) Frankfurt office market occupancy as at 4Q 2020.
26Office
Office rents committed above market levels
Market Rents of
Average Committed Comparative Sub-Market (S$)
Building Expired Rents Rents in 1Q 2021 Sub-Market
(S$) (S$) Cushman & (2)
(1) Knight Frank
Wakefield
Grade A
CapitaGreen 10.85 10.35 – 11.25 9.58 9.10 – 9.60
Raffles Place
Grade A
Six Battery Road 11.58 9.60 – 12.60 9.58 9.10 – 9.60
Raffles Place
Grade A
One George Street 9.22 8.80 – 9.90 9.58 9.10 – 9.60
Raffles Place
Notes:
(1) Source: Cushman & W akefield 1Q 2021.
(2) Source: Knight Frank 1Q 2021; based on leases of a whole floor office space on the mid-floor lev els of office properties and accounting for rent free period and other concessions.
For reference only: CBRE Pte. Ltd.’s 1Q 2021 Grade A core CBD rent is S$10.40 psf per m onth and they do not publish sub-m arket rents.
27Office
Proactively engaged with tenants to manage
their requirements
Weighted Average Lease to Expiry
3.0 Years
By Monthly Gross Rental Income
Total Office Portfolio(1) Lease Expiry Profile as at 31 March 2021
25.4% 26.2% 25.3%
22.0%
11.7%
10.0% 16.4% 16.1%
13.6%
11.5%
16.3% (2) 6.3% 7.0%
13.9%
2021 2022 2023 2024 2025 2026 and beyond
Monthly Gross Rental Income Net Lettable Area Completed
Notes:
(1) Includes Raffles City Tower, Funan (office), The Atrium@Orchard (office), Gallileo and Main Airport Center’s leases; and W eWork’s 7-year lease at 21 Collyer Quay which is expected to
commence in 4Q 2021.
(2) Includes JPM’s lease which constitutes 3% of total office NLA.
28Office
Addressing tenant space and leasing
requirements with flexibility and optionality
1Q 2021 Grade A office market rent at S$10.40 psf per month (1)
2021
Average rent of leases expiring is S$10.41 psf
(2) Period 1H 2021 2H 2021
20% 16
Rental Rental
% of % of
Rates of Rates of
11.60 Building Expiring Expiring
11.46 Expiring Expiring
15% 10.48 12 Leases Leases
Leases (S$) Leases (S$)
8.31
Asia Square Tower 2 2.8% 11.56 0.6% 11.84
10% 8
Capital Tower 3.5% 8.31 - -
5.5%
5% 4 CapitaGreen 2.6% 10.86 2.9% 12.08
3.4% 3.5%
2.6%
Six Battery Road 0.5% 10.09 2.1% 10.59
0% 0 Total Percentage/
Asia Square Tower 2
(3)
Capital Tower CapitaGreen Six Battery Road 9.4% 9.89 5.6% 11.44
Weighted Average
Average monthly gross rental rate for expiring leases (S$ psf / month)
Monthly gross rental income for leases expiring at respective properties X 100%
Monthly gross rental income for office portfolio
Notes:
(1) Source: CBRE Pte. Ltd. as at 1Q 2021.
(2) Four Grade A buildings only.
(3) Excludes ancillary retail leases.
29Office
Continue to proactively manage major leases
2022 2023
(1) (1)
Average rent of leases expiring is S$9.22 psf Average rent of leases expiring is S$11.00 psf
20% 16 20% 16
12.19 11.88
11.00 11.32 11.06
15% 12 15% 10.75 12
8.56
10% 8 10% 8
6.18
4.8% 4.5%
5% 4 5% 4.2% 4
3.2% 3.4% 3.5%
2.0%
0.2%
0% 0 0% (2)
0
Asia Square Tower 2 (2) Capital Tower CapitaGreen Six Battery Road Asia Square Tower 2 Capital Tower CapitaGreen Six Battery Road
Average monthly gross rental rate for expiring leases (S$ psf / month)
Monthly gross rental income for leases expiring at respective properties X 100%
Monthly gross rental income for office portfolio
Notes:
(1) Four Grade A buildings only.
(2) Excludes ancillary retail leases.
30Integrated Dev elopment
Occupancy rate of Integrated Developments
at 96.5%
99.3% 99.0% 99.3% 98.5%
95.6% 92.8%
(3)
Raffles City Singapore (1) Funan (2) Plaza Singapura & The Atrium@Orchard
As at 31 March 2020 As at 31 March 2021
Notes:
(1) Retail occupancy is 90.9% and office occupancy is 94.9% as at 31 March 2021.
(2) Retail occupancy is 98.4% and office occupancy is 100.0% as at 31 March 2021.
(3) Retail occupancy is 97.9% and office occupancy is 100.0% as at 31 March 2021.
31Integrated Dev elopment
Lease expiry profile(1) as at 31 March 2021
Weighted Average Lease Expiry
5.0 Years
by Monthly Gross Rental Income
23.9%
16.7%
15.5%
10.5%
8.9%
5.7%5.0%
3.6% 4.3%
3.2%
0.8% 1.5%
0.4%
2021 2022 2023 2024 2025 2026 and
beyond
Retail Office Hospitality
Note:
(1) Excludes gross turnov er rents.
32Integrated Dev elopment
Restructuring of RC Hotel lease
RC Hotel contributed 5.0% to CICT’s total gross rental income for March 2021
► Effective 1 January 2021
► No change to rent components: minimum
rent, service charge and variable rent
► Lease extended by additional five
years from 2036 to 2041
► Rebalancing fixed and variable
components
► Next rent review: January 2027
33Creating Value
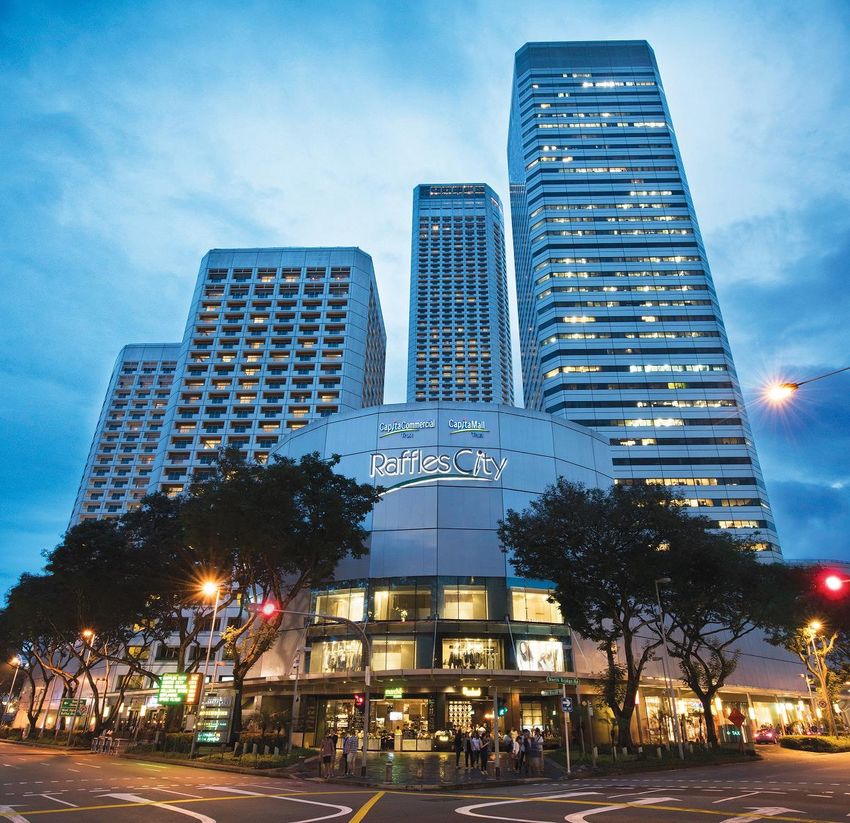
WestgateCapitaSpring on track to complete in 2H 2021;
50% of total NLA inked as at 15 Apr 2021
• Achieved a committed occupancy of 50% as
at 15 April 2021, with another 15% under
advance negotiation
Leasing Breakdown by Sectors based on
committed NLA
Legal, 2%
Real Estate and
Property
Services, 14%
Financial
Services, 14%
Banking, 70%
35CapitaSpring- Development for future growth
CapitaSpring has drawn down S$46.0 mil in 1Q 2021 –
CICT’s 45.0% share amounts to S$20.7 mil
CICT’s 45% interest in
Drawdown (2)
CICT’s 45% interest Glory Office Trust and
as at Mar 2021
Balance
Glory SR Trust
Debt at Glory Office
Trust and Glory SR S$531.0m (S$459.0m) S$72.0m
(1)
Trust
Equity inclusive of
S$288.0m (S$245.3m) S$42.7m
unitholder’s loan
Total S$819.0m (S$704.3m) S$114.7m
CapitaSpring: Artist’s impression and site progress
Notes:
(1) Glory Office Trust and Glory SR Trust hav e obtained borrowings amounting to S$1,180.0m (100% interest).
(2) Balance capital requirement until 2022.
36Ongoing asset enhancements to complete in
2021
SIX BATTERY ROAD 21 COLLYER QUAY LOT ONE SHOPPERS’ MALL
Artist’s impression: New 24/7 through-block link Artist’s impression: new lift lobby facade Artist’s impression: Expansion of library
✓ Rev ised target completion end-2021 ✓ 7-year lease to WeWork: ✓ TOP obtained on 29 October 2020
• Lease targeted to commence in and handed ov er to tenants for
✓ Leasing to be in tandem with 4Q 2021 internal fit-out works
phased works
✓ Achieved BCA Green Mark ✓ Cinema and library expected to
✓ Maintained BCA Green Mark Platinum open in 2H 2021
Platinum
✓ Cost: ~$45 million
✓ Cost: ~$35 million
37Refreshing shopper experience at Raffles City
Singapore
Level 1: New 24-hour café Level 1 and 2: New concept store Level 2: New fashion store
The Coffee Bean and Tea Leaf ONE ASSEMBLY - Collaboration between BHG and Raffles City Singapore PALEM
Basement 1: New F&B offerings Level 3: Online to offline
Tenjin Tarte by Cheryl Koh Hang Heung Lazada pop-up store
38Curating new retail experiences in 1Q 2021
Best Denki at Plaza Singapura Fluff Stack at W estgate Typhoon Café at Bugis+
Café Aux Bacchanales at Plaza Singapura KOMME at Plaza Singapura Levi's® Outlet at IMM Building
39Plan to align Clarke Quay's mall positioning with
upcoming changes in the vicinity
► Ongoing redevelopment of old Liang Court adjacent to
Clarke Quay will have higher residential component
► Clarke Quay tenants more affected by government-
stipulated restrictions on trading hours and sales of alcohol
at nightlife venues like clubs, karaoke joints and bars
without food licenses
► Reviewing asset plan for tenant mix change to be ready Aerial view of the Clarke Quay vicinity
for rejuvenation of the area
► Ongoing marketing plan to attract visitors
✓ Rediscover Clarke Quay via CapitaLand’s promotional
activity, Explore the City, where shoppers can join a walking
tour or participate in food thrills, among others, from 1 April
to 30 June
✓ Leverage Singapore Tourism Board's efforts - Slingshot, a thrill
ride where riders are rocketed almost 70m above ground,
will open in 2H 2021 Artist’s impression of Slingshot at Clarke
Quay. Photo credit: Slingshot
40Future-proofing our retail ecosystem via CapitaStar’s platform
More than Monthly App Traffic
1.1 Million 5.4 Million You can now offset your
A NEW
CapitaStar Members In December 2020
shopping and dining
with eCapitaVouchers
CAPITASTAR and STAR$
EXPERIENCE
Total number of eDeals Redeemed in 2020
Key Highlights
> 13,755,298 More than 560 brands
are now onboard eCapitaMall and Capita3Eats since launch in
Popular Malls Favourite Brands June 2020
Bugis Junction BHG
IMM Building Hai Di Lao
Plaza Singapura Sephora
Raffles City Singapore Uniqlo Most Clarins Most Afuri
Westgate Watsons Popular GameMartz Popular Ajisen Ramen
Brands Muji Brands Nando’s
41Ensuring
Sustainability
Main Airport Center, Frankfurt, GermanyCICT aligns with CapitaLand’s 2030 Sustainability Master Plan that
outlines targets and pathways for transition to a low-carbon business
CICT’s 2020 Sustainability Highlights
Environment
Build portfolio resilience & resource efficiency All CICT’s properties have green rating
Met FY 20201 operational efficiency targets compared to base
year of 2008 Green
Certified, 8.6%
LEED Gold,
CARBON EMISSION INTENSITY
4.0%
52.8% v s target of 23% reduction
Green Mark
Platinum,
ENERGY INTENSITY 47.8% Green Mark
35.7% v s target of 20% reduction Based on Gold, 13.2%
portfolio NLA
WATER INTENSITY with green
rating: 11.0
42.9% v s target of 20% reduction
million sq ft2
Achieved 5-star rating in the Global Real Estate Sustainability
Benchmark (GRESB) 2020 and ‘A’ for public disclosure
Green Mark
GoldPLUS,
26.4%
1
1 Overall, FY 2020 energy and water consumption levels were lower due to COVID -19 pandemic and circuit breaker
2 All properties in Singapore and Germany including CapitaSpring, a property under development.
43CICT aligns with CapitaLand’s 2030 Sustainability Master Plan that
outlines targets and pathways for transition to a low-carbon business
CICT’s 2020 Sustainability Highlights
Social Governance CICT’s inclusion in
sustainability indices
Enable thriving and future- Uphold high standards of
adaptive communities corporate governance • FTSE4Good Developed Index
• FTSE4Good ASEAN 5 Index
Focus on health and safety of
stakeholders, high performance
• MSCI Pacific ESG Leaders Index
culture for staff and delightful • iEdge ESG Leaders Index
customer experiences • STOXX® Global ESG Leaders
• Global ESG Governance Leaders
Sustainability-linked Funding
• First and second (under CCT and CMT • Has secured green and
respectively) on the Singapore Gov ernance
and Transparency I ndex (SGTI ) (REIT and sustainability-linked funds
Business Trust category)
• Fourth and seventh positions (under CCT and
CMT respectively) on the Gov ernance Index
for Trusts (GI FT) (REIT and Business Trust
category)
44Summary
Raffles City SingaporeLooking ahead
Immediate to medium-long term plan:
• Complete ongoing AEIs in 2021
• Complete CapitaSpring redev elopment in 2021
• Proactiv e leasing and tenant mix repositioning
Enhancing Portfolio • Portfolio reconstitution and capital recycling
Quality • Seek accretiv e acquisition
• Explore AEI plans for selected existing assets
• Explore redev elopment of selected existing assets (longer planning and execution timeline)
• Limited new supply in the retail and office markets to mitigate any softening demand
Singapore • Poised to benefit from improv ement in economic activ ity and consumer/business sentiment
on the back of the v accination rollout and flattening of the COVID-19 infection curve
Retail and Office
Outlook
• 1Q 2021 GDP growth was 1.3% year-on-year, the first quarterly growth since 4Q 2019(1)
• 2021 GDP growth forecast maintained at 4.0% to 6.0%(1)
Singapore • Overall unemployment rate is maintained at 2.9% for April 2021
Economy (1) Source: Ministry of Trade and Industry.
46Market
Information
Six Battery RoadRetail
CICT Market Share
Largest owner of private retail stock in Singapore (1)
CICT, 9.2%
Frasers Centrepoint Trust, 4.4%
Mercatus, 4.3%
Far East Organization, 3.3%
Lendlease, 3.0%
Mapletree Commercial Trust, 2.4%
City Dev elopments Limited, 2.2%
Others/Unknown,
65.3% Changi Airport Group, 2.0%
United I ndustrial Corporation Limited, 2.0%
Suntec REI T, 1.9%
Notes:
(1) Based on the total private stock recorded by Urban Redev elopment Authority (URA).
Sources: URA, CBRE Singapore, 4Q 2020
48Retail
Limited retail supply between 2021 and 2024
• Total retail supply in Singapore averages approximately 0.4 million sq ft (2021 - 2024),
significantly lower than:
― Last 3-year historical annual average supply (2018 - 2020) of 0.86 million sq ft
― Last 5-year historical annual average supply (2016 - 2020) of 1.1 million sq ft
Singapore Retail Supply (million sq ft)
0.5
0.4 0.542
0.3 0.24
0.2 0.379 0.133
0.021 0.117 0.038
0.1
0.055
0.024 0.097
0.032 0.055
0
2021 2022 2023 2024
Orchard Downtown Core Rest of Central Fringe Suburban
Source: CBRE Singapore, 1Q 2021
49Retail
Known future retail supply in Singapore (2021 – 2024)
None of the seven new projects with more than 100,000 sq ft NLA are located in Downtown
Expected Proposed Retail Projects Location NLA (sq ft)
completion
2021 Grantral Mall @ Macpherson (Citimac A&A) Macpherson Road 67,500
2021 Shaw Plaza Balestier(A/A) Balestier Road 100,500
2021 I12 Katong (A/A) East Coast Road 211,500
Subtotal (2021): 379,500
2022 Boulevard 88 Cuscaden Road/Orchard Boulevard 32,000
2022 Sengkang Grand Mall Sengkang Central 109,000
2022 Guoco Midtown Beach Road 24,300
2022 Komo Shoppes Upper Changi Road North/Jalan Mariam 24,800
2022 Club Street Retail/Hotel Development Club Street 33,300
2022 Wilkie Edge (A/A) Wilkie Road 21,200
2022 Le Meridien Singapore (A/A) Beach View 20,500
Subtotal (2022): 265,100
2023 IOI Central Central Bouelvard 30,000
2023 One Holland Village Holland Road 117,000
2023 Dairy Farm Residences Dairy Farm Road 32,300
2023 The Woodleigh Mall Bidadari Park Drive / Upper Aljunied Road 208,000
2023 Odeon Towers (A/A) North Bridge Road 25,000
Subtotal (2023): 412,300
2024 The Ryse Residences Pasir Ris Drive 289,900
2024 Mixed-use at Punggol Way Punggol Way 185,000
2024 T2 Airport (A/A) Airport Boulevard 67,000
2024 Labrador Villa Road Labrador Park 37,700
2024 Liang Court Redevelopment River Valley Road 96,900
Subtotal (2024): 676,500
Total forecast supply (2021-2024) 1,733,400
Sources: URA and CBRE Research
50Retail
Slight Q-o-Q drop in Orchard rents while
Suburban rents remain stable in 1Q 2021
Singapore Retail Rents and Quarterly GDP Growth
15.0% $40.00
$35.00
10.0%
$30.00
5.0%
$25.00
0.0% $20.00
Q1 2021 (1)
$15.00
2020
Q4 2012
Q2 2013
Q4 2013
Q2 2014
Q4 2014
Q2 2015
Q3 2019
Q1 2020
Q3 2020
Q1 2010
Q2 2010
Q3 2010
Q4 2010
Q1 2011
Q2 2011
Q3 2011
Q4 2011
Q1 2012
Q2 2012
Q3 2012
Q1 2013
Q3 2013
Q1 2014
Q3 2014
Q1 2015
Q3 2015
Q4 2015
Q1 2016
Q2 2016
Q3 2016
Q4 2016
Q1 2017
Q2 2017
Q3 2017
Q4 2017
Q1 2018
Q2 2018
Q3 2018
Q4 2018
Q1 2019
Q2 2019
Q4 2019
Q2 2020
Q4 2020
-5.0%
$10.00
-10.0%
$5.00
-15.0% $0.00
GDP Q/Q growth Orchard Suburban Linear (GDP Q/Q growth)
Notes:
(1) CBRE rev ised its basket of prime retail properties in 1Q 2021 by remov ing some of the older malls in Orchard Road. Subsequent to this change, on a Q-o-Q basis retail rents in Orchard Road dropped
0.2% while the same for Suburban were maintained for 1Q 2021.
Sources: CBRE, Department of Statistics Singapore.
51Retail
Singapore retail sales performance
Retail sales on a positive trajectory
(S$ billion)
4.0 30.0%
3.5 3.6
3.5 26.2%
3.2 25.0%
3.1
3.0 2.9 2.9
2.8 2.8 2.8 2.8 2.8
21.0% 2.7
2.6 20.0% 20.0%
2.5
2.3
2.0 16.3%
2.0 13.4% 12.4% 15.0%
12.6% 12.7% 14.4%
1.7 12.5% 12.0% 13.3%
1.5 11.7%
10.5% 10.0%
9.0%
1.0
6.3%
5.0%
0.5
0.0 0.0%
Y-o-Y +0.6% -10.2% -9.7% -32.8% -45.2% -24.2% -7.7% -8.4% -12.7% -11.2% -2.9% -4.5% -8.4% +7.7% +4.4% +39.2
Dec 2020
Feb 2021
Feb 2020
Mar 2020
Sep 2020
Mar 2021
Jan 2021
Jan 2020
May 2020
Jun 2020
Apr 2020
Jul 2020
Apr 2021
Oct 2020
Nov 2020
Aug 2020
Retail Sales (excl. motor vehicles) Online Sales Proportion
Source: Department of Statistics Singapore
52Office - Singapore
Singapore office stock as at end 1Q 2021
Island-wide office stock
Singapore Stock % of Grade A office
(sq ft) total Core CBD
Decentralised, Core CBD, stock
23.38% 50.58%
Core CBD 31.2 mil 50.58% 14.1 mil sq ft
(45.28% of Core
CBD stock)
Fringe CBD 16.1 mil 26.05%
Decentralised 14.4 mil 23.38%
Total 61.7 mil (22.04% of total
Fringe CBD, island wide stock)
26.05%
Source: CBRE, 1Q 2021
Figures m ay not add up due to rounding.
53Office - Singapore
Annual new supply averages 0.7 mil sq ft over 5 years;
CBD Core occupancy at 93.9% as at end-March 2021
Singapore Private Office Space (Central Area)(1) – Net Demand & Supply
2.5
Forecast average annual gross new supply
2.2
(2021 to 2024): 0.8 mil sq ft
1.9
2.0 1.9
1.8
1.6 1.6 1.7 Includes
CapitaSpring
1.5 1.4
1.3
sq ft million
1.0 1.0
1.0 0.8 0.8 0.8
0.7 0.7 0.8
0.6
0.5 0.3 0.3
0.2 0.2 0.2 0.2 0.2
0.0
-0.03
-0.1
-0.2
-0.5 2010 2011 2012 2013 2014 2015 2016 2017 2018 2019 2020 1Q 2021 2021F 2022F 2023F 2024F
Net Supply Net Demand Forecast Supply
Periods Average annual net supply(2) Average annual net demand
2011 – 2020 (through 10-year property market cycles) 0.8 mil sq ft 0.9 mil sq ft
2016 – 2020 (through 5-year property market cycles) 1.0 mil sq ft 0.9 mil sq ft
2021 – 2025 (forecast gross new supply) 0.7 mil sq ft N.A.
Notes:
(1) Central Area comprises ‘The Downtown Core’, ‘Orchard’ and ‘Rest of Central Area’.
(2) Supply is calculated as net change of stock ov er the quarter and may include office stock remov ed from market due to conv ersi ons or demolitions.
Sources: Historical data from URA statistics as at 1Q 2021; Forecast supply from CBRE Research as at 1Q 2021.
54Office - Singapore
Known future office supply in Central Area (2021 – 2024)
No commercial sites(1) on Government Land Sales Confirmed List (10 Jun 2021); Two white sites (2) on
reserve list, namely Kampong Bugis and Woodlands Ave 2 (Fringe Area)
Expected Proposed Office Projects Location NLA (sq ft)
completion
2021 Afro-Asia I-Mark Shenton Way 140,000
2021 CapitaSpring(3) Raffles Place 635,000
Subtotal (2021): 775,000
2022 Hub Synergy Point Redevelopment Tanjong Pagar 131,200
2022 Guoco Midtown Beach Road / City Hall 650,000
Subtotal (2022): 781,200
2023 Central Boulevard Towers Marina Bay 1,258,000
2023 333 North Bridge Road Beach Road / City Hall 40,000
Subtotal (2023): 1,298,000
2024 Keppel Towers Redevelopment Tanjong Pagar 525,600
2024 Shaw Towers Redevelopment Beach Road / City Hall 435,600
Subtotal (2024): 961,200
Total forecast supply (2021-2024) 3,815,400
Notes:
(1) URA receiv ed an acceptable minimum price for the white site at Marina View. URA will release the site for sale by public tender on 28 June 2021. Details of the Marina View white site: Site area of
0.78 ha, gross plot ratio of 13.0; estimated 905 housing units, 540 hotel rooms and 2,000 sqm commercial space (on reserv e li st since 4Q 2018).
(2) Details of the two white sites: (a) Kampong Bugis: GFA of 390,000 sqm; up to 4,000 housing units and commercial GFA of 10,000 sqm (on reserv e list since 4Q 2019);
(b) W oodlands Av e 2: Site area of 2.75 ha, gross plot ratio of 4.2; estimated 440 housing units, 78,000 sqm commercial space (on reserv e list since 4Q 2018).
(3) CapitaSpring reported committed take-up at 50% of the dev elopment’s NLA as at 15 April 2021.
Sources: URA, CBRE Research and respective media reports. 55Office - Singapore
Grade A office market stable Q-o-Q
1Q 19 2Q 19 3Q 19 4Q 19 1Q 20 2Q 20 3Q 20 4Q 20 1Q 21
Mthly rent (S$ / sq ft ) 11.15 11.30 11.45 11.55 11.50 11.15 10.70 10.40 10.40
% change 3.2% 1.3% 1.3% 0.9% -0.4% -3.0% -4.0% -2.8% 0%
$20
S$18.80
$18
Monthly gross rent by per square foot
$16
S$11.55
$14 S$11.06 S$11.40
$12
$10
S$10.40
$8
$6
S$9.55 S$8.95
$4 S$8.00
$2
S$4.48
Global financial Euro-zone
Post-SARs, Dot.com crash crisis crisis
$0
1Q02
3Q02
4Q02
1Q03
2Q03
3Q03
4Q03
2Q04
3Q04
4Q04
1Q05
2Q05
3Q05
4Q05
2Q06
3Q06
4Q06
1Q07
2Q07
3Q07
1Q08
2Q08
3Q08
4Q08
1Q09
2Q09
4Q09
1Q10
2Q10
3Q10
4Q10
1Q11
2Q11
4Q11
1Q12
2Q12
3Q12
4Q12
1Q13
3Q13
4Q13
1Q14
2Q14
3Q14
4Q14
2Q15
3Q15
4Q15
1Q16
2Q16
3Q16
4Q16
2Q17
3Q17
4Q17
1Q18
2Q18
3Q18
1Q19
2Q19
3Q19
4Q19
1Q20
2Q20
2Q02
1Q04
1Q06
4Q07
3Q09
3Q11
2Q13
1Q15
1Q17
4Q18
4Q 20
1Q 21
3Q 20
Source: CBRE Research (figures as at end of each quarter).
56Office - Germany
Information on Frankfurt and two submarkets
('000 sqm) Frankfurt Office (%)
800.0 16.0
700.0 14.0
600.0 12.0
500.0 10.0
400.0 8.0
300.0 6.4 6.0
200.0 4.0
100.0 2.0
0.0 0.0
2015 2016 2017 2018 2019 2020
Demand ('000 sqm) New Supply ('000 sqm) Vacancy rate (%)
(‘000 sqm) Banking District (%) Airport Office District (%)
(‘000 sqm)
800 16.0 800 16
700 14.0 700 14
600 12.0 600 12
500 10.0 500 10
400 8.0 400 8
300 6.0 300 6.2 6
4.7
200 4.0 200 4
100 2.0 100 2
0 0.0 0 0
2015 2016 2017 2018 2019 2020 2015 2016 2017 2018 2019 2020
Note: Demand for Banking District and Airport Office District is as at 1H 2020.
Source: CBRE Research, 4Q 2020.
57Office - Germany
New office supply in Frankfurt
About 68% and 35% of 2021F and 2022F new supply are owner-occupied or committed
(‘000 sq m)
300
Actual New Supply Forecast New Supply
250
200
5-Year (2016-2020) Average: 145,960 sq m
150
100
50
0
2012 2013 2014 2015 2016 2017 2018 2019 2020 2021F 2022F
Banking District New Supply Airport Office District New Supply Rest of Frankfurt New Supply
Source: CBRE Research, Frankfurt 4Q 2020.
58Office - Germany
Rental range in Frankfurt
Rental range by submarket
Frankfurt
West City CBD
(€ / square metre / month)
C
Westend B
44.0 44.0
D Gallileo
Banking 27.0 38.8
District
22.0
20.6
A5
B43
Niederrad
South
18.0 22.0
7.0
MAC A3 Frankfurt Frankfurt
Airport Office Frankfurt Total
Banking District
District
A (Region D)
(Region A)
ICE S-Bahn Expressway / Highway W eighted av erage
Source: CBRE Research, 1Q 2021
59Thank you
For enquiries, please contact: Ms Ho Mei Peng, Head, I nvestor Relations
Direct: (65) 6713 3668 | Email: ho.meipeng@capitaland.com
CapitaLand Integrated Commercial Trust Management Limited (http://www.cict.com.sg)
168 Robinson Road, #25-00 Capital Tow er, Singapore 068912
Tel: (65) 6713 2888 | Fax: (65) 6713 2999Additional
Information
Asia Square Tower 2Well-located properties across Singapore
Integrated Developments Office
1 CapitaSpring 1 Asia Square Tower 2
2 Funan 2 CapitaGreen
3 Raffles City Singapore 3 Capital Tower
4 Plaza Singapura 4 One George Street
5 The Atrium@Orchard 5 Six Battery Road
6 21 Collyer Quay
Retail
1 Bedok Mall
2 Bugis+
3 Bugis Junction
4 Bukit Panjang Plaza
5 Clarke Quay
6 IMM Building
7 JCube
8 Junction 8
PROPERTI ES I N SUBURBAN AREAS
9 Lot One Shoppers’ Mall
10 Tampines Mall
11 Westgate
62Owns 2 properties strategically located in Frankfurt
Airport Office District and Banking District
Excellent connectivity between Frankfurt airport and Frankfurt city centre via a
comprehensive transportation infrastructure network
Close proximity between
Frankfurt airport office district and
Frankfurt city centre
1
20 mins by Car
• Via A3 / A5 motorways
1. Gallileo
11 mins by Train
• Inter City Express (ICE) high
speed trains offer 204 domestic
and regional connections
2
15 mins by S-Bahn commuter
railway
• 4 stops to Frankfurt city centre
2. Main Airport
(Frankfurt central station) Center
63CICT: proxy for Singapore’s commercial real
estate
64Valuation largely stable over a six-month period
S$22.3 billion S$22.4 billion(1)
Value as at 31 Dec 2020 Value as at 30 Jun 2020
-0.4%
Valuation Valuation(1) Range of Cap Rates
Variance
as at 31 Dec 20
as at 31 Dec 20 as at 30 Jun 20
S$ million S$ million S$ million % %
Retail Assets 7,379.5 7,357.0 22.5 0.3 4.50 – 6.20
Office Assets(2) 8,516.7 8,544.4 (27.6) (0.3) 3.45 – 3.95
Retail: 4.40 – 4.85
Integrated
6,437.7 6,514.7 (77.1) (1.2) Office: 3.75 – 3.95
Dev elopment Assets
Hotel: 4.75
Total 22,333.9 22,416.1 (82.2) (0.4)
Notes: Numbers may not add up due to rounding
(1) For properties acquired as part of the merger, which was completed on 21 October 2020, the amount presented here represents the v aluation as at 30 June 2020
(2) Includes CICT’s share in joint v entures (45.0% in CapitaSpring, 50.0% in One George Street and 94.9% respectively in Gallileo and Main Airport Center).
Please see slides 66 to 68 for details.
65You can also read