Capturing China's Brightest Science & Technology STARs - Interactive Brokers
←
→
Page content transcription
If your browser does not render page correctly, please read the page content below
Capturing China’s
Brightest Science &
Technology STARs

Brendan Ahern
Chief Investment Officer
KraneShares

March 2, 2021

Exchange and Industry Sponsored Webinars are presented by unaffiliated third parties. Interactive
Brokers LLC is not responsible for the content of these presentations. You should review the
contents of each presentation and make your own judgment as to whether the content is appropriate
for you. Interactive Brokers LLC does not provide recommendations or advice. This presentation is
not an advertisement or solicitation for new customers. It is intended only as an educational
presentation.

Disclosures

Options involve risk and are not suitable for all investors. For information on the uses and risks of options, you can obtain
                                                                                                                            a copy of the Options
Clearing Corporation ris k dis clos ure docum ent titled Characteris tics and Ris ks of Standardized Options by calling (312) 542-6901.

Futures are not s uitable for all inves tors . The am ount you may los e m ay be greater than your initial inves tm ent. Before trading futures ,
pleas e read the CFTC Ris k Dis clos ure. For a copy vis it interactivebrokers .com .

Security futures involve a high degree of ris k and are not s uitable for all inves tors . The am ount you may los e m ay be greater than your initial
inves tm ent. Before trading s ecurity futures , pleas e read the Security Futures Ris k Dis clos ure Statem ent. For a copy vis it
Interactivebrokers .com .

There is a s ubs tantial ris k of los s in foreign exchange trading. The s ettlem ent date of foreign exchange trades can vary due to time zone
differences and bank holidays . When trading acros s foreign exchange m arkets , this m ay neces s itate borrowing funds to s ettle foreign
exchange trades . The interes t rate on borrowed funds m us t be cons idered when com puting the cos t of trades acros s m ultiple m arkets .

The Order types available through Interactive Brokers LLC’s Trader Works tation are des igned to help you lim it your los s and/ or lock in a profit.
Market conditions and other factors m ay affect execution. In general, orders guarantee a fill or guarantee a price, but not both. In extrem e
m arket conditions , an order m ay either be executed at a different price than anticipated or m ay not be filled in the m arketplace.

There is a s ubs tantial ris k of los s in trading futures and options . Pas t perform ance is not indicative of future res ults .

Any s tock, options or futures s ym bols dis played are for illus trative purpos es only and are not intended to portray recom m endations .

IRS Circular 230 Notice: Thes e s tatem ents are provided for inform ation purpos es only, are not intended to cons titute tax advice which may
be relied upon to avoid penalties under any federal, s tate, local or other tax s tatutes or regulations , and do not res olve any tax is s ues in your
favor.

Interactive Brokers LLC is a member of NYSE FINRA SIPC
KSTR
                                  3/02/2021

Capturing China’s
Brightest Science
& Technology STARs
Overview of the KraneShares SSE
STAR Market 50 Index ETF
(Ticker: KSTR)

Presenters:
              Brendan Ahern
              Chief Investment
              Officer at
              KraneShares

info@kraneshares.com                      1
Introduction to KraneShares
About KraneShares
Krane Funds Advisors, LLC is the investment manager for
KraneShares ETFs. Our suite of China focused ETFs
provides investors with solutions to capture China’s
importance as an essential element of a well-designed
investment portfolio. We strive to provide innovative, first
to market strategies that have been developed based on
our strong partnerships and our deep knowledge of
investing. We help investors stay current on global market
trends and aim to provide meaningful diversification.
Krane Funds Advisors, LLC is majority owned by China
International Capital Corporation (CICC).

                                                               2
Why China?

The China A-Share market is too big to ignore
Even though China is the world’s second largest economy and stock market, China A-Shares are still underrepresented in global
capital markets.

             Top 5 Country Weights in the MSCI All Country World                                Top 5 Country Weights in the MSCI All Country World
                        Index (Market Cap Weighted)1                                                          Index (GDP Weighted)1
      70                                                                                   30

      60
                                                                                           25
      50
                                                                                           20
      40
  %

                                                                                           15

                                                                                       %
      30

      20                                                                                   10

      10
                                                                                            5

        0
            United States          Japan            China            United   France        0
                                                                    Kingdom                     United States   China     Japan     Germany       India

1. Data from MSCI as of 12/31/2020. See page 21 for index definitions                                                                                     3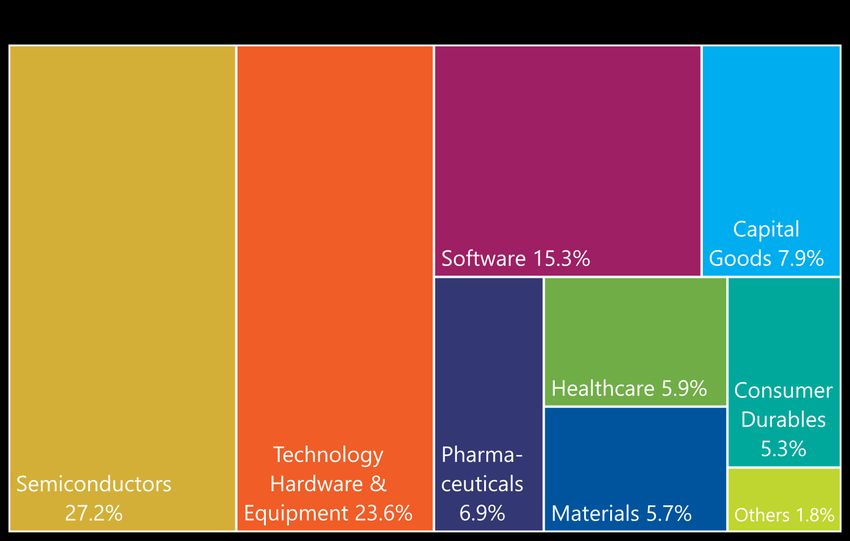
Why China?
Characteristics of Chinese listing venues
3M Average Daily Freely accessible to
No. of Listed Free-float Market Cap
Market Volume foreign investors*
Companies ($mm)
($mm) (%)
Mainland China 5,111 27,609 4,437,535 80%
Shanghai (Main) 2,032 33,079 2,175,991 80%
Shanghai (STAR Market) 229 19,938 105,792 12%
Shenzhen 2,850 29,811 2,155,752 80%
Offshore China 1,324 45,385 4,750,018 100%
US 427 72,400 1,908,353 100%
Hong Kong 897 18,370 2,841,665 100%
Total 12,870 246,592 18,375,106 —
Data from Bloomberg as of 2/23/2021. See pages 21 for index definitions.
*For mainland China A-shares the percentage of securities by market cap included in Northbound Hong Kong Stock Connect Program
Data not available for all securities.
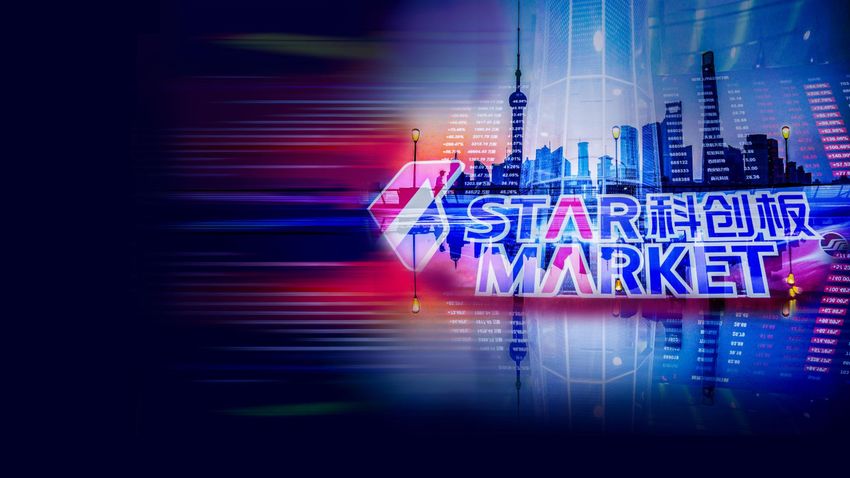
4Why China?
The STAR Market has been called the ‘Nasdaq of China’, and may follow a similar growth trajectory
Nasdaq Composite Index’s First 20 Years Performance History
50,000
45,000 In 1971 Nasdaq had a market cap
40,000 of $140 billion, while the NYSE had
a market cap of $1 trillion
35,000
Growth of 10,000 units
30,000
Today Nasdaq has a market cap of
25,000 $19 trillion and the NYSE has a
20,000
market cap of $26 trillion
15,000
Today STAR looks like Nasdaq in
10,000
1971, with a market cap of $100
5,000 billion, while the SSE* has a
market cap of $2.2 trillion.
0
Data from Bloomberg, retrieved 2/24/2021. See slide 21 for index definitions. Market cap figures are approximations. Index returns are for illustrative purposes only and do not represent actual fund
performance. Indexes are unmanaged and one cannot invest directly in an index. Index returns do not reflect fees or other costs associated with investing. Past performance does not guarantee future results.
*SSE: Shanghai Stock Exchange (SSE) Composite Index
5STAR Market
The STAR Market primarily supports high-tech infrastructure and strategic emerging industries
Companies included in the STAR Market seek to integrate several key themes within their core business.
Key Themes
Emerging Industries Artificial
Intelligence
High-tech
Internet
Manufacturing
High-end
New Generation IT Equipment New Materials
Big Data Cloud
Computing
Energy Conservation
& Environmental
New Energy Protection Biomedicine
Data from Star Market, “Overview”, star.sse.cn 6STAR Market
The STAR Market has been a top location for new listings
• The STAR Market has quickly gained recognition
as one of the world’s top IPO venues. 1 Listings STAR Market IPO Count Since Launch
on the STAR Market accounted for 47% of capital
raised across China’s Mainland A-Share market
in 2020.3
• COVID-19 contributed to a slowdown in global
IPO activity, with April/May experiencing a 48%
decrease in IPO volume.2
• In light of recent US legislation concerning the
potential delisting of US-listed Chinese stocks,
we believe some Chinese companies might
develop a stronger preference to listing on
domestic markets.
Source: Wind, CITIC Securities Research as of July 31, 2020
1. Bloomberg, “China’s Star Board Among World’s Top Three IPO Venues”, August 3, 2020.
2. EY, “COVID-19 pandemic slows global IPO activity YTD 2020”, June 29, 2020.
3. The Asset, “A bumper IPO year despite Covid-19”, December 14, 2020. 7STAR Market
The STAR Market’s unique listing rules and notable success since launching have quickly made the exchange an
attractive option for China’s leading science and technology unicorns
STAR Market Key Developments
President Xi Jinping introduced the concept of
the STAR Market to create a new funding source In just over a year, the STAR Market facilitated
for China’s rising science and technology 200 companies to raise $44 billion.2
companies.1
Jun.13, 2019: China launched the SSE STAR STAR Market listings accounted for 47% of
Market as a new science and technology board. capital raised across China’s Mainland A-Share
Trading of the first 25 companies started on July market in 2020.3
22.1
The SSE STAR 50 Index methodology is designed For the first time, Mainland investors have
to fast-track eligibility for China’s largest access to some of China’s leading, high quality
unicorns. tech companies.
1. SCMP, “Shanghai Stock Exchange to debut Nasdaq-style market for tech stocks on July 22, three weeks ahead of schedule”, July 5, 2019.
2. CNBC, “China’s experimental stock board gains 200th IPO just over a year after launching”, December 6, 2020.
3. The Asset, “A bumper IPO year despite Covid-19”, December 14, 2020.
8STAR Market
The STAR Market offers more inclusive standards compared to other markets in China
Historically, early-stage Chinese startups were forced to list abroad due to stringent listing requirements at home. The STAR
market allows such companies to list on a local exchange.
Mainland Chinese Exchange Offering and Listing Comparison
Shanghai / Shenzen STAR Market
Growing science and technology innovation
Targeted companies Large mature companies
companies
Net assets, cash flow, revenue, and net income Emphasize market value and revenue instead of net
requirements income requirements
In the last 3 fiscal years, the company has made
continuous profits and accumulated net profits in
Profit excess of 30 million CNY.
Or, the accumulated total operating revenue exceeds Do not have to be profitable or have accumulated
Finance & 300 million CNY. deficits to list.
Accounting
The cumulative net cash flow from operating activities Based on the estimated market value, revenue, net
Cash Flow
in the last three fiscal years exceeds 50 million CNY. income, R&D investment, cash flow and other factors
Intangible assets account for no more than 20% of net Must meet 1 of the 5 differentiated listing standards.
assets at the end of the latest period.
Net Assets
There is no undistributed deficit at the end of the latest
period.
Data from Star Market, “Offering Requirement”, star.sse.cn. See slide 21 for definitions of the equity markets included in the table. 9STAR Market
By meeting one of the five differentiated listing standards, applicants are eligible for listing on the STAR Market
The 5 Core Listing Standards of the STAR Market
1 2 3 4 5
Listing Operating
Profitability R&D Revenue Special
Standard Cash Flow
• Unlike other Mainland Chinese boards,
companies do not have to be profitable to
list. Market CNY 1.5
CNY 1 billion CNY 2 billion CNY 3 billion CNY 4 billion
Valuation billion
• This set of standards mirrors that of its
Companies need
US peer, the NASDAQ Global Market. to secure
Operating CNY100 CNY 200 CNY 300 CNY 300 approval from
• Delisting criteria are primarily based on Revenue million million million million state dept. and
(in the last Yr.)
meet
these standards. requirements
such as huge
Net Profit R&D Expense Operating market potential
to Operating Cash Flow & technical
Requirement Income advantage
for Standard
CNY 50 15% on CNY 100
million average in the million
past 3 years
Equal Ocean and STAR Market, “Offering Requirement”, star.sse.cn. 10STAR Market
The STAR Market may become the preferred listing venue for China’s unicorn startups
Top 10 Global Unicorn Ranking1
• A unicorn company, or unicorn startup, is a private Market Val.
Rank Company Industry Headquarters
company with a valuation over $1 billion.1 ($B)
• Currently, three of the world's five largest unicorns 1 ByteDance 140 Social Media China
are Chinese companies. 1 2 Ant Group 108 FinTech China
• China has 227 unicorns to-date, just slightly behind 3 SpaceX 74 Aerospace USA
the U.S. with 233.1
4 Didi Chuxing 62 Ride Sharing China
• For Chinese companies looking to go public, the
5 Stripe 36 FinTech USA
STAR Market may be a preferred location because
of its accelerated IPO approval process as well as Artificial
6 UiPath 35 USA
intelligence
the many potential advantages offered by domestic
Internet
7 Roblox 30 USA
listings. Software
Data Mgmt. &
8 Databricks 28 USA
Analytics
9 Rivian 28 Electric Vehicle USA
10 Nubank 25 Fintech Brazil
1. Data from Hurun Research Institute, Bloomberg Intelligence and CB Insights, retrieved 2/19/2021. 11STAR 50 Index
STAR 50 Index methodology is designed to expedite eligibility for China’s largest unicorns
Eligibility Timeline for STAR 50 Index Inclusion:
Eligible for inclusion after…
1 Month
for securities among top 3 by average daily The Index
market value since initial listing prioritizes the
largest IPOs for
IPO debuts on expedited
the STAR Market inclusion
3 Months
for securities among top 5 by average daily
market value since initial listing
6-12 Months for remaining securities
that are not among top ranking for average
daily market value.
Source: Shanghai Stock Exchange. 12KSTR
KSTR’s holdings consist primarily of “new economy” sectors, with a combined weight of over 80% in
information technology and healthcare
KSTR Sector Breakdown
Materials Energy
Consumer 6% 1%
Discretionary
6%
Industrials
8%
Health Care
13%
Information
Technology
66%
Data from Bloomberg as 2/19/2021. 13STAR Market
Chinese government policies aim to make China more self-sufficient in chip manufacturing
• China established a new national semiconductor fund
China's semiconductor annual trade2
worth $28.9 billion in 2019, aimed at closing the
350
technology gap with the US.1
300
• As stated in the “Made in China 2025” initiative, China
aims to produce 70% of the semiconductors used 250
domestically by 2025 and have complete import
(US$ billions)
200
substitution by 2030.2
150
• The Chinese government has instated policies to further
promote the semiconductor industry, such as providing 100
tax exemptions for the next 10 years. 2
50
0
2010 2011 2012 2013 2014 2015 2016 2017 2020 2030
Imports Exports Export targets
1. WSJ, “China Sets Up New $29 Billion Semiconductor Fund”, Oct. 25, 2019.
2. Source: SCMP,” ‘Made in China 2025’: How Beijing is boosting its semiconductor industry”, September 25, 2018. Data from China Semiconductor Industry Association. 14STAR Market
Substantial R&D investment shows STAR Market companies’ commitment to innovation and development
• R&D investment for the 50 constituent companies included
in the STAR 50 Index at the time of launch was, on average, Average R&D percent of revenue across
13% of operating income, compared to 5.6% for its peers 10%
Chinese markets
9.4%
on the main board.1,2 9%
• In 2019, companies on the STAR Market were granted 8%
more than 2,500 patents, 1,100 of which were invention 7%
patents.3 6%
4.9%
5%
• Additionally, 13 companies have won China’s National 3.9%
4%
Science and Technology Progress Award.2
3% 2.5%
2%
1.3%
1%
0%
Shanghai Shenzhen SME Board GEM Board STAR Market
Exchange Exchange
Source: ICBC, retrieved 2/23/2021. See slide 21 for term definitions.
1. Shanghai Stock Exchange, “Q&A on Launching SSE STAR Market 50 Constituent Index”, June 19, 2020.
2. SCMP, “Xi Jinping’s trillion-yuan baby, the Star Market, is poised for the next spurt of growth”, July 25, 2020.
3. Xinhua, “Economic Watch: China's STAR board promotes innovative, inclusive market”, June 6, 2020. 15KSTR
KSTR’s top 10 holdings have shown high R&D investment and strong revenue growth
KSTR Companies
U.S. Comparable
Top 10 KSTR Holdings Weight % Primary Business 1 Year Average
R&D Expenditure % Business
Revenue Growth
of Sales
Rate
Montage Technology 9.5% Semiconductors -1% 15% Intel
Beijing Kingsoft Office Software 9.2% Software 40% 38% Microsoft
Shenzhen Transsion Holding 7.9% Technology Hardware, Storage 12% 3% Apple
Raytron Technology Co Ltd 6.1% Electronic Equipment 78% 16% TE Connectivity
Beijing Roborock Technology 5.8% Household Durables 38% 5% Irobot Corp.
China Resources Microelectronics 5.3% Semiconductors -8% 8% Texas Instruments
Amlogic Shanghai Inc 4.0% Semiconductors 0% 20% Qualcomm
National Silicon Industry 3.7% Semiconductors 48% 6% Micron
China Railway Signal & Communication 3.6% Electronic Equipment 4% 4% Wabtec
Ningbo Ronbay 3.5% Batteries 38% 4% General Electric
Total: 58.6% Average: 25% Average: 12%
Data from Bloomberg as of 1/31/2021. Fund holdings subject to change.
On November 12, 2020, Executive Order 13959 (“Executive Order”) was issued, prohibiting transactions by U.S. persons in certain Chinese issuers’ securities (“Subject Securities”), beginning on January 11,
2021. KSTR will fully comply with the Executive Order. While the underlying index for KSTR (the SSE Science and Technology Innovation Board 50 Index) includes Subject Securities, the KSTR portfolio has
been optimized and will not include any Subject Securities. 16KSTR
Companies within KSTR help advance China’s national strategy development goals
National New Infrastructure Development Initiative Goals1
Theme Goals Example KSTR Holdings
Ensure nationwide 5G coverage by 2025, with plans to have 5 million 5G base
5G
stations across the country by 2025
KSTR weight: 4.0% KSTR weight: 1.3%
Artificial
Establish 20 AI innovative trial zones nationwide by 2023
Intelligence
KSTR weight: 9.6% KSTR weight: 0.6%
Construct a range of data centers (including big data centers, super data centers
Big Data Centers
and edge-computing data centers) by 2025
KSTR weight: 1.4% KSTR weight: 0.5%
Build 3-5 world class industrial Internet of Things (IoT) platforms by 2025 to
Industrial Internet
improve digital connectivity for at least a million enterprises
KSTR weight: 3.7% KSTR weight: 1.6%
Intercity High-
Extended the railway network by more than 4,000 km in 2020, with 2,000 km
speed Rails & Rail
designated for high-speed rails
Transportation KSTR weight: 3.6%
Electric Vehicle
Build an additional 12,000 electric vehicle charging stations in 2020 and have over
Charging &
36,000 in total by 2025
Batteries KSTR weight: 0.8% KSTR weight: 3.5%
1. Nikkei Asian Review, CCID Think Tank, China Briefing, retrieved 12/31/2020. Fund holding weights as of 1/31/2021. 17STAR 50 Index
The STAR 50 Index companies exhibit low correlation to other global markets
Index Correlation to the STAR 50 Index
Nasdaq
MSCI ACWI MSCI EAFE MSCI EM MSCI USA MSCI China MSCI Frontier Composite STAR 50
MSCI ACWI 1 0.90 0.90 0.97 0.69 0.62 0.87 0.24
MSCI EAFE 0.90 1 0.83 0.78 0.51 0.52 0.60 0.08
MSCI EM 0.90 0.83 1 0.83 0.80 0.45 0.73 0.40
MSCI USA 0.91 0.78 0.83 1 0.69 0.64 0.95 0.27
MSCI China 0.69 0.51 0.80 0.69 1 0.29 0.71 0.47
MSCI Frontier 0.62 0.52 0.45 0.64 0.29 1 0.57 0.04
Nasdaq
Composite 0.87 0.60 0.73 0.95 0.71 0.57 1 0.32
STAR 50 0.24 0.08 0.40 0.27 0.45 0.04 0.32 1
• MSCI ACWI Index (ACWI) - All Country World Index • MSCI China Index (China) - Chinese companies listed in Hong Kong & USA
• MSCI EAFE Index (EAFE) - Europe, Australasia and Far East • MSCI Frontier Markets Index (Frontier) - Frontier Markets
• MSCI Emerging Markets Index (EM) - Emerging Markets • NASDAQ Composite Index
• MSCI USA Index (USA) – United States of America • STAR 50 Index – companies listed on Shanghai’s STAR Market
Source: Table from Bloomberg, weekly correlation from July 23, 2020 to December 31, 2020. See slide 21 for index definitions.
18Conclusion
Investment Strategy:
KSTR KSTR seeks to track the performance of the Shanghai Stock Exchange (SSE) Science and Technology Innovation Board 50 Index
(STAR 50 Index). The Index is comprised of the 50 largest companies listed on the SSE Science and Technology Innovation Board
(STAR Market) as determined by market capitalization and liquidity.
KraneShares SSE STAR
Market 50 Index ETF STAR Market Highlights:
• Facilitates the fast-tracking of private science and technology companies to an initial public offering (IPO).
• Since its establishment in July 2019, the STAR Market has become one of the largest IPO markets globally1 and a premier listing
venue for prominent Chinese unicorns (privately held startup companies valued at over $1 billion).
• Recent increases in fund-raising activity on Chinese exchanges can largely be attributed to the STAR Market, which accounted for
47% of capital raised across China’s Mainland A-Share market in 2020.2
• Potential inclusion in the SSE Composite Index and Shanghai-Hong Kong Stock Connect could result in greater flows for STAR
Market securities.
KSTR Features:
• Exposure to companies poised to be China’s future leaders across industries that could represent the growth engine of China for
decades to come.
• Innovation-driven science and technology companies in China that offer a potential source of uncorrelated, long-term growth.
• Includes companies from industries such as new-generation information technology, biomedicine, new energy, and
environmental protection.
1. YiCai Global, “China’s Year-Old Star Market Outshines the Venerable Nasdaq”, July 23, 2020.
2. The Asset, “A bumper IPO year despite Covid-19”, December 14, 2020 19Fund Details As of 1/31/2021 Top Ten Holdings
as of 1/31/2021 excluding cash.
The Fund’s Holdings are Subject to Ticker %
Primary Exchange NYSE Arca
KraneShares SSE STAR Market 50 Index ETF Change.
(Ticker: KSTR) CUSIP 500767694 MONTAGE TECHNO-A 688008 9.52
KSTR seeks to track the performance of the Shanghai Stock Exchange ISIN US5007676944 BEIJING KINGSO-A 688111 9.21
(SSE) Science and Technology Innovation Board 50 Index.
SHENZHEN TRANS-A 688036 7.94
The Index is comprised of the 50 largest companies listed on the SSE Total Annual Fund Operating
0.89%
Science and Technology Innovation Board (STAR Market) as determined Expense RAYTRON TECHNO-A 688002 6.08
by market capitalization and liquidity.
Inception Date 1/27/2021 BEIJING ROBORO-A 688169 5.82
CHINA RESOURCE-A 688396 5.28
Distribution Frequency Annual
AMLOGIC SHANGHAI INC-A 688099 3.97
SSE Science and
Index Name Technology Innovation NATIONAL SILIC-A 688126 3.71
Board 50 Index
CHINA RAILWAY -A 688009 3.59
Number of Holdings (ex Cash) 50 NINGBO RONBAY -A 688005 3.52
KSTR Performance History as of 1/31/2021
Cumulative % Average Annualized %
1 Mo 3 Mo 6 Mo Since Inception 1 Yr 3 Yr Since Inception
Fund NAV — — — -2.72% — — —
Closing Price — — — -2.56% — — —
Index 3.33% 5.79% 1.53% -3.60% — — —
The performance data quoted represents past performance. Past performance does not guarantee future results. The investment return and principal value of an investment will fluctuate so that an
investor's shares, when sold or redeemed, may be worth more or less than their original cost and current performance may be lower or higher than the performance quoted. For performance data current
to the most recent month end, please visit www.kraneshares.com.
Index returns are for illustrative purposes only. Index performance returns do not reflect any management fees, transaction costs or expenses. Indexes are unmanaged and one cannot invest directly in an
index.
20Index Definitions:
Shanghai Stock Exchange (SSE) Science and Technology Innovation Board 50 Index (STAR 50 Index): is comprised of the 50 largest securities listed on SSE Science and Technology Innovation Board (STAR Market) as
determined by highest market capitalization and liquidity. Constituents are weighted by a float-adjusted market capitalization with a 10% weight limit for a single constituent, and the top five constituents total weighting
cannot be more than 40%. The index is adjusted and rebalanced quarterly and the adjustment will be effective end of next trading day.
MSCI China A (Net Return USD) Index: captures large and mid-cap representation across China securities listed on the Shanghai and Shenzhen exchanges. The index covers only those securities that are accessible
through "Stock Connect". The index is designed for international investors and is calculated using China A Stock Connect listings based on the offshore RMB exchange rate (CNH).
MSCI China USD Net Index: captures large and mid cap representation across China H shares, B shares, Red chips and P chips.
MSCI EAFE USD Gross Index: is an equity index which captures large and mid cap representation across Developed Markets countries around the world, excluding the US and Canada.
MSCI Emerging Markets USD Net Index: captures large and mid cap representation across 23 Emerging Markets (EM) countries.
MSCI USA USD Net Index: The MSCI USA Index is designed to measure the performance of the large and mid cap segments of the US market.
MSCI Frontier Markets (FM) USD Gross Index: captures large and mid cap representation across 29 Frontier Markets countries. The index was launched on December 18, 2017.
MSCI ACWI Market Cap Weighted USD Net Index: captures large and mid cap representation across 23 Developed Markets (DM) and 23 Emerging Markets (EM) countries.
MSCI ACWI GDP Weighted USD Net Index: captures large and mid cap representation across 23 Developed Markets (DM) and 23 Emerging Markets (EM) countries, weighted by GDP.
MSCI China All Shares Index: captures large and mid-cap representation across China A‐shares, B‐shares, H‐shares, Red‐chips, P‐chips and foreign listings (e.g. ADRs). The index aims to reflect the opportunity set of
China share classes listed in Hong Kong, Shanghai, Shenzhen and outside of China.
CSI Overseas China Internet Index: The CSI Overseas China Internet Index selects overseas listed Chinese Internet companies as the index constituents; the index is weighted by free float market cap. The index can
measure the overall performance of overseas listed Chinese Internet companies. The Index is within the scope of the IOSCO Assurance Report as at 30 September 2018. The index was launched on September 20, 2011.
Shanghai Stock Exchange (SSE) Composite Index is composed of all eligible stocks and CDRs listed on Shanghai Stock Exchange. This index is designed to reflect to overall market performance of companies listed on
Shanghai Stock Exchange.
Shenzhen Stock Exchange Composite Index is an actual market-cap weighted index (no free float factor) that tracks the stock performance of all the A-share and B-share listed on Shenzhen Stock Exchange. The index
was developed on April 3, 1991 with a base price of 100. Index trade volume on Q is scaled down by a factor of 1000. This is a total return Index.
Hang Seng China Enterprises Index: serves as a benchmark that reflects the overall performance of Mainland securities listed in Hong Kong.
Nasdaq Composite Index: The Nasdaq Composite Index measures all Nasdaq domestic and international based common type stocks listed on The Nasdaq Stock Market. The index was launched on February 1, 1971.
Terms:
ChiNext Board: subsidiary of the Shenzhen Stock Exchange, designed for growing innovative companies. The first batch of companies began trading on October 30, 2009.
SME Board: subsidiary of the Shenzhen Stock Exchange, designed for small and medium sized enterprises. The first batch of companies began trading in May 2005.
Main Board: refers to the Shanghai and Shenzhen Stock Exchanges, designed for larger, more mature companies.
GEM Board: short for the Growth Enterprise Market, a subsidiary of the Hong Kong Stock Exchange (HKSE) for growth companies that do not meet the profitability and/ or track record requirements of the HKSE. The first
batch of companies began trading in 1999.
Slide 8 Citations:
Timeline dates up to Feb. 17, 2020 sourced from STAR Market and shine.cn, “Nearly one year on, city's technology board is a star”, June 10, 2020. The remaining citations are sourced from the following:
1. Data from Bloomberg
2. Caixin Global, “China to Launch SSE STAR 50 Index to Track New Nasdaq-Style Board”, July 20, 2020.
3. Lenovo, “Lenovo Proposed Issuance and Admission of CDRs on Shanghai Stock Exchange STAR Market”, January 12, 2021.
21Important Notes:
Carefully consider the Funds’ investment objectives, risk factors, charges and expenses before investing. This and additional information can be found in the Funds‘ full
and summary prospectus, which may be obtained by visiting www.kraneshares.com. Read the prospectus carefully before investing.
Risk Disclosures:
Investing involves risk, including possible loss of principal. There can be no assurance that a Fund will achieve its stated objectives. The Funds are subject to political, social or
economic instability within China which may cause decline in value. Fluctuations in currency of foreign countries may have an adverse effect to domestic currency values.
Emerging markets involve heightened risk related to the same factors as well as increase volatility and lower trading volume.
Narrowly focused investments may be subject to higher volatility. The Fund's assets are expected to be concentrated in an industry or group of industries to the extent that the
Underlying Index concentrates in a particular industry or group of industries. The securities of companies in an industry or group of industries could react similarly to market
developments. Thus, the Fund is subject to loss due to adverse occurrences that affect one industry or group of industries or sector. The Fund may invest in derivatives, which
are often more volatile than other investments and may magnify the Fund's gains or losses. The Fund is non-diversified.
The ability of the fund to achieve its investment objectives is dependent, in part, on the continuous availability of A Shares and the ability to obtain, if necessary, additional A
Shares quota. If a Fund is unable to obtain sufficient exposure to limited availability of A Share quota, the Fund could seek exposure to the component securities of the
Underlying Index by investment in other types of securities.
The Fund may invest in Initial Public Offerings (IPOs). Securities issued in IPOs have no trading history, and information about the companies may be available for very limited
periods. In addition, the prices of securities sold in IPOs may be highly volatile. In addition, as the Fund increases in size, the impact of IPOs on the Fund's performance will
generally decrease.
Diversification does not ensure a profit or guarantee against a loss.
Fund shares are bought and sold on an exchange at market price (not NAV) and are not individually redeemed from the Fund. However, shares may be redeemed at NAV directly
by certain authorized broker-dealers (Authorized Participants) in very large creation/redemption units. The returns shown do not represent the returns you would receive if you
traded shares at other times. Shares may trade at a premium or discount to their NAV in the secondary market. Brokerage commissions will reduce returns. Beginning
12/23/2020, market price returns are based on the official closing price of an ETF share or, if the official closing price isn't available, the midpoint between the national best bid
and national best offer ("NBBO") as of the time the ETF calculates the current NAV per share. NAVs are calculated using prices as of 4:00 PM Eastern Time.
The KraneShares ETFs are distributed by SEI Investments Distribution Company (SIDCO), which is not affiliated with Krane Funds Advisors, LLC, the Investment Adviser for the
Fund.
22Although Krane Funds Advisors LLC and its affiliates (“Krane”) shall obtain data from sources that Krane considers reliable, all data contained herein is provided “as is” and
Krane makes no representation or warranty of any kind, either express or implied, with respect to such data, the timeliness thereof, the results to be obtained by the use
thereof or any other matter. Krane expressly disclaims any and all implied warranties, including without limitation, warranties of originality, accuracy, completeness,
timeliness, non-infringement, merchantability and fitness for a particular purpose.
Forward-looking statements (including Krane’s opinions, expectations, beliefs, plans, objectives, assumptions, or projections regarding future events or future results)
contained in this presentation are based on a variety of estimates and assumptions by Krane. These statements generally are identified by words such as “believes,” “expects,”
“predicts,” “intends,” “projects,” “plans,” “estimates,” “aims,” “foresees,” “anticipates,” “targets,” “should,” “likely,” and similar expressions. These also include statements
about the future, including what “will” happen, which reflect Krane’s current beliefs. These estimates and assumptions are inherently uncertain and are subject to numerous
business, industry, market, regulatory, geo-political, competitive, and financial risks that are outside of Krane’s control. The inclusion of forward-looking statements herein
should not be regarded as an indication that Krane considers forward-looking statements to be a reliable prediction of future events and forward-looking statements should not
be relied upon as such. Neither Krane nor any of its representatives has made or makes any representation to any person regarding forward-looking statements and neither of
them intends to update or otherwise revise such forward-looking statements to reflect circumstances existing after the date when made or to reflect the occurrence of future
events, even in the event that any or all of the assumptions underlying such forward-looking statements are later shown to be in error. Any investment strategies discussed
herein are as of the date of the writing of this presentation and may be changed, modified, or exited at any time without notice.
This material represents an assessment of the market environment at a specific point in time and is not intended to be a forecast of future events, or a guarantee of future
results. This information should not be relied upon by the reader as research or investment advice regarding the funds or any stock in particular. [R_US_KS]
23You can also read