CAR ImageCat - RECONSTRUCTION IN NEW ZEALAND POST 2010-11 CHRISTCHURCH EARTHQUAKES
←
→
Page content transcription
If your browser does not render page correctly, please read the page content below
ReBuilDD Field Trip February 2012

RECONSTRUCTION IN NEW ZEALAND
POST 2010-11 CHRISTCHURCH EARTHQUAKES

Stephen Platt

Christchurch city centre, February 2012

     UNIVERSITY OF
     CAMBRIDGE
                                          ImageCat   CAR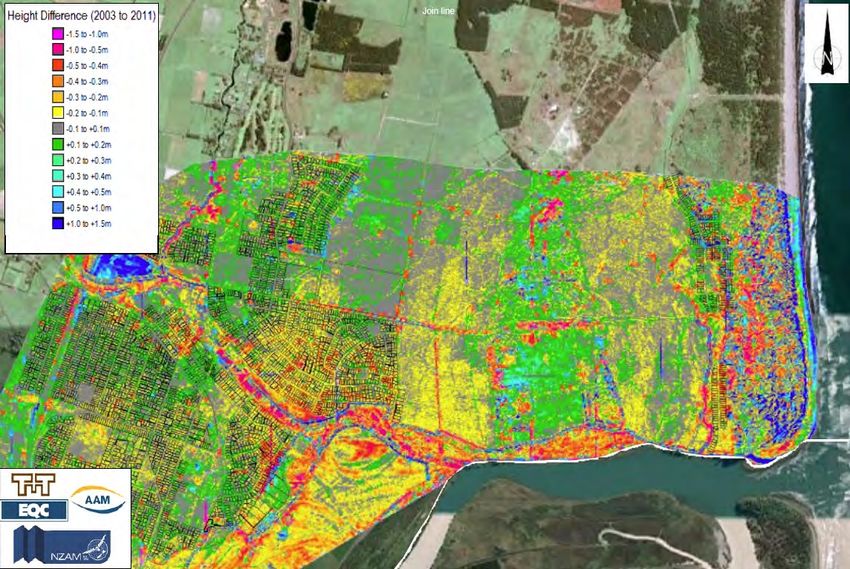
Published by
Cambridge Architectural Research Ltd.
CURBE was established in 1997 to create a structure for interdisciplinary collaboration for
disaster and risk research and application. Projects link the skills and expertise from distinct
disciplines to understand and resolve disaster and risk issues, particularly related to reducing
detrimental impacts of disasters. CURBE is based at the Martin Centre within the Department of
Architecture at the University of Cambridge.

About the research
This report is one of a number of outputs from a research project funded by the UK Engineering
and Physical Sciences Research Council (EPSRC), entitled Indicators for Measuring,
Monitoring and Evaluating Post-Disaster Recovery.
The overall aim of the research is to develop indicators of recovery by exploiting the wealth of
data now available, including that from satellite imagery, internet-based statistics and advanced
field survey techniques. The specific aim of this trip report is to describe the planning process
after major disaster with a view to understanding the information needs of planners.

Project team
The project team has included Michael Ramage, Dr Emily So, Dr Torwong Chenvidyakarn and
Daniel Brown, CURBE, University of Cambridge Ltd; Professor Robin Spence, Dr Stephen Platt
and Dr Keiko Saito, Cambridge Architectural Research; Dr Beverley Adams and Dr John
Bevington, ImageCat. Inc; Dr Ratana Chuenpagdee, University of Newfoundland who led the
fieldwork team in Thailand; and Professor Amir Khan, University of Peshawar who led the
fieldwork team in Pakistan.
The Steering Committee included Professor Arleen Hill, Department of Earth Sciences,
University of Memphis, USA; Professor Peter Atkinson, School of Geography, University of
Southampton, UK; Professor Ian Davis, Cranfield University, UK; Mr. Doekle Wielinga, World
Bank.

Second edition 1 August 2012
ISBN 978-0-9558384-8-4
All rights reserved. This material is copyright but may be reproduced by any method without fee for
educational purposes but not for resale. Formal permission is required for all such uses but normally will
be granted immediately. For copying in other circumstances or for re-use in other publications, or for
translation or adaptation, prior written permission must be obtained from the copyright owner.

Field Trip to Christchurch, February 2012                                                                    ii
Reconstruction in New Zealand
             post 2010-11 Christchurch Earthquakes

                                            Stephen Platt

Field Trip to Christchurch, February 2012                   iii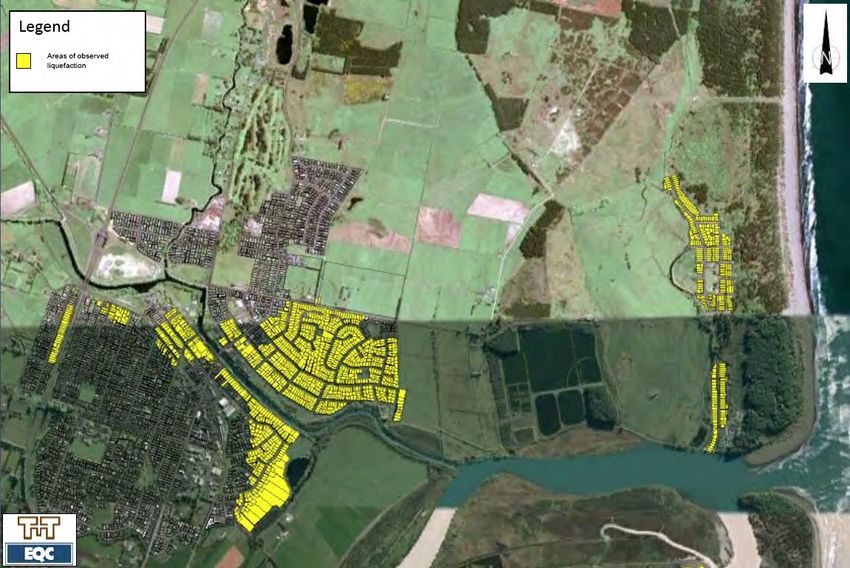
ACKNOWLEDGEMENTS
The funding for this field trip was provided by the EPSRC. We received the most generous
help and hospitality from everyone we met in New Zealand. In particular:
Canterbury Earthquake Authority, CERA
Diane Turner, General Manager, Strategy, Policy and Planning, CERA, diane.turner@cera.govt.nz
Julian Carver, Chief Information Officer, CERA, julian.carver@cera.govt.nz
Christchurch City Council
Carolyn Ingles, Project Director Central City Plan, Christchurch City Council, Carolyn.Ingles@ccc.govt.nz
Nigel Banks, Business & Information Services Team Leader, Christchurch CC, nigel.banks@ccc.govt.nz
Waimakakiri District Council
Victoria Caseley, District Plan Manager, Waimakakiri District Council, victoria.caseley@wmk.govt.nz l
Madeleine Burden, Community Development Advisor, madeleine.burdon@wmk.govt.nz
Environment Canterbury (ECAN) Canterbury Regional Council
Bill Simpson, Communications & Relations Manager, Resilience Unit, bill.simpson@ecan.govt.nz
Rebuilding Christchurch
Antonia Ineson, Rebuilding Christchurch, antonia.ineson@googlemail.com
Glen Saunders, Rebuilding Christchurch, glen.saunders@gmail.com
Earthquake Commission and Consulting Engineers
Bruce Deam, Earthquake engineer responsible for IT/GIS, Tonkin & Taylor, b.deam@Tonkin.co.nz
Rod Cameron, Stronger Christchurch Infrastructure Rebuild Team, rod.cameron@strongerchch.co.nz
Engineers, Architects and Academics
Andy Buchanan, Professor of Engineering, University of Canterbury, andy.buchanan@canterbury.ac.nz
Andrew King, HoD: Risk & Society, GNS Science, a.king@gns.cri.nz
Jasper van der Lingen, Architect, Sheppard & Rout, jvanderlingen@sheprout.com
Thomas Wilson, Lecturer in Hazard and Disaster Management, University of Canterbury,
thomas.wilson@canterbury.ac.nz
Bronwyn Hayward, Senior Lecturer, Political and Social Sciences, University of Canterbury,
bronwyn.hayward@canterbury.ac.nz
Di Lucas, Lucas Associates, Landscape Architects, di@lucas-associates.co.nz
Salman Ashraf, GNS Science, s.ashraf@gns.cri.nz
Katie Jones, GNS Science, k.jones@gns.cri.nz
Andrew Charleson, Assoc Professor, Architecture, University of Wellington,
andrew.charleson@vuw.ac.nz
Jennifer Dixon, Professor of Planning, University of Auckland
Suzanne Wilkinson, Associate Professor of Planning, University of Auckland,
s.wilkinson@auckland.ac.nz
Yan Chang, Civil and Environmental Engineering, University of Auckland, s ycha233@auckland.ac.nz
Ali Memon, Ali.Memon@lincoln.ac.nz
Bruce Glavovic, Joint Centre for Disaster Research, Massey University, b.glavovic@massey.ac.nz
Sonia Giovinazzi, Research Fellow, University of Canterbury, sonia.giovinazzi@canterbury.ac.nz
Paul Dalziel, Deputy Director AERU, Lincoln University, Christchurch. paul.daziel@lincoln.ac.nz
Bill Gregory, Architect, Warren & Mahoney, bill.gregory@wam.co.nz
MP
Lianne Dalziel, MP Christchurch East, lianne.dalziel.mp@parliament.govt.nz
Field trip organisation:
John D’Andreae, Professor Electrical Engineering (Retired), University of Canterbury
Katherine and John Peet, Lecturer, Chemical and Process Engineering (Retired), University of
Canterbury

Field Trip to Christchurch, February 2012                                                               iv
CONTENTS

Introduction                                                                  1
The Christchurch earthquakes                                                  2
                     Damage in residential areas                              3
                     Damage in CBD                                            6
                     Damage in Waimakariri DC                                 9
                     Civil Defence and the immediate response             11
Information systems                                                       14
                     Science and engineering                              14
                     The Orbit system                                     16
                     Aerial imagery                                       18
Planning process                                                          21
                     Coordination                                         22
                     Regional strategy                                    24
                     City and District plans                              25
Reconstruction                                                            26
                     Reconstruction of the CBD                            26
                     Blueprint for CBD                                    38
                     Reconstruction of Residential Areas                  40
                     Reconstruction in Waimakariri DC                     46
                     Social and psychological issues                      47
Insurance                                                                 48
                     Earthquake Commission (EQC)                          48
                     Crown offer to red zone residents                    50
Summary and Conclusions                                                   54
                     Building back better                                 54
                     Reconstruction in Christchurch                       54
                     Issues with the existing planning system             55
                     Reconstruction information needs                     57
                     Institutional performance                            58
                     Key lessons from New Zealand for planning recovery   61
References                                                                62

Field Trip to Christchurch, February 2012                                 v
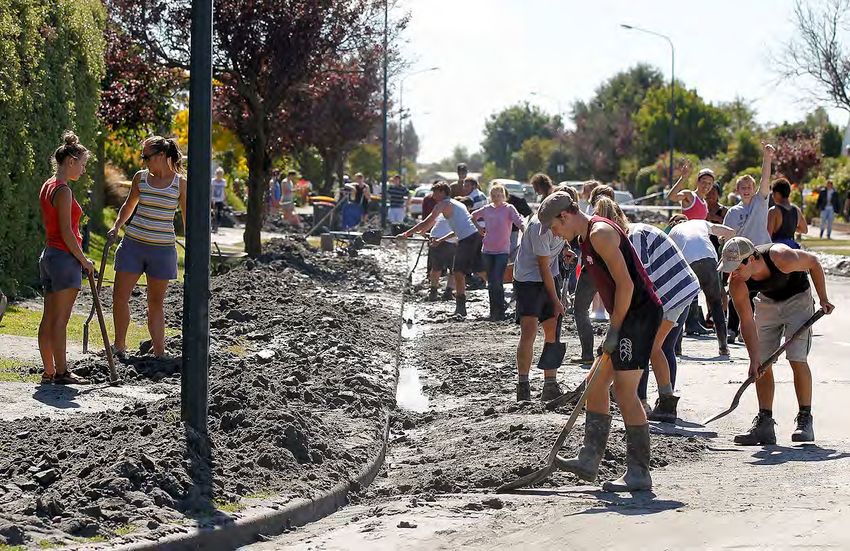
INTRODUCTION
This is a report of a field trip, 14-29 February 2012, to the areas affected by the
Christchurch earthquakes. The trip was part of a University of Cambridge research project
funded by the Engineering and Physical Sciences Research Council (EPSRC) aimed at
operationalising a method we devised of using satellite imagery analysis to track recovery
after major natural disasters.
My personal objective was to find out how post-disaster planning and reconstruction is
being managed and what information is being used by planners and decision-makers.
I interviewed senior people in the various authorities. I spoke to academics, Canterbury
Earthquake Authority managers, city and district planners, architects, engineers, a local MP
and residents and business people. I also surveyed three areas: Christchurch CBD and
Hillsborough and Mount Pleasant, both in the Port Hills, the area closest to the February
shock, and took 1,113 GPS photos of buildings. Finally, I visited researchers and engineers
at GNS Science and the Victoria University in Wellington.
In Avondale, Bexley and New
Brighton I saw areas of
abandonment and was surprised
that most of the businesses,
shops and library in New Brighton
were still in operation. I drove
along most of the roads in
Cashmere, Huntsbury, Mount
Pleasant and Redcliffs, taking
GPS photographs of all the
buildings I could see from the
road for a separate research
study being conducted by CAR. I
observed many examples where
masonry cladding had detached
and collapsed, where tile roofs
had failed and where boundary
walls had collapsed. I also saw
that the majority of houses,
especially those with timber
cladding and sheet roofs, had
escaped with little visible
damage. I also visited Sumner
where some businesses, for
example a wine bar, are back in
operation in temporary
accommodation.
In the parts of the CBD I could
access I saw examples of
damage to heritage masonry
buildings and cleared sites where     Field Trip – areas visited and surveyed
buildings had been demolished. I
visited a couple of the new
shopping malls, the ReSTART
shopping mall and the temporary Royal Court Theatre in Addington and I took various bus
trips from the temporary bus station.
I visited Waimakariri DC staff in Rangiora and walked around the town centre and observed
damage to buildings on the main streets. I also visited the residential areas of Kaiapoi and
saw examples of severe liquefaction, temporary water supply lines that had been laid
above ground and porta-loos on street corners and many abandoned houses.

Field Trip to Christchurch, February 2012                                                1
THE CHRISTCHURCH EARTHQUAKES

                                                                   1
GNS Science map of Christchurch earthquakes to end December 2011

There have been four earthquakes in the Christchurch area in 2010-11, of magnitude 6.0 -
7.1 (see map) and nearly 10,000 aftershocks. The first earthquake, also know as the
Darfield earthquake, of magnitude 7.1Mw, occurred at 4:35am on 4 September 2010, 40km
west of Christchurch at 10km depth. There was some property damage, especially in
Waimakariri, but no loss of life. The second major earthquake, known as the Christchurch
earthquake, of magnitude 6.3Mw, occurred at 12:51pm on Tuesday 22 February 2011
centered 6 miles southeast of Christchurch at a depth of 5km. This was much closer to the
city. There were 185 fatalities and numerous injuries. The third major earthquake, of
magnitude 6.3Mw, occurred at 2:20pm on 13 June 2011, 10km southeast of Christchurch
at 6km depth. There was further property damage and some serious injuries, but no loss of
life. The fourth major earthquake, of magnitude 6.0Mw, occurred on 23 December 2011,
two days before Christmas. There was further property damage, but no serious injuries.
The major difference between the events was the peak ground acceleration: 0.6 in
September, 1.89 in February and 0.3 in June.2

After shock decay sequence for Canterbury

Field Trip to Christchurch, February 2012                                             2
3
Damage from 22 Feb 2011 Christchurch earthquake

Damage in residential areas
The causes of damage to houses according to Graeme Beattie, from BRANZ (Building
Research Association of New Zealand), the organization that did 75,000 door-to-door
house safety assessments in 10 days after the February earthquake, were:
In flat areas: soil liquefaction, lateral spreading or a combination of both plus shaking
In hilly areas: ground shaking, ground distortion and rockfalls or rolling rocks.4
In flat areas, the earthquake of 4 September
2010 caused most damage. The main cause
was liquefaction. With the exception of
chimneys and unrestrained masonry walls,
only minor damage, particularly superficial
cracking to cladding/linings, was caused by
ground shaking. Liquefaction gave rise to both
differential settlement (vertical) effects and
lateral spreading, with the latter being most
damaging. Approximately 160,000 insurance
claims had been submitted to the Earthquake
Commission (EQC) by early December 2010.
Of these, approximately 10% had a land
component.4
The earthquake of 22 February 2011 caused
further liquefaction that affected houses
across a far wider area of Christchurch, as
well as causing extensive rockfall and some
landslides in the Port Hills. By the end of
September 2011, approximately 385,000
insurance claims relating to 120,000
properties had been submitted to the
Earthquake Commission (EQC). Of these,
approximately 17% had experienced land
damage.
                                                      Sand boil where water welled up through sand

Field Trip to Christchurch, February 2012                                                        3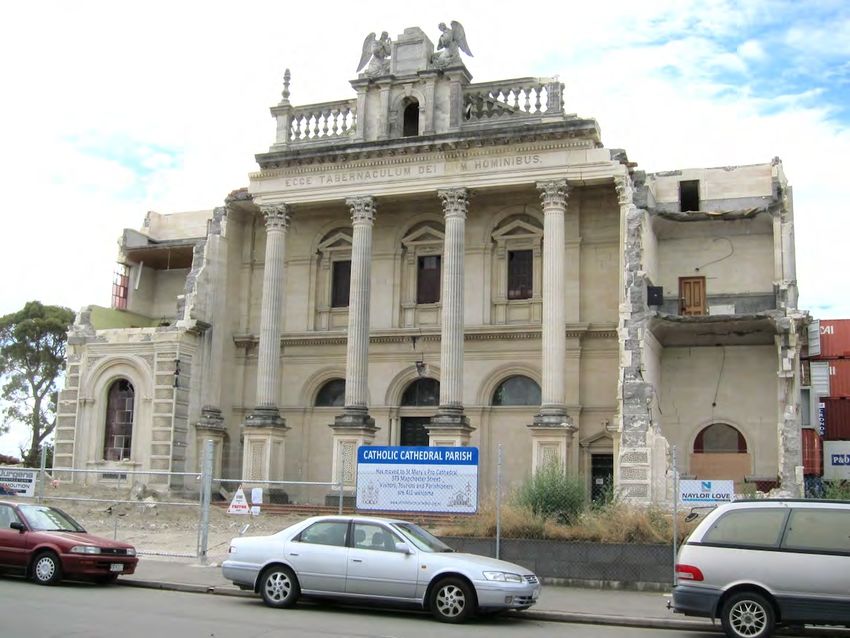
Subsequent major aftershocks caused further damage. Most notably the third major
earthquake on 13 June 2011 shock caused liquefaction in low-lying areas and further
shaking damage to hillside properties. 5

Liquefaction in Christchurch
The widespread liquefaction resulted in an estimated 500,000 tons of silt being ejected.
Lianne Daziel, MP for East Christchurch, said the Boxing Day event was particularly heart
breaking for residents. Andrew King, at GNS Science, explained that as material was
ejected, the ground sank. The water table is now nearer the surface and the crustal
thickness has been reduced and is fissured, so is less able to resist pressure or support the
weight of built structures and material can be ejected more readily in future. This means a
loss of large areas of the city.

Liquefaction after 22 February Earthquake, CERA, Tonkin & Taylor 23 June 2011

The emergency services and utility companies reacted quickly to the 22 February
earthquake. By the evening of the 28 February, 85% of homes had power and 65% had
water. A large number of portaloos were distributed and 5,000 chemical toilets arrived from
overseas within a week. University student volunteers worked on repeated massive
cleanups and City Council workers collected the heaps of grey soil. 6
About 10,000 residents, ie about 3% of the population, went to other towns in New Zealand
and cities further afield. 5,000 residents were housed in Timaru, two hours south of
Christchurch. All Christchurch schools were closed for the rest of the week with 18 of these
having sustained significant damage. Double shift working was introduced with children
attending school in the morning or afternoon. Children were placed in schools near where
they had moved to and for many families the exodus will have been lengthy if not
permanent.7
After the September quake engineers and planners tried to avoid any retreat and there was
an expectation that, despite severe liquefaction, the land would still be available for
development. After the February earthquake there was a rethink and residential areas were
zoned.

Field Trip to Christchurch, February 2012                                                 4
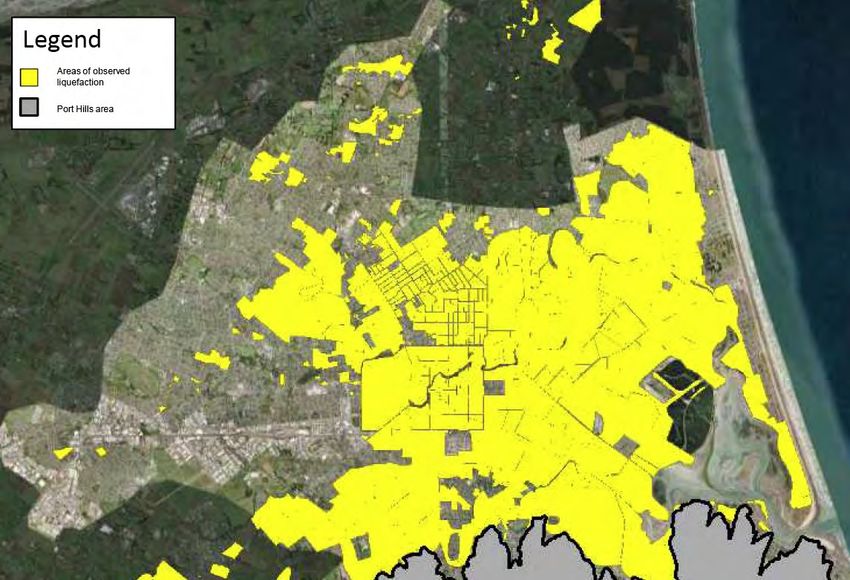
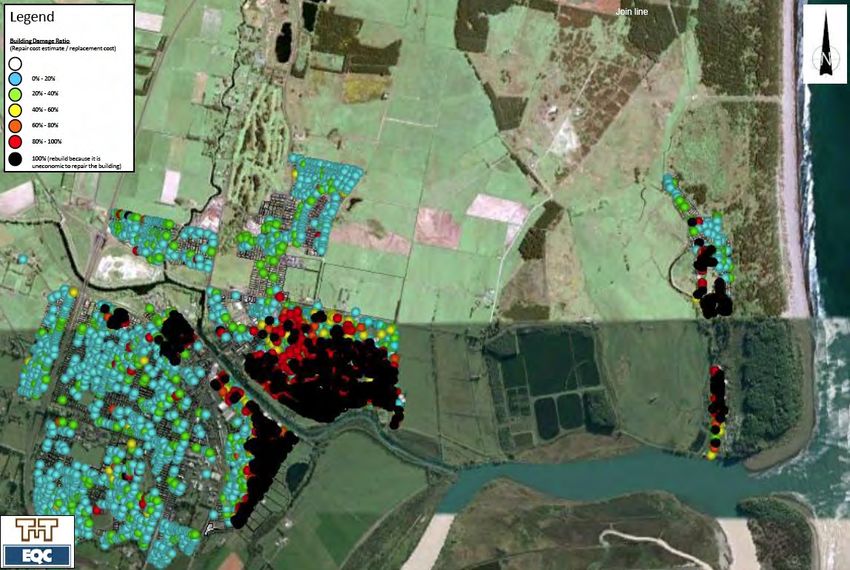
Damage in hilly areas
The Port Hills suffered high ground accelerations. Engineers at Tonkin & Taylor described
how they had known that damage was a product of magnitude, depth and proximity but in
studying damage in the Port Hills they also began to understand local focusing, hanging
wall and within hill effects. One resident I spoke to described the sensation as ʻbeing picked
up and shaken in the jaws of a dogʼ.

Damage from shaking to home in Hillsborough

The following CERA map shows building damage in residential areas as a ratio of repair to
replacement cost. Black denotes buildings where repair is 100% of replacement cost and
the building is uneconomic to repair. Red denotes repair to replacement cost of 80-100%

Port Hills – areas of damage, CERA

Field Trip to Christchurch, February 2012                                                  5
Christchurch Building damage (Black = uneconomic to repair) CERA, 23 June 2011

Damage in CBD
The Central Business District (CBD) was the site of the European settlement in the early
1850s. Before the earthquakes there were more than 3,000 buildings in the CBD,
predominantly commercial and light-industrial (58%) but there were also a significant
number of residential buildings (42%). The majority (81%) were of one to two storeys.
There were 127 buildings of six storeys or more. The tallest building was 22 storeys (86m).
The local state of emergency was lifted two weeks after the September quake.
Christchurch Mayor Bob Parker said that ending the state of emergency represented “a
move closer to business as usual" 8 Damaged buildings were evacuated and barriers
erected but the centre remained open. Lianne Dalziel, MP for East Christchurch, was
critical of the City Council’s management of the September earthquake. I interviewed her in
her constituency office in New Brighton. She said that Environment Canterbury and Selwyn
and Waimakariri DCs had reacted properly, in accordance with Civil Defence and
Emergency Management protocols and had engaged openly with their communities. In
contrast the City Council did not. The Mayor was about to be voted out in the October
elections, she said. He cancelled the election campaign to “focus on my city”. Formerly a
TV presenter, his was a reassuring voice in a time of uncertainty and he was re-elected.
The Council treated the September event as 'business as usual' and kept the centre open.
With hindsight, this sensible policy of getting the economy moving after the disaster may
have been a mistake.
The February earthquake was a game-changer, said Lianne. The government was facing a
general election. A National State of Emergency was declared. No one was in charge and
no plan for the city’s recovery, she said. the Government took control and the City Council
was sidelined. Two weeks later the Government passed emergency legislation, the
Canterbury Earthquake Recovery Act 2011, by order in Council granting extraordinary
powers to the Canterbury Earthquake Recovery Authority (CERA) to coordinate recovery,
to filter information from various task groups, and to make recommendations to
Government. Lianne argues that CERA should have been formed as a Crown Entity, like
the Earthquake Commission, rather than as a Government Department as this would have

Field Trip to Christchurch, February 2012                                                6
provided greater independence, less bureaucracy and lower staff churn. Instead of working
to strengthen the City Council, CERA took over its core recovery functions, she said. The
Government never leveled criticism at the City Council but CERA assumed responsibility
for managing recovery from April.

CBD Red Zone showing the cordoned off area on 27 August 2011. The Restart mall is shown in yellow.
Reconstruction of the CBD is one of the most controversial aspects of the reconstruction in Christchurch.

An internal report blasted the Christchurch City Council's handling of dangerous buildings
after the September 2010 earthquake, and for not declaring a state of emergency after the
December 2011 event, saying it failed to grasp the magnitude of the task.9 However,
Andrew King, from GNS Science, thinks that criticism of the Mayor’s handling of the
September quake is exaggerated given the circumstances that existed at the time and that
a declaration of a state of emergency following the 23 December 2011 event would have
been unhelpful.
When the state of emergency was lifted after the September quake, the Council relied on
an overworked and under-resourced team, called the Building Evaluation Transition (BET)
team, to evaluate dangerous buildings. This resulted in many owners not being told their
buildings were dangerous, and lost files and poor communication within the council led to
"embarrassing" mistakes.10 The Building Evaluation team assessed about half of the
cordoned-off area of the Christchurch CBD. Commercial buildings were given a safety
status of Green, Yellow or Red (Green meaning no restriction on occupancy; Yellow
meaning restricted access and Red meaning no occupation). In all cases owners were
advised to have the building checked by structural engineers.

Field Trip to Christchurch, February 2012                                                               7
The engineering and scientific community has expressed concerns about the confusion
surrounding the meaning of different coloured tags and the failure to communicate the
meaning of the tags to the general public. The prestigious Engineering Advisory Group
report this concern as follows.11 There had already been issues encountered with the
wording of the placards and the understanding of the public, after they were used for the
first time … following the September earthquake. The most critical issues were the
continued use of the term ‘safe’ for green placards, and the lack of urgency over detailed
engineering evaluations, which should have followed the initial placarding. … building
owners and users largely ignored (or at least downplayed) the need to have further detailed
evaluation of their buildings, despite warnings on the placards that such evaluations were
needed. Compounding this, there were no effective guidelines readily available for
engineers to determine an appropriate level of evaluation required.
The February earthquake came as a rude awakening. Buildings collapsed and people were
killed. Many historical buildings and churches were destroyed. Civil Defence reacted swiftly
by defining a large exclusion zone and cordoning off much of the centre, which remains
closed till now. Lianne Dalziel said that people were traumatised by the February
earthquake. For the first time the City Council understood the seriousness of the situation
and began to get a better understanding and control. Tonkin & Taylor were appointed to
conduct damage assessments and they understood and could make sense of what
happened underground and were able to reassure people.

Christ College, Hereford S

Six days after the February earthquake, engineers had done preliminary assessments of
almost all the 3,000 buildings. 755 were red tagged for demolition, 909 were yellow-tagged
with restricted access and 1,276 were green-tagged declaring them safe. But there was still
a lack of clarity about what stickers meant in terms of civil protection.
A major demolition programme was instituted. Half of all buildings in the CBD will disappear
and the centre will be unrecognisable. By March 2012, one year after the earthquake,
slightly over half the buildings (53%) have been given a “green – safe for occupation” tag;
24% are red‐tagged and face demolition and 23% are yellow‐tagged and need further
investigation. CERA estimates that up to 1,300 buildings will be demolished. 12 However, as

Field Trip to Christchurch, February 2012                                                8
there is no legal requirement for more detailed post‐ earthquake seismic assessment it is
not known if this damage assessment is accurate. The Canterbury Earthquake Recovery
Authority (CERA) has issued notice that all commercial buildings are to be subjected to a
detailed engineering evaluation review.13 Andre King says that initially around 500 buildings
will be assessed, but subsequently about 5,000 of the approximately 13,000 commercial
and industrial buildings in Greater Christchurch will be surveyed.
Tall building failure
In the opinion of structural engineers at
Canterbury University and earthquake
engineers at GNS, Wellington, in general
buildings performed better than expected
given the degree of shaking they were
subjected to in the February event. However,
the general public were shocked by the
degree of damage to tall buildings given the
level of earthquake engineering and the
degree of building code compliance in New
Zealand.
The New Zealand Department of Building
and Housing (DBH) initiated a technical
investigation of the structural performance of
the four large multi‐storey buildings in the
Christchurch CBD that failed during the
February earthquake: the Canterbury
Television Building (CTV), the Forsyth Barr
Building, the Hotel Grand Chancellor and the
Pyne Gould Corporation Building (PGC).
Engineering consultants were appointed to
carry out the technical investigation of each
building.14 The failure of these buildings is
the subject of a Royal Commission
investigation set up in April 2011. 15
Collapse of Canterbury Television Building
At the time of my trip it was hoped to reopen
most of the CBD in April 2012, 14 months after the February earthquake. However, as of
11 May 2012 the CERA website announced that– the CBD is still a work in progress, that
CBD red zone cordon fences should not be moved in any circumstances and that CBD red
zone business access can be facilitated by CERA, provided it is safe to do so.16
Damage in Waimakariri DC
The September earthquake hit Kaiapoi particularly badly. Although there was no immediate
collapse in the centre of Kaiapoi, there was severe ground deformation and liquefaction
and catastrophic failure of both old and modern structures in the town centre and major
damage to residential areas. The Kaiapoi River flows through the middle of town and since
Williams Street bridge was badly damaged, immediate access was via the motorway
bridge. The main street was closed and the town centre lost its department store, museum,
council offices and service centre, library, church, cafés and all bars and pubs bar one.
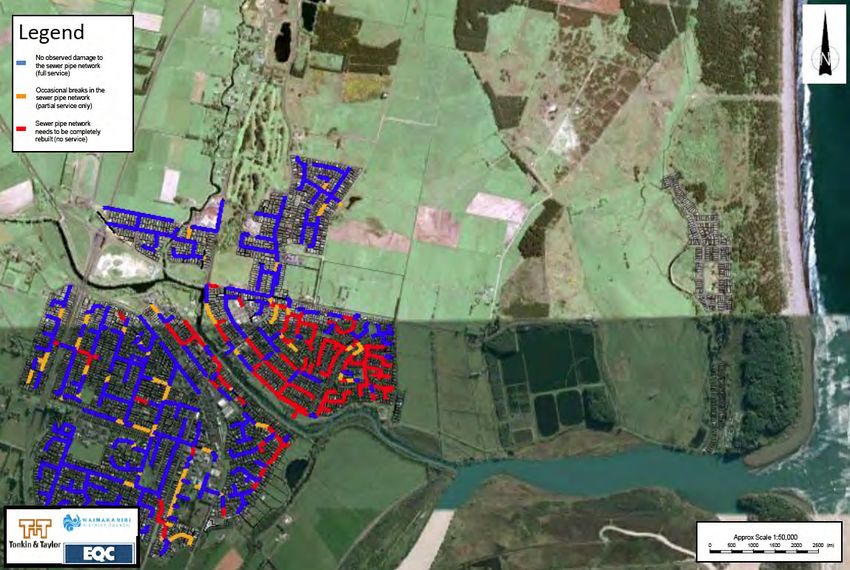
Field Trip to Christchurch, February 2012 9Main Street, Rangiora, Waimakariri DC Town Hall, Rangiora, Waimakariri DC There was extensive lateral spread and liquefaction in residential areas, especially either side of the Kaiapoi River, and severe damage near the coast at Pines Kairaki. It must have been most dispiriting clearing up after repeated after shocks. In the June earthquake, people reported that the moment it stopped shaking, the ground erupted with water and mud. Large areas of housing in Kaiapoi, Pegasus and Rangiora have been zoned red. About a quarter of housing stock will have to be demolished or will need major repairs. Underground power and telephone lines were separated or stretched and had to be re-laid. Storm water drains filled with liquefaction mud and in some cases the flow was reversed. Liquefaction damage in Kaiapoi Liquefaction damage in Kaiapoi On behalf of the Canterbury Earthquake Authority, CERA, Tonkin & Taylor gave presentations at community meetings on 30/31 August 2011 mapping the damage in the Kaiapoi and Pines Beach area. Large areas of Kaiapoi and Pines Beach suffered liquefaction. The aggregated buildings damage map shows the relatively large number of homes that are uneconomic to repair. Black denotes buildings where repair is 100% of replacement cost and the building is therefore uneconomic to repair. Red denotes repair to replacement cost 0f 80-100%. Field Trip to Christchurch, February 2012 10
Liquefaction Kaiapoi and Pines Beach after 4 Sept Earthquake, CERA, Tonkin & Taylor

Aggregate damage map Kaiapoi and Pines Beach Building damage (Black = uneconomic to repair) CERA

Civil Defence and the immediate response
The Civil Defence Emergency Management Act 2002 requires local authorities to
coordinate CDEM through regional groups. 17 The Canterbury Civil Defence Emergency

Field Trip to Christchurch, February 2012                                                   11
Management Group (CDEMG) has representatives from the City Council, Environment
Canterbury and eight district councils. The Minutes of the 13 December Canterbury CDEM
Joint Committee meeting record a timeline for the emergency response. 18
    −    Within one hour of 4 September earthquake, the Group Emergency Coordinating
         Centre (ECC), the Emergency Operations Centre (EOC) in the Canterbury Group
         CDEM area and the National Crisis Management Centre (NCMC) had been activated
         and opened.

    −    Later that morning the mayors of Christchurch City Council, Selwyn District Council and
         Waimakariri District Council each declared a State of Local Emergency for their
         respective areas.

    −    Three Urban Search and Rescue Task Forces (USAR TF) were activated and the 2
         located outside Canterbury were deployed to the region before last light.

    −    On Monday 6 September, Hon Gerry Brownlee was appointed the Minister responsible
         for the Canterbury earthquake. An ad-hoc Cabinet Committee for the earthquake was
         also established and a process to develop legislation to assist in the management of
         aspects response and recovery to the earthquake was initiated.
    −    The first collective Group-level meeting to discuss the Recovery phase of this
         emergency was held on Saturday 11 September. The meeting was chaired by Warwick
         Isaacs and attendees included the Chief Executive Officers of Christchurch City
         Council, Selwyn District Council and Waimakariri District Council, representatives of
         DPMC, MCDEM and Ministry of Economic Development, the Group Controller, the
         Group Recovery Manager and the Regional EMO Manager.

    −    Parliament enacted the Canterbury Earthquake Response and Recovery Act 2010 on
         Tuesday 14 September. This Act established the Canterbury Earthquake Recovery
         Commission that comprises 7 Commissioners (the Mayors of Christchurch City Council,
         Selwyn District Council and Waimakariri District Council plus 4 appointed persons one
         of whom is an Environment Canterbury Commissioner). This Commission was
         disestablished when CERA was formed in April 2011.
An independent review of civil defence was conducted after the September earthquake.
Known as the Westlake report it concluded that “the early response to this event was, by
most accounts, well conducted”, but it also highlighted a number of issues. 19
         Emergencies were declared in three areas to enable statutory powers to be adopted;
         however, it is unclear whether there was a proper understanding of these powers
         among political leaders and some CD personnel, and what organisational hierarchy a
         declaration of emergency imposed.
         The ongoing response to the emergency was good but showed shortcomings. Those
         personnel not usually involved in CD or emergency response were sometimes not well
         informed about the structures and processes. The use of alternatives to the laid down
         communications channels caused confusion and delay.
         Building safety evaluations and the placarding of buildings to indicate if they were safe
         to enter was carried out largely by personnel brought in from outside the region, who
         also organised the process. There is evidence from both this event and the 22 February
         earthquake that the meaning of the placards is not well understood by the public and
         even some agencies, which was not helped by some authorities putting the placards to
         unexpected uses.
In the light of lessons from Christchurch the 2002 Civil Defence Act was amended in March
2012, principally to clarify that that only one state of local emergency can exist in one
location at any one given time.20
Other lessons were learnt. After the September earthquake, at the request of the
Inspections and Enforcement Unit of the Christchurch City Council, a report was prepared
by Sisirc Consulting Limited and McNulty Engineering Management Limited.21 The report
identified a number of issues in dealing with civil defence in the CBD, including the Building

Field Trip to Christchurch, February 2012                                                     12
Evaluation Team’s skill level, information management and the inadequacy of the database of existing buildings, inadequate cordoning of buildings in danger of collapse, poor internal and external communications and confusion over placarding of dangerous buildings. John Hamilton, the Director of Civil Defence Emergency Management, New Zealand, spoke about the Canterbury earthquakes at the National Board meeting of Neighbourhood Support on 8 September, 2011.22 He praised the “personal fortitude” of Cantabrians and the resilience of their communities, but suggested that people weren’t anticipating an earthquake, and may not have been as well prepared as they could have been. One of the outcomes is the New Zealand ShakeOut to raise public awareness of the “drop, cover and hold” earthquake drill planned for 26 September 2012 that aims to involve one million people.23 Japanese rescue workers in front of the CTV building February 24, 2011. (REUTERS / Tim Wimborne) Field Trip to Christchurch, February 2012 13
INFORMATION SYSTEMS

Science and engineering
Tonkin & Taylor (T&T) is an engineering consultancy that provides the Earthquake
Commission with geo-technical information after major events. T&T mobilised engineering
consultants from New Zealand and Australia and at the height of the investigation
employed 200+ engineers in the office and 2,000 in the field. Tonkin & Taylor were seen as
an independent organisation that could manage data while preserving confidentiality. I
interviewed Bruce Deam, an earthquake engineer managing their information system, in
Tonkin & Taylor’s offices in Christchurch. He began by describing the damage assessment
process after the September 2010 quake.
Phase 1 was a foot/cycle drive by to get an immediate impression of the degree of damage
and liquefaction to determine what had happened and the scale of the damage. Phase 2
was a more detailed analysis that thoroughly mapped sand wells and identified individual
‘boils’ and areas of inundation. Aerial imagery was available immediately and used to map
areas of inundation. LIDAR imagery took longer to process and was used to map level
change and to assess the extent of liquefaction. This information was available to Civil
Defence Emergency Management, but it is not clear if anyone knew what to do with the
information.
Phase 2 identified areas that would need significant work to restore the land and areas that
are not worth restoring. Geotechnical investigation, together with conventional boreholes,
involved cone penetration test sampling, that measures tip and shear resistance of the soil,
and piezocone penetrometer testing that in addition measures ground water pressure. A
Stage 1 Report was produced providing suburban-wide reports of site investigations
together with geological cross-sections.
Several options presented themselves in terms of restoration methodologies. It was
decided that significant earthworks were needed to make the land reuseable. Although
EQC is responsible for restoring land, given the scale of the damage, the Government
agreed to meet the cost. T&T and the Engineering Advisory Group, set up to advise on how
to reinstate the land, developed a set of engineering solutions, for example, a cofferdam
solution along riverbanks. Guidelines were published in December 2010.
Phase 3 is the insurance process. The land damage assessment team employed other
engineering firms from New Zealand and Australia to conduct a property-by-property
inspection, initially to get an idea of the extent of the damage and to establish total losses,
and then to deal with individual claims. Claims for non-residential damage is a separate
exercise with insurers handling individual claims.
To make a claim for residential damage the householder needs an accurate survey
assessment to complete the on-line claim form. Given the large number of claims this is a
complex exercise that has to stitch together claims on the EQC and on private insurers. It
became apparent early on that it was necessary to have a single information base that all
insurers could access. All insurers enter data into the same database. They then have
access to their own data and access to summary information from other insurers.
Tonkin & Taylor were contracted by the City Council to produce a land damage report. The
T&T CBD team worked at arms length from the residential team using different personnel
and by November 2011, nine months after the earthquake, they had finished surveying the
city centre.
I interviewed Andy Buchanan, Professor of Engineering at the University of Canterbury and
Andrew King at GNS Science in Wellington. They said that earthquakes have always been
anticipated and designed for, but the level of shaking and degree of liquefaction was way in
excess of design levels.
All commercial buildings are subject to a detailed evaluation. Overall, buildings performed
as designed and protected lives. More thorough investigation is revealing that

Field Trip to Christchurch, February 2012                                                   14
reinforcement only yielded locally in the region of a crack. There is a fear, however, that
further fractures will develop because of strain hardening and there have been recent
building closures because of this concern.
There is a feeling in the engineering profession that some decisions to demolish were over
harsh. But demolition has been driven by the high level of insurance penetration and by a
conservative approach to safety. Engineers were concerned to reduce errors of omission
rather than worry about excessive errors of commission. There is also a culture of blame,
but the event was considerably greater than anticipated. For example, the Pyne Gould
Guinness suffered an unusual mode of failure that has been the subject of an international
conference. Having said that, there appear to have been deficiencies in construction; a
Royal Commission is investigating two major collapses and police may bring charges.
Andrew King at GNS Science questions decisions about the extent of the demolition
programme. He thinks that decisions were made without sufficient survey evidence. Survey
work is difficult. Some buildings were initially declared unsafe, but when engineers did a full
survey they were green tagged. One of the key issues is that few cities have suffered such
a high intensity of after shocks and this has influenced decisions about reinsuring buildings.
Owners have to lodge an application to demolish, but permission seems to be automatic.
As mentioned earlier, it is possible that some buildings were under-insured and are seen as
being too costly to repair. The most profitable option may be to demolish and reinvest the
insurance payout, especially if City Council constrains the number of storeys they can
rebuild. Diane Turner said that there are two types of demolition: the first by CERA and the
second that are decided between the owner and insurer. For CERA mandated demolition
there is a legal framework in the Act and as with all legal powers these have to be
exercised with due diligence, as they are always capable of being challenged in the courts.
There is a low likelihood of Christchurch being hit by another large earthquake in the near
future. There is a perception that the alpine fault may produce damage farther away but
without the big accelerations experienced in the February earthquake. But there are issues
about building taller buildings on deep alluvial 50m thick post-glacial deposits. Christchurch
CBD is not the best place to build a base isolation building. Ground motion particularly
affects water tanks and tall buildings.

Screenshot from RiskScape, natural hazard impact       Christchurch inundation map (NIWA)
and risk-assessment tool, showing the predicted        Seawater inundation based on 2010, 2040 and
location of buildings and different levels of damage   2090 mean high water spring tide exceeded 10%
                      24                                                                    25
in Christchurch City.                                  of time and 100-year ARI storm tide.

Field Trip to Christchurch, February 2012                                                         15
The National Institute of Water and Atmospheric Research (NIWA) and GNS Science are using data on damage and human displacement caused by the Christchurch earthquakes to help validate RiskScape, a natural hazard impact and risk-assessment tool.26 When the details of a real or projected hazard are combined with building, infrastructure, and social information, RiskScape simulates the impact of the disaster on the buildings, and predicts the consequences in both human and economic terms. Impact analysis using Riskscape showed that a sea level rise of +0.4m by 2040 and +0.8m by 2090 on the 100-year average recurrence interval storm tide inundation in the Christchurch estuary area could result in an increase in total buildings flooded of +16% (2040 case) and +31% (2090 case). The corresponding estimated increase in replacement costs at 2010 prices to flooded building contents is estimated at NZ$630M (2040 case) and NZ$1.2B (2090 case). The Orbit system I interviewed Julian Carver, Acting Chief Information Officer at CERA, and he gave me an overview of how the information system is used. New Zealand is highly advanced in IT and in the use of GIS. In 1996, the New Zealand Government noted its increasing reliance on geospatial information for a wide range of activities restructured the Department of Lands and Survey into Land Information New Zealand (LINZ) as a government department responsible for land titles, geodetic and cadastral survey systems, topographic information, hydrographic information, managing Crown property and a variety of other functions. LINZ published the New Zealand Geospatial Strategy in 2006/7 and put together a team to process satellite imagery and to automate data exchange between agencies.27 Yet despite this, Christchurch City Council, Environmental Christchurch and the various District Councils had no experience of exchanging information and there was no comprehensive building database for Christchurch at the time of the disaster. CERA quickly decided that the only effective way to operate was to allow different agencies to use each other’s GIS data. In the first three months after CERA was formed the new IT team worked to set up an information system in form of a Spatial Data Catalogue. In part the structure was based on the Auckland Spatial Plan. This GIS database is used for a variety of planning purposes. One of the main purposes is to manage transactions for red zone property purchases – the Government has made offers to purchase over 7,000 residential properties to date. This is important in terms of the strategy of encouraging people to accept EQC’s Option 1 package since the City does not want to be left servicing small isolated pockets of housing. CERA uses this information to inform decisions about changes in land use and to monitor abandonment and to track where people are moving. Postal redirect and utility meter data is used to infer abandonment. The system also manages the Forward Works Programme, combining data from many sources (EQC property data, building repair data, services and infrastructure repair) to provide a single set of drawings for building repairs, sewage, water, fibre optic cable and roads. This means that reconstruction can proceed in an orderly way and above ground building repairs can be coordinated with below ground works. The GIS also aggregates socio-economic data from education, health, welfare, port manifests, crime statistics etc. Social service data is used to track displacement of activities, for example shopping. Many supermarkets and shops were damaged and are still closed so people have to travel farther to big malls to do their shopping. (This deterioration in neighbourhood facilities is common in most post-disaster situations.28) Setting up the CERA information system has been part of national plans for greater Government transparency. Julian Carver said that the big idea was to develop integrated user-centric service delivery hubs. Rather than each agency having its own IT the idea was to create a single integrated Government information service. There have been problems Field Trip to Christchurch, February 2012 16
overcoming established ways of doing things but they are currently beta testing the system
and plan to deploy this learning in a service transformation programme.
CERA are also moving towards using the GIS information for modelling. The intention is to
begin to use the data to create 3D simulations that can translate proposed plans to inform
decisions, sell investment opportunities and simulate ‘what if’ strategies for the city. CERA
also mentioned that 6,000 boulders had been mapped in the Port Hills area and related to
topography and slope to assess risk; that there is a plan to install sensor networks for a
range of environmental factors in new buildings and that there was real time traffic
monitoring from NZ Transport Agency (NZTA) with 1 in 100 taxis sending in data.

CERA Map of Landslide (yellow) and rockfall (purple

Bruce Deam, at Tonkin & Taylor, manages the information system on behalf of CERA. The
system is called Orbit. Bruce described how the February event changed the game plan.
Residential areas had to be resurveyed and the whole process repeated with a little more
sophistication. The system had to manage this new site investigation information. There
was more information coming in from ground surveys and technical information had to be
collated and made available to the various users – EQC, CERA, CCC and the DCs.
The database helps coordinate the work of people in Civil Defence, Environment
Canterbury and the City and District Councils. However, one of the frustrations for the T&T
team was the high staff turnover and the difficulty of building experience and working
relationships. Bruce Deam also said that there are huge sensibilities in this kind of data
management and the engineering community had had to deal with political pressures.
The system uses a Google Earth front end. Microsoft® Sharepoint is used to manage the
information through a web server with secure file transfer. All site investigations are logged
as part of granting building consent for repair or reconstruction. The database contains
163,000 files and 30GB of data from 9,700 site investigations and 2,700 GIS layers of
information. The system also manages all red one property purchases. There are usage
logins for CERA, EQC, City Council, District Councils and Insurers, with different levels of
access.

Field Trip to Christchurch, February 2012                                                 17
Home page of Orbit system, Tonkin & Taylor

The database met with resistance in some quarters and it conflicted with established IT
policy in some organisations. Some IT departments were under-resourced and had
difficulty coping with the volume of information and demands form user. There were also
issues about installation of the database on work computers. However, people quickly
began to see the value of coordinating information.
The system contains cadastral boundaries and property validation reference data as well
as suburb, ward and territorial authority boundaries. Some of the layers, or GIS maps, I
was shown included: geotechnical maps of observed land damage; liquefaction;
infrastructure damage; flood risk; river cross sections, storm water drainage and land
drainage; maps of bore holes, cone penetration, ground water/piezo tests; intensity and
strong motion recording maps and many other factors.
There is little doubt about the usefulness of the information system but there are issues
about who owns the data and who has access to it. There are concerns in the scientific
community that the database will not be available as an ongoing operational tool.

Aerial imagery
I spoke to Andrew King at GNS Science about the use of imagery. He was a little skeptical
about the usefulness of satellite imagery. He said that imagery was used both for
immediate response and reconstruction. Satellite imagery was available a few days after
the event but there was some delay in processing. The analysis was useful for immediate
post response; the defence force and fire service got the imagery first and GNS was further
down the chain. GNS grabbed whatever was available. There was no systematic
continuous image capture, and GNS had to lodge a request to task a satellite to get the
imagery they needed. They will be working with 8 band data to see if it can identify areas of
liquefaction and automate identification of areas of flood risk. Currently there is no
automatic method and mapping is done manually by visual inspection.

Field Trip to Christchurch, February 2012                                                   18
DAMAGED: Poplar Sreet from the air July 2011        BULLDOZED: The same Poplar St May 2012

The problem is that satellite imagery is not quite good enough to zoom in. It has been a
learning curve to analyse and get information out of the imagery. Aerial imagery has been
better for visual interpretation. Satellite imagery is not good enough to analyse building
damage since you can't see the façade, only the roof and rubble. And satellite imagery
needs clear weather. With aerial imagery you can just send a plane up when it's clear.
There was also an issue about who paid for the imagery after the September event, but this
question was smoothed after the February quake and Emergency Management pays. It
would have been useful to have a single person responsible for an orderly distribution of
imagery. LIDAR was more complicated and arrived later. It was processed in India and had
to be reprocessed. Aerial plots with LIDAR data were provided on a regular basis as
aftershocks hit. It was particularly useful to distinguish damage from different events since it
shows ground deformation, uplift and subsidence, and landslide volume change.
Victoria Caseley at Waimakariri DC said that a lot of GIS mapping was available to the
planners, and LIDAR and aerial photography had been taken 12 months before the
September quake. LIDAR was used to map differentials in how the ground rose or fell in
Waimakariri. The pattern, she said, seemed quite random and could not have been
mapped without LIDAR. The map of changes in ground surface elevation, see below,
between LIDAR surveys of 2003 and March 2011 shows the complexity of these changes.
Magenta and red are areas where the ground sank more than a metre and dark blue where
it rose over a metre.

Field Trip to Christchurch, February 2012                                                  19
Kaiapoi changes in ground surface elevation between LIDAR surveys of 2003 and March 2011, CERA

GIS mapping was also used extensively for planning emergency repairs and for laying
sewer and water pipes above ground. The District Council utilities manager used GIS to
track what was completed and what not and the location of problems. GIS was also used to
track land under development and the speed of development.

Kaiapoi wastewater network damage map, CERA

Field Trip to Christchurch, February 2012                                                        20
PLANNING PROCESS
The process of recovery and reconstruction is immensely complex. A number of authorities
and organisations are involved in different aspects of recovery and there is a range of pre-
existing and special earthquake related plans and programmes. The following table lists the
principal authorities and programmes.

Regular Organisations                                Regular Plans and Programmes

Christchurch City Council (CCC)                      Canterbury Regional Economic Development
Environment Canterbury (Regional Council)            Strategy

Waimakariri DC and Selwyn DC                         Christchurch Economic Development Strategy

UDS Implementation Committee (UDSIC)                 Christchurch City District Plan
(partnership: CCC, Environment Canterbury,           Waimakariri District Plan
Selwyn DC, Waimakariri DC and NZ Transport           Selwyn District Plan
Agency)
                                                     Long Term Plans (each Council is required to
Ministry of Civil Defence and Emergency              prepare 10 year plans)
Management
                                                     Greater Christchurch Urban Development Strategy
Department of Building and Housing (DoBH)            (non statutory strategy agreed with partner
New Zealand Transport Agency                         agencies)
Canterbury Chamber of Commerce                       Canterbury Regional Policy Statement
Christchurch Urban Design Panel                      Regional Land Transport Strategy
GNS Science Crown Research Institute                 East and West Rangiora Structure Plans
Land Information New Zealand (LINZ)                  Master Plans for New Brighton, Edgeware,
National Institute of Water and Atmospheric          Lyttelton, Syddenham etc
Research (NIWA) Crown Research Institute
Building Research Association of New Zealand
(BRANZ)

Earthquake Related Organisations                     Earthquake Plans and Programmes

Ministry of Earthquake Recovery                      Recovery Strategy for Greater Christchurch
Christchurch Earthquake Recovery Authority           (CERA)
(CERA) lead government organisation                      Economic Recovery Plan
   Christchurch Central Development Unit, part of        Land, Building and Infrastructure Recovery
   CERA responsible for rebuilding CBD                   Plan
Canterbury Earthquake Temporary Accommodation            Central City Plan
Service                                                  Local Neighbourhood Plans and Initiatives
Local Authority Planning Group                           Built Heritage Recovery Plan
Earthquake Commission (EQC)                              Education Renewal Recovery Plan
Tonkin & Taylor Consulting Engineers                     Worst Affected Suburbs Programme
Fletcher Construction managing residential rebuild       Building Community Resilience Programme
GNS Science, Wellington earthquake scientists            Sports, Recreation, Arts and Culture
New Zealand Insurance Companies (AMI etc)                Programme
International Insurers and Reinsurers                Environmental Management Programme
Stronger Christchurch Infrastructure Rebuild Team    Waimakariri Green Zone Rebuild Programme
CCC, CERA and NZTA infrastructure repair work        Kaiapoi Town Centre strategy/business support
Canterbury Earthquake Royal Commission               Earthquake Support Subsidy 6 week package
investigating building collapse
Rebuild Christchurch information website
CanCERN Canterbury Communities Earthquake
Recovery Network of residents associations

Field Trip to Christchurch, February 2012                                                             21
Coordination The legislation, the Canterbury Earthquake Recovery Act 2011, setting up the Canterbury Earthquake Authority (CERA) as a Department of Government headed by Minister Gerry Brownlee was passed 18 April 2011.29 CERA was given responsibility for leading and coordinating recovery after the February earthquake. CERA is headed by Roger Sutton, previously CEO at Orion, a NZ electricity distribution company. The legislation requires CERA to work with the four local counci ls: Christchurch City Council, Waimakariri and Selwyn District Council s and Environment Canterbury, the Regional Council, together with Ngai Tahu, the South Island Maori tribe. The coordinating Advisory Group meets every 6 weeks. Draft Recovery Strategy for Greater Christchurch, CERA September 2011 The legislation gave CERA wide-ranging powers to relax, suspend or extend laws and regulations in order to rebuild the city and concerns were expressed at the time and there has been criticism since that local government would be sidelined.30 These tensions have continued. There has been continual friction between the Mayor, Bob Parker, and the Minister, Gerry Brownlee.31 The Minister has made public his frustration at the “ructions and shenanigans” and ongoing turmoil within what he calls the dysfunctional city council. He lambasted the City Council in January 2012 in response to a draft report from the Department of Buildings and Housing that concluded the City Council was not processing building consents quickly enough.32 For his part, the Mayor said in an interview in February 2012 that “state control of rebuild is scary”.33 Diane Turner said that the Minister is responsible for approving the plan for the CBD but that the responsibility for its implementation is yet to be finalised. But on 18 April 2012 the Minister announced that the Christchurch Central Development Unit, (CCDU), part of CERA, would be in charge of the rebuild and would work in a positive partnership with Christchurch City Council, which remains the consenting authority.34 The CCDU is headed by Warwick Isaacs, previously General Manager Operations in charge of demolition at CERA and formerly chief executive at Timaru District Council and Buller District Council. Warwick has posted an interesting drive through the CBD red zone on YouTube.35 Field Trip to Christchurch, February 2012 22
Drive through CBD red zone, 4 November 2011   www.youtube.com/watch?v=f8Lic4MCNek

I interviewed Diane Turner, General Manager, Strategy, Policy and Planning and Julian
Carver, Acting Chief Information Officer in their offices in central Christchurch. She said
that CERA’s Recovery Strategy sets out the long-term vision, objectives and priorities for
the recovery of Greater Christchurch. CERA are developing six recovery plans and four
programmes that coordinate the actions of the appropriate agencies and councils.36
CERA are in charge of CBD demolitions.
The earthquake legislation will have a temporary life and councils will be dealing with the
legacy of disaster and decisions for many years. They need to coordinate land availability,
the reconstruction programme and service provision. CERA has overall responsibility for
five years but there is also an Officer Planning Group and an Urban Development Strategy
Implementation Committee for councillors. These two groups deal with land availability –
what, where and when they think land may be developed; geotechnical guidelines;
rezoning land and sub-dividing sections; information from developers about building
programmes; temporary accommodation availability; strategic planning statements and the
ever changing recovery strategy.
The Urban Development Strategy Implementation Committee (UDSIC) has an independent
chair and includes CERA CEO, Christchurch CC mayor and councillors, three Environment
Canterbury Commissioners, Selwyn DC mayor and councillors, Waimakariri DC mayor and
councillors, two representatives from Te Ru nanga o Nga i Tah, a UDS Implementation
Manager and a committee adviser.37 From late June 2011 planning managers from the
various authorities (CERA, Christchurch CC, Selwyn DC, Environment Canterbury, NZTA,
Urban Development Strategy implementation manager and the infrastructure recovery
manager Kerr and Partners) formed a planning group that meets weekly.
CERA conducted eight community workshops and wider public consultation on the
Recovery Strategy for Greater Christchurch that sought a range of inputs, including online
and written submissions.3839 People were invited to respond to the following questions:
What is your vision for the recovery of greater Christchurch? What are the priorities for
recovery in the next year? Two years? Five years? And how can everyone work together
towards recovery? There were 90 written submissions and 729 online submissions.

Field Trip to Christchurch, February 2012                                               23
You can also read