Carbon Fiber Manufacturing Facility Siting and Policy Considerations: International Comparison - NREL
←
→
Page content transcription
If your browser does not render page correctly, please read the page content below

Carbon Fiber Manufacturing
Facility Siting and Policy
Considerations: International
Comparison
Jeffrey J. Cook and Samuel Booth
National Renewable Energy Laboratory

CEMAC is operated by the Joint Institute for Strategic Energy Analysis for
the U.S. Department of Energy's Clean Energy Manufacturing Initiative.

Technical Report
NREL/TP-6A20-66875
June 2017

Contract No. DE-AC36-08GO28308
Carbon Fiber Manufacturing
                                    Facility Siting and Policy
                                    Considerations: International
                                    Comparison
                                    Jeffrey J. Cook and Samuel Booth
                                    National Renewable Energy Laboratory

                                    Prepared under Task No. AM05.5820

                                   CEMAC is operated by the Joint Institute for Strategic Energy Analysis for the U.S.
                                   Department of Energy's Clean Energy Manufacturing Initiative.

Clean Energy Manufacturing         Technical Report
Analysis Center                    NREL/TP-6A20-66875
15013 Denver West Parkway          June 2017
Golden, CO 80401
303-275-3000
www.manufacturingcleanenergy.org   Contract No. DE-AC36-08GO28308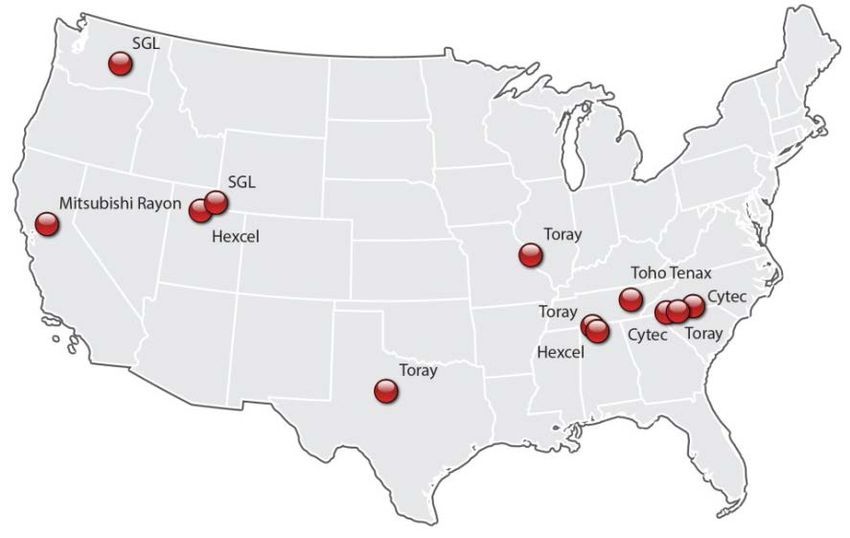
NOTICE

This report was prepared as an account of work sponsored by an agency of the United States
government. Neither the United States government nor any agency thereof, nor any of their employees,
makes any warranty, express or implied, or assumes any legal liability or responsibility for the accuracy,
completeness, or usefulness of any information, apparatus, product, or process disclosed, or represents
that its use would not infringe privately owned rights. Reference herein to any specific commercial
product, process, or service by trade name, trademark, manufacturer, or otherwise does not necessarily
constitute or imply its endorsement, recommendation, or favoring by the United States government or any
agency thereof. The views and opinions of authors expressed herein do not necessarily state or reflect
those of the United States government or any agency thereof.

                             Available electronically at SciTech Connect: http:/www.osti.gov/scitech

                             Available for a processing fee to U.S. Department of Energy
                             and its contractors, in paper, from:

                                       U.S. Department of Energy
                                       Office of Scientific and Technical Information
                                       P.O. Box 62
                                       Oak Ridge, TN 37831-0062
                                       OSTI http://www.osti.gov
                                       Phone: 865.576.8401
                                       Fax: 865.576.5728
                                       Email: reports@osti.gov

                             Available for sale to the public, in paper, from:

                                       U.S. Department of Commerce
                                       National Technical Information Service
                                       5301 Shawnee Road
                                       Alexandria, VA 22312
                                       NTIS http://www.ntis.gov
                                       Phone: 800.553.6847 or 703.605.6000
                                       Fax: 703.605.6900
                                       Email: orders@ntis.gov

Cover Photos: (left to right) iStock 2225189; iStock 16687273; Oak Ridge National Laboratory; iStock 24304597; iStock 26005993;
iStock 2069560

NREL prints on paper that contains recycled content.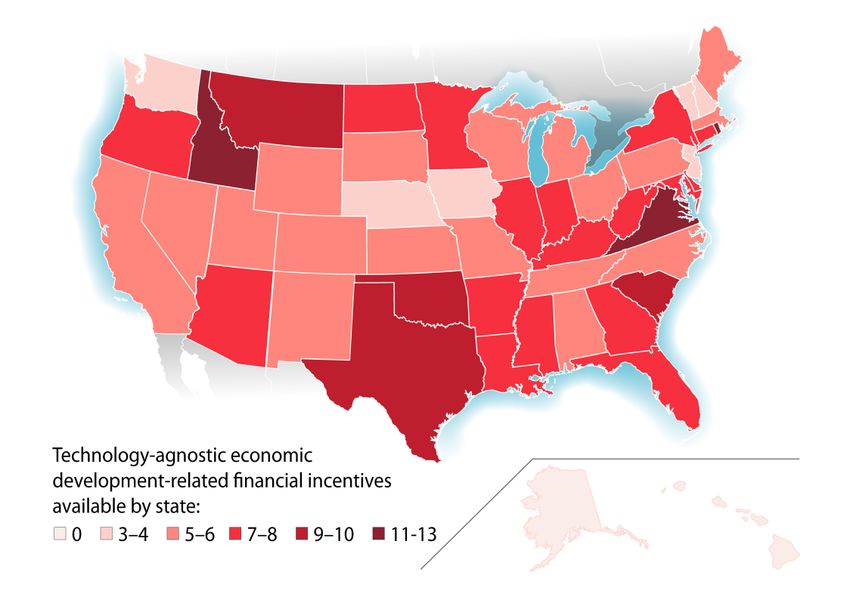
Acknowledgments
   We would like to thank Joe Cresko and Brian Walker from the U.S. Department of Energy’s
   Advanced Manufacturing Office, and Margaret Mann and Jill Engel-Cox from the Clean Energy
   Manufacturing Analysis Center at the National Renewable Energy Laboratory for their support
   and guidance throughout this project. We would also like to thank Joseph Chavez and Ted
   James for their initial work on an internal memorandum that served as the foundation for this
   more comprehensive technical report. Finally, we sincerely appreciate Sujit Das from Oak Ridge
   National Laboratory, John Larkin from Larkin Trade International, and Doug Arent, Francisco
   Floreis-Espino, Jeff Logan, Mike Meshek, Paul Schwabe, and Tian Tian of the National
   Renewable Energy Laboratory for their technical reviews and helpful suggestions.

                                                      iii
This report is available at no cost from the National Renewable Energy Laboratory at www.nrel.gov/publications.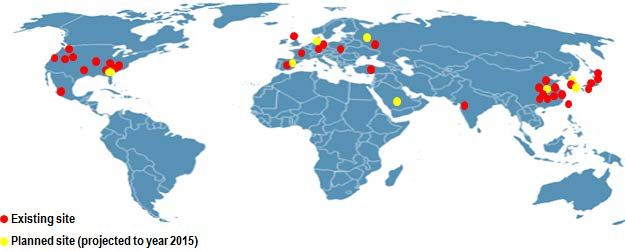
Preface
   Founded in 2015 with support from U.S. Department of Energy’s Clean Energy Manufacturing
   Initiative, the Clean Energy Manufacturing Analysis Center (CEMAC) draws from open-source
   and industry data to deliver insights of supply chains and manufacturing for clean energy
   technologies through uniquely detailed, bottom-up cost analysis. CEMAC provides objective
   analysis and up-to-date information on global clean energy manufacturing to inform choices for
   economic growth and the transition to a clean energy economy.

   This report focuses on national polices to support carbon fiber manufacturing, how these
   policies and other factors influence manufacturing location decisions, and opportunities to
   further support carbon fiber manufacturing and deployment. The report is a follow-on report
   to CEMAC’s initial report on an analysis of the competitiveness of the global carbon fiber
   composites supply chain. That report (Das et al. 2016) provided an analysis of carbon fiber and
   carbon fiber polymer composites supply, demand, markets, and the geographic distribution
   of these in four major market growth areas: aerospace, automotive, wind energy, and
   pressure vessels.

                                                      iv
This report is available at no cost from the National Renewable Energy Laboratory at www.nrel.gov/publications.
Executive Summary
Carbon fiber is a high strength-to-weight ratio material manufactured principally from
acrylonitrile, which is increasingly being used in a variety of applications, including recreational
products, automobiles, aircraft, wind turbines, and gas pressure vessels. Manufacturing costs
can vary between $10 and $25 per kilogram for industrial grades of carbon fiber, and they
largely depend on the type and quality of fiber produced (Das et al. 2016). Cumulative demand
for carbon fiber has been projected to grow 10% per year between 2015 and 2024 (Sloan
2015a; see Figure ES-1).
Global Industrial Carbon Fiber Demand Forecast
Denmand Forecast
50,000
(Metric Tons)
Automotive
40,000
Pressure vessels
30,000
20,000 Wind energy
10,000 Aerospace
0
2015 2020 2024
Year
Figure ES-1. Projected demand for carbon fiber, by selected industrial application (metric tons)
Data are from Sloan 2015a.
This report is a follow-on report to CEMAC’s initial analysis of the competitiveness of the global
carbon fiber composites supply chain. That report (Das et al. 2016) provided an analysis of
carbon fiber and carbon fiber polymer composites supply, demand, markets, and
manufacturing costs. This report focuses on carbon fiber manufacturing siting and policy
considerations. The current global carbon fiber manufacturing industry is predominately
located in the United States, Japan, Europe, and China (Figure ES-2).
Figure ES-2. Location of carbon fiber manufacturing capacity worldwide
Source: Das 2016
Manufacturing facilities for carbon fiber and associated products can offer significant economic
development and employment opportunities. For example, Toray has committed to a $1 billion
v
This report is available at no cost from the National Renewable Energy Laboratory at www.nrel.gov/publications.investment and 500 jobs at a new plant in Moore, South Carolina (Sloan 2015b), and two
other carbon fiber manufacturing facilities in Decatur, Alabama employ 500 people (Alabama
Department of Commerce 2015).
Though the market is expected to expand, it is not clear where new manufacturing facilities will
locate to meet demand. This report examines aspects related to carbon fiber manufacturing in
the top producing countries, including China, France, Germany, Hungary, Japan, Mexico, South
Korea, Taiwan, the United Kingdom, and the United States. And, the report reviews various
metrics of manufacturing location decisions such as costs of labor and energy, as well as policy
directed at supporting carbon fiber development, domestic deployment, and exports. The
report concludes with a discussion of various policy options that may (1) encourage new carbon
fiber manufacturers to locate in certain jurisdictions and (2) foster broader end-use markets
for deployment.
Manufacturing Siting Considerations
The cost of production is a significant factor in facility siting decisions. Locations with lower
costs of production may have an advantage in attracting new manufacturing. A recent CEMAC
report (Das et al. 2016) illustrates the influence of varying carbon fiber and product
manufacturing costs for a variety of supply chain scenarios. That report illustrates that
equipment and material costs are relatively constant across economies, while labor and energy
costs vary significantly. Section 2 of this report provides an international comparison of these
two key manufacturing cost drivers. These are not the only production cost-related
considerations that influence manufacturer siting decisions in the carbon fiber sector. Currency,
environmental and safety, intellectual property, and quality considerations can also impact
siting decisions. These factors cannot be easily converted into a cost/kilogram metric for
comparison with the aforementioned energy and labor costs. Thus, Section 2 also qualitatively
discusses how each location differs across these factors and how they can impact
manufacturers’ siting decisions.
Labor
Labor costs currently represent 12% of overall production expenses (Das et al. 2016) and can
influence carbon fiber manufacturers’ decisions to locate in certain locations. In this context,
hourly labor rates, labor productivity, and automation are most relevant. Ultimately,
manufacturers must weigh the benefits of lower hourly labor rates available in countries such
as China and Mexico against countries with higher labor productivity such as the United States
and Germany that also have higher hourly labor costs (Figures ES-3 and ES-4). At the same time,
automation could displace up to 60% of manufacturing labor (Manyika et al. 2017), which may
reduce overall labor costs. This development could also decrease the importance of this factor
in manufacturers’ siting decisions overall, while incentivizing greater attention to labor
productivity rates for the processes that cannot be automated.
vi
This report is available at no cost from the National Renewable Energy Laboratory at www.nrel.gov/publications.$70 60
GDP per hour worked in
2014 Hourly Rates in USD
$60 50
$50 40
$40
30
2010 USD
$30
$20 20
$10 10
$0 0
Figure ES-3. Comparison of labor productivity Figure ES-4. Comparison of hourly
in GDP per hour worked in 2015 (2010 USD) compensation costs in manufacturing, by
economy in USD in 2014
Source: Organisation for Economic
Co-operation and Development Sources: The Conference Board
2017 2016a, 2016b
Energy
Energy costs are an important consideration for the carbon fiber industry, and this is likely to
continue to be true because of the energy-intensive nature of the carbon fiber manufacturing
process. Several countries, including the United States, offer comparatively low energy costs
that are reflected by low industrial electricity and natural gas costs (Figures ES-5 and ES-6), and
these countries may thus be attractive for future carbon fiber manufacturing facilities.
0.20 $30
2014 Cents/kWh
2014$/MMBTU
$25
0.15
$20
0.10 $15
$10
0.05
$5
0.00 $0
Figure ES-5. Comparison of 2014 average Figure ES-6. Comparison of 2014 industrial
industrial electricity costs, by country (kWh) natural gas prices, by country ($/MMBTU)
Sources: EIA 2016, BNEF 2015, Sources: Enerdata 2014,
DECC 2016 IEA 2016, Russell 2014
vii
This report is available at no cost from the National Renewable Energy Laboratory at www.nrel.gov/publications.Currency
The strength and stability of the local currency can impact manufacturers’ decisions to build
and expand facilities in certain countries. First, manufacturers located in countries with higher
valued currency such as the United States, can be at a production cost disadvantage compared
to facilities operating in countries with lower value currency. This issue has been cited as one
factor behind the stagnation of the United States steel manufacturing industry (Elmquist 2015).
In addition, unexpected volatility in currency values can be problematic for those carbon fiber
manufacturers that export or import to the effect markets. For example, the Euro lost 20% of
its value in comparison to the USD from 2014 – 2015 (IRS 2016). Depending on the currency
used to trade products, carbon fiber manufacturers’ products could be priced out of the
European market as a result. These volatility issues can be mitigated by employing certain
hedging strategies. Though effectively minimizing these risks is possible, properly hedging
against currency volatility can be challenging, particularly when unexpected exchange rate
moves occur, as exemplified by recent volatility in the Euro. As a result, locations with more
stable currencies and large end-use markets, which result in less international trade along the
supply chain, may be preferred, given the lower risk of unpredictable exchange rate volatility.
Environment and Health
Carbon fiber manufacturing is subject to environmental and safety regulations that impact
production processes and costs. For example, each economy has adopted air pollution
standards that carbon fiber manufacturers and all industrial applications must meet (see
Section 2.4). These emission standards are generally similar across locations, which potentially
mitigates the impact of these policies on production costs (see Table 3). However, emerging
policies that address greenhouse gas emissions could have an impact on carbon fiber facilities
because carbon fiber manufacturing emits 24–31 kilograms of carbon dioxide per kilogram of
product (Das 2011). Policies that limit these emissions may affect manufacturers’ decisions to
locate in certain jurisdictions, though decisions relating to energy procurement could mitigate
the potential impact of compliance.
Intellectual Property
The production of carbon fiber is a highly specialized and technical process, and economies with
strong policies for intellectual property rights may offer carbon fiber manufacturers the
assurance that their technology and research and development findings will be protected. The
U.S. Chamber of Commerce ranks locations based on the stringency of their policy in the
International Intellectual Property Index (U.S. Chamber of Commerce 2016). The United States
ranks highest on the index and is followed by many of the European economies, Japan, and
South Korea. Taiwan, Mexico, Russia, China, and Turkey rank significantly lower than the United
States (U.S. Chamber of Commerce 2016).
Quality of Production
Given the specialty nature of carbon fiber manufacturing, existing manufacturers may have an
advantage in terms of product and brand quality considerations when capturing any anticipated
increased demand. These advantages may encourage carbon fiber manufacturers to expand
operations at existing facilities and particularly those in areas with strong intellectual property
viii
This report is available at no cost from the National Renewable Energy Laboratory at www.nrel.gov/publications.right protections. In fact, co-locating carbon fiber manufacturing near customers that
manufacture end-use products may offer other significant benefits in terms of logistics and
quality control cost reductions that could also influence prospective manufacturers’ siting
decisions (Delgado, Porter, and Stern 2014).
Variation in Carbon Fiber-related Policy
In addition to the largely cost-related facility siting factors mentioned above, governmental
policy can influence both (1) the decisions to locate carbon fiber manufacturing facilities and by
extension the capacity located within a given economy and (2) the end-use markets for carbon
fiber in certain key growth industries, such as the wind energy and automotive sectors. Section
3 describes each economy’s policy framework as it relates to carbon fiber. Using the United
States as a reference point, we review the policy landscape of the top-10 carbon fiber
manufacturing economies (in order of manufacturing capacity) in terms of trade, manufacturing
support and development, and end-use market support policies. The intent of this section is to
demonstrate variation in policy that affect carbon fiber manufacturing and deployment in
certain jurisdictions. Section 4 describes potential impacts in more detail.
Trade Policy
There is a significant difference between the United States and its nine international
counterparts when it comes to trade policy. Carbon fiber is considered a dual-use (military and
civilian) product because it could contribute to the military potential or nuclear proliferation of
other nations. Each location has established an export control policy to limit the potential that
carbon fiber would be used in military applications. The United States requires carbon fiber
manufacturers to secure an export license for each individual carbon fiber transaction with a
foreign interest. Each of the other economies allows multiple transactions on the same export
license. Various industry interests have suggested this export licensing process hinders the
United States in the international market by causing delays and inefficiencies in carbon
fiber exports for certain products (Das et al. 2016; U.S. Department of Commerce 2015). In
comparison, most jurisdictions, including the United States impose an import tariff on carbon
fiber products by application. However, the United States has a somewhat higher tariff than
other economies, at least in the context of acrylic precursor. This fact and the tariff schedules
for other carbon fiber inputs and outputs (see Section 3) may influence the cost of carbon fiber-
based products and thereby influence manufacturer’s decisions to locate in certain areas.
Manufacturing Support and Development
Though there is significant variation in the structure, stringency, and content of the policy
employed to promote carbon fiber manufacturing development, a common theme is present
across the locations evaluated. All ten countries analyzed except Mexico currently support
carbon fiber manufacturing via research and development relating to driving down carbon
fiber manufacturing costs and increasing deployment (see Section 3).
Some countries, including China and South Korea have established specific carbon fiber
“valleys” to serve as innovation clusters for carbon fiber research (Jilin Daily 2013; Yang 2013).
The United States has charged the Institute for Advanced Composites Manufacturing
ix
This report is available at no cost from the National Renewable Energy Laboratory at www.nrel.gov/publications.Innovation (IACMI) with a similar research purpose among others (IACMI n.d. A). Though nearly
all of these economies support some research in this space, the United States, Japan, and
Taiwan have the longest histories of investment support. If these and other locations maintain
or build on this research commitment, it may result in more carbon fiber deployment in existing
and new markets.
End-Use Market Support
In terms of existing end-use market support, more variation was observed in the policies evaluated
as they related to the two end-use sectors with significant expected growth through 2024: wind
energy and the automotive industry. Though land-based wind incentives are prevalent, there was
variation in support for offshore wind applications, which more commonly use carbon fiber. The
four European economies (i.e., France, Germany, Hungary, and the United Kingdom), China, and
Taiwan have policies that all directly support the offshore wind energy market and thus drive the
carbon fiber market for wind energy applications. Japan, Mexico, the United States, and South
Korea have not offered similar policy support for offshore wind. If offshore wind deployment were
to expand globally, it could encourage broader deployment of carbon fiber. At the same time,
increased carbon fiber content in land-based wind would also expand the market. In comparison, all
ten jurisdictions have adopted vehicle emission standards that could drive carbon fiber deployment
in vehicles, given its lightweight properties that improve both fuel economy and electric vehicle
drive ranges. Both China and the United States have vehicle emission policies that incentivize
electric vehicles, which could further promote carbon fiber markets. Subsequent policy adoption as
it relates to incentivizing more efficient vehicles would likely further expand carbon fiber
deployment and spur increased carbon fiber manufacturing.
Menu of Policy Options to Support Carbon Fiber
Clearly, many governments have implemented policies to support the carbon fiber industry either
directly (e.g., through research and development programs) or indirectly by enacting market
supporting policies such as vehicle efficiency standards. It is outside the scope of this report to
clarify which policy or set of policies would result in higher carbon fiber manufacturing capacity or
broader end-use markets going forward. Nevertheless, policymakers interested in expanding carbon
fiber manufacturing could benefit from an understanding of the different policy approaches that
have been used to expand carbon fiber manufacturing and end-use markets. To that end, this report
summarizes the range of carbon fiber-related policies that have been used or proposed to achieve
the goals of attracting new manufacturing, expanding manufacturing exports, and driving end-use
markets. Because of data constraints, policy options to attract carbon fiber manufacturing are
United States-centric, but these options with modifications may be applicable in other jurisdictions.
To attract new carbon fiber manufacturing, policymakers could consider establishing carbon fiber-
related workforce development programs similar to those employed for SGL’s Automotive Carbon
Fiber facility in Moses Lake, Washington (Gates 2014), offering economic development incentives
like the package offered to Zoltek for their facility in St. Peters, Missouri (Office of Missouri
Governor Jay Nixon 2012), and fostering the development of manufacturing clusters and co-location
of facilities as exemplified by Toray’s decision to locate plants in South Carolina (GoUpstate 2016).
x
This report is available at no cost from the National Renewable Energy Laboratory at www.nrel.gov/publications.To support carbon fiber manufacturing and development, survey results from experts in the carbon
fiber industry suggest policymakers could evaluate reforming export license requirements to allow
multiple transactions, adjusting tariff schedules for carbon fiber-related materials, or increasing
research and development activities to spur innovation among other options (Das et al. 2016; U.S.
Department of Commerce 2015).
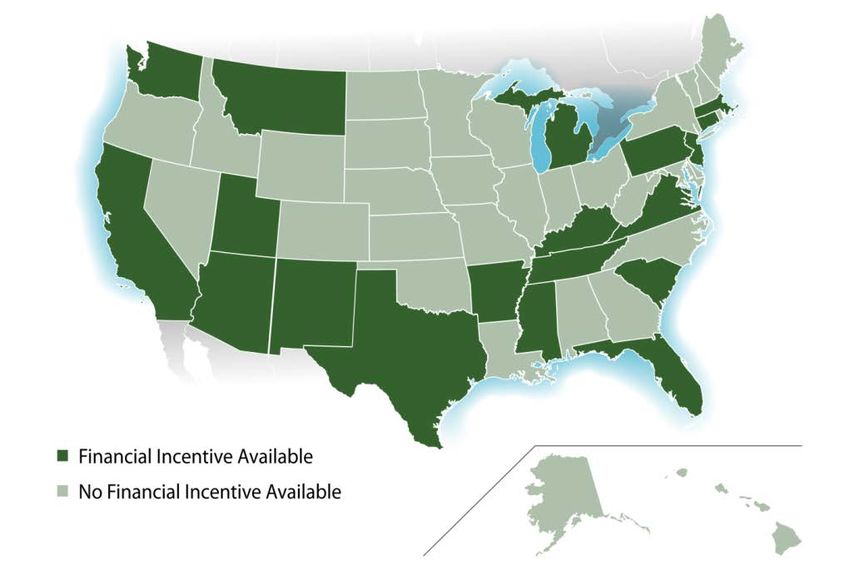
To promote end-use market demand for carbon fiber, policies that support further deployment of
renewable and energy efficiency technologies, particularly in wind and automotive applications
could positively increase manufacturing of carbon fiber. Similarly, increasing vehicle emission
reduction requirements and programs may increase carbon fiber investment and deployment in the
automotive sector.
xi
This report is available at no cost from the National Renewable Energy Laboratory at www.nrel.gov/publications.Table of Contents
1 Overview of Current and Future Markets and Manufacturing ........................................................................ 1
1.1 Current Manufacturing Landscape .................................................................................................................. 4
2 Manufacturing Siting Considerations .............................................................................................................. 7
2.1 Labor Costs ...................................................................................................................................................... 9
2.2 Energy Availability and Pricing ...................................................................................................................... 10
2.3 Currency Rates .............................................................................................................................................. 13
2.4 Environmental and Safety Regulations ......................................................................................................... 14
2.5 Intellectual Property...................................................................................................................................... 16
2.6 Quality Considerations .................................................................................................................................. 17
3 Summary of Policies Relevant to Carbon Fiber .............................................................................................. 18
3.1 United States ................................................................................................................................................. 19
3.1.1 Trade Policy ..................................................................................................................................................... 19
3.1.2 Carbon Fiber Manufacturing Support and Development ................................................................................ 20
3.1.3 End-Use Market Support ................................................................................................................................. 21
3.2 Japan ............................................................................................................................................................. 23
3.2.1 Trade Policy ..................................................................................................................................................... 23
3.2.2 Carbon Fiber Manufacturing Support and Development ................................................................................ 24
3.2.3 End-Use Market Support ................................................................................................................................. 24
3.3 European Union Countries ............................................................................................................................ 25
3.3.1 Trade Policy ..................................................................................................................................................... 25
3.3.2 Carbon Fiber Manufacturing Support and Development ................................................................................ 26
3.3.3 End-Use Market Support ................................................................................................................................. 27
3.4 China.............................................................................................................................................................. 27
3.4.1 Trade Policy ..................................................................................................................................................... 28
3.4.2 Carbon Fiber Manufacturing Product Support and Development .................................................................. 28
3.4.3 End-Use Market Support ................................................................................................................................. 28
3.5 Taiwan ........................................................................................................................................................... 29
3.5.1 Trade Policy ..................................................................................................................................................... 29
3.5.2 Carbon Fiber Manufacturing Support and Development ................................................................................ 30
3.5.3 End-Use Market Support ................................................................................................................................. 30
3.6 Mexico ........................................................................................................................................................... 31
3.6.1 Trade Policy ..................................................................................................................................................... 31
3.6.2 Carbon Fiber Manufacturing Support and Development ................................................................................ 31
3.6.3 End-Use Market Support ................................................................................................................................. 32
3.7 South Korea ................................................................................................................................................... 32
3.7.1 Trade Policy ..................................................................................................................................................... 33
3.7.2 Carbon Fiber Manufacturing Support and Development ................................................................................ 33
3.7.3 End-Use Market Support ................................................................................................................................. 34
4 Menu of Policy Options to Support Carbon Fiber .......................................................................................... 34
4.1 Attracting Carbon Fiber Manufacturing ........................................................................................................ 35
4.1.1 Workforce Development ................................................................................................................................. 35
4.1.2 Financial Incentives ......................................................................................................................................... 36
4.1.3 Co-Location and Clustering ............................................................................................................................. 38
xii
This report is available at no cost from the National Renewable Energy Laboratory at www.nrel.gov/publications.4.2 Reforming Trade Policy ................................................................................................................................. 40
4.2.1 Export Licensing .............................................................................................................................................. 40
4.2.2 Tariff Policies ................................................................................................................................................... 41
4.2.3 Export Import Bank Policy ............................................................................................................................... 41
4.3 Supporting Research and Development ........................................................................................................ 42
4.4 Promoting End-use Market Demand............................................................................................................. 42
4.4.1 Wind Sector ..................................................................................................................................................... 42
4.4.2 Transportation Sector ..................................................................................................................................... 43
5 Conclusions ................................................................................................................................................... 44
6 References .................................................................................................................................................... 45
xiii
This report is available at no cost from the National Renewable Energy Laboratory at www.nrel.gov/publications.List of Figures
Figure ES-1. Projected demand for carbon fiber, by selected industrial application (metric tons) .......................... v
Figure ES-2. Location of carbon fiber manufacturing capacity worldwide .............................................................. v
Figure ES-3. Comparison of labor productivity in GDP per hour worked in 2015 (2010 USD)................................ vii
Figure ES-4. Comparison of hourly compensation costs in manufacturing, by economy in USD in 2014............... vii
Figure ES-5. Comparison of 2014 average industrial electricity costs, by country (kWh) ...................................... vii
Figure ES-6. Comparison of 2014 industrial natural gas prices, by country ($/MMBTU) ....................................... vii
Figure 1. Projected demand for carbon fiber, by selected industrial application .................................................... 2
Figure 2. Location of carbon fiber manufacturing capacity worldwide ................................................................... 4
Figure 3. Geographic distribution of carbon fiber manufacturing facilities worldwide ........................................... 5
Figure 4. Location and owners of carbon fiber manufacturing facilities in the United States ................................. 5
Figure 5. Carbon fiber manufacturing capacity in 2014, by company (metric tons) ................................................ 6
Figure 6. Harper International estimated cost structure for certain carbon fiber manufacturing ........................... 7
Figure 7. Certain 50K tow carbon fiber landed costs by supply chain ($/kg)........................................................... 8
Figure 8. Comparison of hourly compensation costs in manufacturing, by economy in 2014 (USD) ....................... 9
Figure 9. Comparison of labor productivity in GDP per hour worked in 2015 (2010 USD) .................................... 10
Figure 10. Energy cost comparison for the use of all-electric ovens and furnaces versus gas ovens and electric
furnaces, by select country or region ............................................................................................................ 11
Figure 11. Comparison of 2014 average industry electricity costs, by country ..................................................... 11
Figure 12. Comparison of 2014 bulk industrial natural gas prices, by country ($/MMBTU) .................................. 12
Figure 13. Year-over-year currency value variation compared to the U.S. dollar ................................................. 13
Figure 14. Number of economic development incentives available to manufacturers in each state .................... 37
Figure 15. States with at least one financial incentive directed toward clean energy-related manufacturing ...... 38
List of Tables
Table 1. Global Carbon Fiber Demand Forecast (Metric Tons) ................................................................. 2
Table 2. Sensitivity Analysis of 50K Tow CF Landed Costs for Scenario UUU ................................................ 8
Table 3. Comparison of Certain Pollution Standards by Economy ........................................................... 15
xiv
This report is available at no cost from the National Renewable Energy Laboratory at www.nrel.gov/publications.1 Overview of Current and Future Markets
and Manufacturing
Carbon fiber consists of materials with over 92% carbon content, and it can be manufactured
from a variety of materials, most commonly acrylonitrile. Acrylonitrile is derived from oil,
polymerized into polyacrylonitrile, spun into precursor, and then stabilized and carbonized to
produce fiber.1 Each carbon fiber filament has a diameter between 5 and 15 microns, and
typically thousands of carbon fibers are bundled together into what is termed carbon fiber tow
(Das et al. 2016). This carbon fiber material is used in a variety of applications, and it is valued
for its combination of strength, stiffness, and light weight. Carbon fiber materials can be up to
10 and 8 times stronger than steel and aluminum, but are 5 times and 1.5 times lighter
respectively (Feraboli and Masini 2004; Zoltek Corporation n.d.). Carbon fiber also offers
superior resistance to fatigue and corrosion, as well as high heat resistance (Matsui 1990;
Altair 2016).
These unique properties along with reductions in the cost of carbon fiber production
technology, and specific market drivers, including aerospace and defense applications
(Altair 2016), have resulted in rapid growth in carbon fiber manufacturing and use since the
technology was introduced in the 1960s (ACS 2003). Aggregate global demand for carbon fiber
grew from approximately 2 metric tons in 1971 (Matsui 1990) to approximately 83,000 metric
tons in 2015 (Sloan 2015a).
Public-sector procurement of carbon fiber materials for defense applications initially drove the
market. More recently, recreational and industrial applications have led to large-scale industry
development in the United States and globally. Currently, the majority of the carbon fiber
market is associated with three broad end-use categories:
1. Consumer and recreational products—such as bicycles, golf equipment, racquets, and
marine applications
2. Aerospace applications—such as commercial and defense aircraft
3. Industrial applications—such as wind turbine blades, automotive, and pressure vessels.
These end-use markets are expected to increase carbon fiber demand to 157,000 metric tons
by 2020 and to 219,000 metric tons by 2024 (Table 1). This growth reflects a compound annual
average growth rate (CAGR) of 10.2%. Much of the projected expansion is associated with
industrial applications, which represent 82% of projected demand by 2024 (Sloan 2015a).
1
For a full explanation of the life cycle of the carbon fiber manufacturing process, see Das et al. (2016).
1
This report is available at no cost from the National Renewable Energy Laboratory at www.nrel.gov/publications.a
Table 1. Global Carbon Fiber Demand Forecast (Metric Tons)
Market 2015 2020 2024 CAGR
Consumer/recreational 14,830 16,740 18,620 2.30%
Aerospace 15,460 22,100 21,650 3.40%
Industrial 52,800 118,490 178,920 13%
Total 83,090 157,320 219,200 10.20%
a
Data are from Sloan 2015a.
In 2015, wind energy applications competed with aerospace applications as the largest market
for carbon fiber (Figure 1). Carbon fiber expansion in the wind energy sector has been driven in
part by innovation in the industry requiring longer wind blades. Carbon fiber’s high strength-to-
weight ratio is ideally suited for advanced longer wind blades and especially those for offshore
applications (Stephenson 2012; Das et al. 2016). It is expected that by 2020 the automotive
industry will begin to compete with the aerospace industry as the second-largest market for
carbon fiber. And, the automotive and pressure vessel categories are expected to lead the
market by 2024 (Figure 1). 2
Global Industrial Carbon Fiber Demand Forecast
Denmand Forecast (Metric Tons)
50,000
40,000
30,000 Automotive
20,000 Pressure vessels
Wind energy
10,000
Aerospace
0
2015 2020 2024
Year
Figure 1. Projected demand for carbon fiber, by selected industrial application
Data are from Sloan 2015a.
2
Pressure vessels refer to containers designed to hold fluids at pressures higher than ambient atmospheric pressure,
such as self-contained breathing apparatus applications, stationary natural gas and hydrogen storage, along with certain
vehicle applications (Das et al. 2016).
2
This report is available at no cost from the National Renewable Energy Laboratory at www.nrel.gov/publications.To date, the wind energy and aerospace sectors have offered the highest estimated revenue
per kilogram produced at $317/kilogram and $98/kilogram respectively (Witten, Kraus, and
Kühnel 2015). The automotive sector trails both at $87/kilogram (Witten, Kraus, and Kühnel
2015). Though expected demand for the aerospace and wind sectors may slow going forward,
both sectors are likely to continue to be an important revenue generator for the industry.
Overall, global nameplate carbon fiber manufacturing capacity in 2015 was estimated at
144,000 metric tons with an actual output of 93,000 tons (Sloan 2015a). The difference in
capacity and output can be explained in part by limitations on capacity plant efficiency caused
by form and line changes, along with quality control that spurs necessary manufacturing
downtimes. Nevertheless, there may be some underutilized manufacturing capacity in the
market that could help meet projected future demand. However, some expect that carbon fiber
demand will exceed 157,000 tons by 2020 and new manufacturing capacity would be necessary
to meet this demand (Sloan 2015a). To be clear, there is some debate regarding the expected
increase in carbon fiber demand; the Sloan (2015a) estimate is the most recent.3
If the Sloan (2015a) estimate is accurate, at least an additional 13,000 metric tons of
manufacturing capacity expansion from the 2015 baseline would be required to meet demand.
Such a capacity expansion represents a large financial investment and a significant amount of
new manufacturing jobs. To that end, Toray is investing approximately $1 billion to build a new
facility in South Carolina that would create 500 new jobs and produce 2,000 metric tons per
year of carbon fiber along with precursor and prepreg (Sloan 2015b; GoUpstate 2016). 4 The
scope of this project is atypical of the industry. For comparison, two carbon fiber manufacturing
facilities in Decatur, Alabama, currently employ a total of 500 people (Alabama Department of
Commerce 2015). 5 Nevertheless, Toray’s investment is one example of both (1) a broader trend
of overall job growth reflected in the carbon fiber industry as the industry added jobs at twice
the rate of other forms of employment in 2013 (U.S. Department of Commerce 2015) and
(2) the potential scale of the economic development opportunity that a new carbon fiber
manufacturing facility and its associate businesses may provide.
For new carbon fiber manufacturing capacity to meet increased demand by 2020, facilities must
start coming online in the short term (two or three years). This lead time is necessary to allow
time for site development, construction, and equipment procurement. Thus, this is an
appropriate time to examine the leading carbon fiber manufacturing countries in relation to key
manufacturing siting considerations, policy landscapes, and the role they may play in
broadening markets for carbon fiber producers.
3
For other estimates, see Das et al. (2016), Lucintel (2012), Red and Zimm (2012), and Industry Experts (2013).
4
Prepreg is carbon fiber fabric that already includes resin (Das et al. 2016).
5
Hexcel owns one of these facilities, and it recently added 20 new jobs that would pay an average annual salary of
$49,000 (Fleischauer 2015).
3
This report is available at no cost from the National Renewable Energy Laboratory at www.nrel.gov/publications.1.1 Current Manufacturing Landscape
In 2015, ten jurisdictions accounted for 93% of the carbon fiber manufacturing capacity: China,
France, Germany, Hungary, Japan, Mexico, South Korea, Taiwan, the United Kingdom, and the
United States (Figure 2). The majority of the current facilities are located in the United States,
Japan, Europe, and China.
Figure 2. Location of carbon fiber manufacturing capacity worldwide
Source: Das 2016
Several other countries, including Russia, Saudi Arabia, and Turkey either are emerging or are
small carbon fiber market participants. Turkey-based AKSACA Carbon Fibers is an established
small player in the carbon fiber market (Das et al. 2016). It is actively considering expanding
carbon fiber production in the United States, possibly to serve automobile demand related to
its development agreement with Ford Motor Company (CompositesWorld 2016). And, Russia
and Saudi Arabia are emerging players in the carbon fiber market. The expectation for
increased capacity in Russia is largely in response to higher demand for carbon fiber in the
Russian market (Gitter 2013; Das et al. 2016). While Saudi Arabia-based SABIC has expressed
interest in participating in the carbon fiber market, it has not yet joined it (Das et al. 2016;
Witten, Kraus, and Kühnel 2015; Composites World 2016).
Though demand may be increasing in emerging markets such as Russia, the majority of carbon
fiber demand is expected to remain in Europe, North America, and Asia (Japan and China)
through 2020 (Das et al. 2016). As a result, carbon fiber manufacturers serving these markets
are likely to capture much of the increased demand.
4
This report is available at no cost from the National Renewable Energy Laboratory at www.nrel.gov/publications.Given these demand centers, much of the existing and planned carbon fiber manufacturing
facilities are located in North America, Europe, Japan, and China (Figure 3). Currently, 12 carbon
fiber manufacturing facilities are operating in the United States, and over 7,500 people are
employed by the industry (BLS 2016). 6 Figure 4 displays these facilities along with the owner
of each plant.
Figure 3. Geographic distribution of carbon fiber manufacturing facilities worldwide
Source: Das et al. 2016
Figure 4. Location and owners of carbon fiber manufacturing facilities in the United States
6
There is some diversity in the corporations that manage these plants, and not all are owned by United States-based
companies. For example, Toray, a Japanese company owns four of the 12 facilities.
5
This report is available at no cost from the National Renewable Energy Laboratory at www.nrel.gov/publications.Figure 3 and Figure 4 illustrate that few carbon fiber manufacturing facilities exist globally or
domestically. Also, there are few carbon fiber manufacturing companies globally Figure 5.
Toray leads manufacturers, with 35% of global capacity and the top six manufacturers control
70% of global capacity (Witten, Kraus, and Kühnel 2015).
29.9, 23% Toray
44.5, 35% Toho
SGL
7.2, 6% Mitsubishi
Formosa Plastics
8.8, 7%
Hexcel
11.1, 9% 13.9, 11% Others
12, 9%
Figure 5. Carbon fiber manufacturing capacity in 2014, by company (metric tons)
Data from Witten, Kraus, and Kühnel 2015
There are three major reasons for this market structure. First, significant barriers to entry are
present in the carbon fiber industry and they are related to high intellectual property and
capital costs (Das et al. 2016). Second, carbon fiber is not considered a commodity product
where the output from one manufacturer can be easily replaced with another; rather, carbon
fiber is a specialty product and manufacturers can maintain an advantage in the market by
producing consistent high-quality products by specific market application. Third, the market
structure is driven in part by increasing industry consolidation, such as the acquisition of U.S.-
based Zoltek by Toray in 2014 (Toray 2014).
Nevertheless, where manufacturers choose to site future facilities can have direct economic
impacts in those jurisdictions. With the expected global expansion of carbon fiber demand,
manufacturers will have to decide where to locate new facilities. This report is a follow-on
report to CEMAC’s initial analysis of the competitiveness of varying carbon fiber supply chains.
That report (Das et al. 2016) provided an analysis of carbon fiber, carbon fabric, and carbon
fiber composite manufacturing costs for a variety of applications such as automotive, wind, and
pressure vessels.
The goal of this report is to review the policies and markets of key countries and locations that
manufacture carbon fiber—including China, France, Germany, Hungary, Japan, Mexico, South
Korea, Taiwan, the United Kingdom, and the United States. This report documents how
countries differ in several key considerations for siting carbon fiber manufacturing facilities,
including energy and labor costs, currency rates, and intellectual property rights among others.
Second, the report outlines the current landscape of policy that promotes carbon fiber
6
This report is available at no cost from the National Renewable Energy Laboratory at www.nrel.gov/publications.manufacturing and markets within each of these countries to reveal how policy may play a role
in driving carbon fiber production and deployment such as trade, renewable, and vehicle
emissions policy. Finally, the report documents a series of policy pathways and considerations
that could potentially increase end-use markets and carbon fiber manufacturing going forward.
2 Manufacturing Siting Considerations
Variation in manufacturing costs is a key consideration for prospective developers when citing
new facilities. Carbon fiber manufacturing costs can vary between $10 and 25 per kilogram for
industrial grades, largely depending on the raw materials used and the type of carbon fiber
produced (Das et al. 2016). A range of other cost factors also drive these estimates, as
illustrated in Figure 6.
5% 2%
6%
Precursor
12% Equipment Depreciation
Facility Depreciation
51% Labor
Natural Gas
12% Electricity
Nitrogen
12%
Figure 6. Harper International estimated cost structure for certain carbon fiber manufacturing
Data are from Witting 2015.
Raw material and equipment costs are somewhat constant. However, energy, labor, and other
costs can vary by location. For example, Das et al. (2016) conducted several carbon fiber
manufacturing cost comparisons for certain supply chains relating to vehicle manufacturing. In
this context, they illustrate that based on the supple chain analyzed, the cost of carbon fiber for
the automotive sector ranges from about $15/kilogram to about $17/kilogram (Figure 7).
7
This report is available at no cost from the National Renewable Energy Laboratory at www.nrel.gov/publications.Figure 7. Certain 50K tow carbon fiber landed costs by supply chain ($/kg)
U = United States, G= Germany, J= Japan, and C= China.
The first letter indicates the location of carbon fiber manufacturing, the second letter
corresponds to the location of the bidirectional carbon fabric manufacturing, and the third
letter corresponds to the location of end-use product manufacturing (carbon fiber
reinforced polymer manufacturing).
Figure 7 shows the estimated landed cost of carbon fiber over the life of manufacturing. The
impact of labor and utility costs in this example is clear. Das et al. (2016) also conduct a
sensitivity analysis to describe a manufacturing supply chain solely operated in the United
States that illustrates the influence of certain factors on carbon fiber cost (see Table 2).
Table 2. Sensitivity Analysis of 50K Tow CF Landed Costs for Scenario UUU
8
This report is available at no cost from the National Renewable Energy Laboratory at www.nrel.gov/publications.In addition to energy and labor, a variety of other factors also influence these production costs
and the decision of manufacturers to locate in certain jurisdictions. This report expands on Das
et al. (2016), and we consider other factors more generally, including intellectual property
rights, environmental and safety requirements, and quality considerations. Though these
costs have not been factored into the Das et al. (2016) supply chain analysis, they can influence
carbon fiber manufacturers’ permitting and regulatory costs and their overall decision to locate
in certain jurisdictions.
Given the carbon fiber market is expected to expand and require additional carbon fiber
manufacturing capacity, the goal of this section is to determine how the top-10 carbon fiber
manufacturing locations and to compare across these locations some of the key siting variables,
including labor, energy, intellectual property, quality, currency, and environment and safety
considerations. This research can then highlight historical advantages across the countries and
can offer an outlook for the future.
2.1 Labor Costs
After materials costs, labor compensation is the second-most significant driver of carbon fiber
accounting for 12% of overall production costs (Figure 6 and Figure 7). These costs vary and
may influence a developers’ decision to locate in a given country.
Since 2012, the Conference Board has tracked differences in labor costs globally (The
Conference Board 2016a). Manufacturing labor compensation is typically higher in the United
States than it is in other countries with significant carbon fiber production (Figure 8). 7 This
reality may influence manufacturers’ decisions about whether to locate in the United States.
60
2014 Hourly Rates in USD
50
40
30
20
10
0
Figure 8. Comparison of hourly compensation costs in manufacturing, by economy in 2014 (USD)
Source: The Conference Board 2016a; 2016b
7
Though we include China in Figure 7, these data are from 2013, and The Conference Board (2016b) cautions against
direct comparisons of China and the other countries, given data gaps.
9
This report is available at no cost from the National Renewable Energy Laboratory at www.nrel.gov/publications.However, variation in labor costs can be tempered somewhat by differences in labor
productivity (Sirkin, Zinser, and Rose 2014). Figure 8 shows labor productivity by country in
Gross Domestic Product (GDP) per hour worked. In 2015, the United States offered the highest
labor productivity by this metric, followed by several of the European countries. These
countries typically also have higher hourly labor costs. In comparison, countries such as
Hungary, Mexico, and Russia have lower labor productivity rates as well as lower hourly rates.
Thus, a facility located in a higher labor productivity location may require fewer workers than a
similar facility in a less productive location, which can impact overall labor costs.
$70
GDP per hour worked in 2010 USD
$60
$50
$40
$30
$20
$10
$0
Figure 9. Comparison of labor productivity in GDP per hour worked in 2015 (2010 USD)
Source: Organisation for Economic Co-operation and Development 2017
In addition, the overall impact of labor costs on production may decline as carbon fiber
manufacturing becomes increasingly automated. According to Manyika et al (2017), 60% of
manufacturing processes have the potential to be automated. The carbon fiber industry is
embracing automation opportunities, as exemplified by, SGL Automotive Carbon Fibers facility
in Moses Lake, Washington, that includes a highly automated production line that operates
nonstop 360 days per year (Gates 2014). As automation increases, hourly labor costs may
decline as a driver for making siting decisions, while labor productivity may become more
important. This is because manufacturers may wish to maximize the performance of workers to
generate additional cost savings after automation opportunities are exhausted.
2.2 Energy Availability and Pricing
Energy consumption associated with carbon fiber production is another significant factor in
manufacturing costs, as it accounts for about 11% of the overall cost of production (Witting
2015). In many cases, both electricity and natural gas are used in the manufacturing of carbon
fiber. Ovens and furnaces are the primary consumers of energy in the carbon fiber
manufacturing process. While all-electric ovens can be used, this can significantly increase
manufacturing costs; see Figure 10 for a cost comparison. For this reason, nations or regions
10
This report is available at no cost from the National Renewable Energy Laboratory at www.nrel.gov/publications.with low-cost energy available in the form of either electricity or natural gas may have an
advantage.
$3.00
Energy $/kg Carbon Fiber $2.50
$2.00
All-Electric Ovens and
$1.50 Furnances
Gas Ovens and Electric
$1.00 Furnaces
$0.50
$-
USA Europe Japan China
Figure 10. Energy cost comparison for the use of all-electric ovens and furnaces versus
gas ovens and electric furnaces, by select country or region
Reproduced with data from Witting 2015; kg = kilogram
In terms of electricity costs, recent prices for industrial customers in the United States are
2%–58% lower than they are for other countries surveyed for this report (Figure 11). These low
prices can be advantageous for carbon fiber manufacturers located in the United States by
lowering the cost of production.
0.18
0.16
0.14
2014 Cents/kWh
0.12
0.10
0.08
0.06
0.04
0.02
0.00
Figure 11. Comparison of 2014 average industry electricity costs, by country
The average industry electricity prices for the United States were sourced from the
Energy Information Administration (EIA 2016); all international prices were generated
from Bloomberg New Energy Finance (BNEF 2015) data, except for the prices for
Turkey, which were generated from United Kingdom Department of Energy and Climate
Change (DECC) 2016 data. kWh = kilowatt-hour.
11
This report is available at no cost from the National Renewable Energy Laboratory at www.nrel.gov/publications.You can also read