Carbon Footprint
Climate impact and mitigation potential
of plant nutrition
←
→
Page content transcription
If your browser does not render page correctly, please read the page content below
Carbon Footprint Climate impact and mitigation potential of plant nutrition

Agriculture
and climate change

This brochure aims to explain some of the complex mechanisms defining the climate impact and mitigation potential of modern agriculture.
It also provides insight into recent technological achievements to reduce greenhouse gas (GHG) emissions of fertilizer production and use.

Food security                                              other elements are abundant. If the deficient              climate change and global warming.
                                                           element is supplied, growth will be increased              Are agricultural productivity and sustainability
Since its beginning about 10 000 years ago,
                                                           up to the point where some other element                   compatible? What about GHG emissions from
agricultural development has been closely
                                                           then becomes the limiting factor.                          fertilizer production and application?
linked to the rise of human civilization. During
the past half-century, the "green revolution"              With each harvest, nutrients are exported                  Yara, with its century long knowledge and
allowed a tripling of global food production               from the field with crops, depleting the soil.             experience in production and application of
while world population grew steeply from                   Mineral fertilizers are applied to replace                 plant nutrients, believes that sustainable
3 to 6 billion people.                                     the missing nutrients, ensuring an optimal                 agriculture is part of a solution to climate
                                                           balance for plant growth (Figure 2).                       change. The carbon footprint associated with
With world population expected to grow
                                                           From a climate change perspective nitrogen                 the use of fertilizers for food production can
to some 8.5 billion people by 2030, food
                                                           (N) is the most important nutrient, while                  be decreased by more than 50%. Using Yara’s
production will need to increase again by more
                                                           phosphorus (P) and potassium (K) have minor                proven low-carbon footprint fertilizers and
than 50% [source: ref. 1]. Since land suitable
                                                           impacts.                                                   best practice application tools land can be
for conversion to agriculture is dwindling,
                                                                                                                      saved and yields maintained.
maximizing yield from the existing agricultural
surface is a necessity (Figure 1 and 3).                                                                              The conversion of land to agricultural use
                                                           Climate protection
                                                                                                                      is one of the major global sources of GHG
                                                           Best agricultural practices are a strategic                emissions. Arable land is scarce and it needs
Plant nutrition                                            aspect of securing food supply for a growing               to be used in the most appropriate way in
Since the 19th century, when Justus von Liebig             world population. Today, almost half the                   order to ensure food security.
proposed the “Law of the Minimum”, we have                 people on Earth rely on mineral fertilizers for
known that if one of the nutritive elements                their food. [source: ref. 2]
required by a crop is deficient or lacking,                But agriculture also raises environmental
plant growth will be poor, even when all the               concerns and questions about its impact on

  Arable area                     World population
                                                                                                                                        4
  (in ha per person)                             (in Bn)                                               Export
     0,3                                           8,5          Supply of                              nutrients
                                                                                                                           Billion ha

                                                                nutrients by                           with                                                             Land spared
                                                                fertilization                          harvest                                                           by increase
                                                                                                                                        2                             in productivity
                                                   7,5
    0,25
                                                   6,5                                                                                                    Cultivated land
                                                                                                                                        0
                                                                                 N     P     K                                              1961                             2007
     0,2                                           5,5
                                                                                Primary nutrients                                           3,1 billion      Population     6,6 billion
            1998                         2030

Figure 1: Since available arable area per capita will      Figure 2: Mineral fertilizers replace nutrients exported   Figure 3: Global estimate of land required to produce
decrease, productivity will need to increase.              during harvest to avoid soil depletion. N (Nitrogen), P    sufficient food, if cereal yields had remained at the same
[source: ref. 1]                                           (Phosphorus) and K (Potassium) are taken up in high        level as in 1961. [source: ref. 3]
                                                           quantities by plants during growth.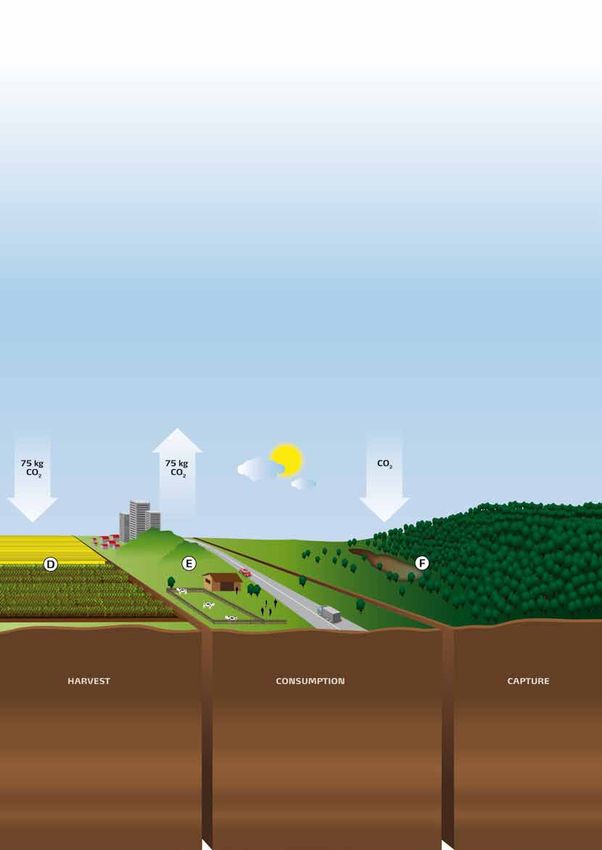
Life cycle perspective
A holistic approach Optimizing fertilizer production
Production, transportation and use of mineral fertilizers contribute Ammonium nitrate (AN) is made up of ammonia and nitric acid.
directly and indirectly to emissions of greenhouse gases, notably carbon Its carbon footprint depends on the energy consumption and the
dioxide (CO2) and nitrous oxide (N2O). At the same time, fertilizers feedstock used in the ammonia production, as well as the N2O
enhance agricultural productivity and stimulate CO2 uptake by the crop. emissions from nitric acid production.
They increase yield and reduce the necessity to cultivate new land, thus EU has defined “best available techniques” (BAT) for these processes.
avoiding GHG emissions from land use change. Using BAT results in a total emission of 3.6 kg CO2-eqv per kg N for
Life-cycle analysis of fertilizers determines GHG emissions and fertilizers that use ammonium nitrate as the nitrogen source, which is
absorptions in fertilizer production, transportation and storage, as well the predominant case in Europe. This is 50% less than the emissions
as during application and crop growth, i.e. throughout every stage of of an average European plant not operating with BAT. Plants outside
the ‘life’ of a fertilizer. This allows a better understanding of what can Europe generally have even higher footprints than average European
and shall be done to improve the overall carbon balance. plants [ source: ref. 4, 5 and 6 ].
On the pages to the right, Figure 4 illustrates the life cycle of Yara’s plants are rated amongst the most energy efficient in the world.
ammonium nitrate (AN), the most common source of nitrogen in Yara has also developed and implemented catalyst technology reducing
European agriculture. It can be found in commercial products such as N2O emissions from nitric acid plants by as much as 90%. As a result,
CAN, NPK, NP, NK etc. The illustration explains the carbon footprint Yara’s fertilizers sold in Nordic countries have a low carbon footprint,
from production, transportation and application, to growing of crops, below the European BAT level, and are fulfilling the emission standard
their consumption as food, feed or bio-energy, and the protection of set by the Swedish food industry for climate branding (3.6 kg CO2 per
natural CO2 sinks such as forests and wetlands. kg N) [ source: ref. 7 ].
To make different GHGs comparable, they are converted into CO2
equivalents (CO2-eqv). For example 1 kg N2O corresponds to 296 kg
CO2-eqv, as it has a 296 times stronger effect on the climate than CO2.
To further ease comparisons, all data are expressed per kg of nitrogen
applied.
Figure 5: Catalyst prills. Catalytic cleansing technology developed by Yara abates about
90% of N2O emissions.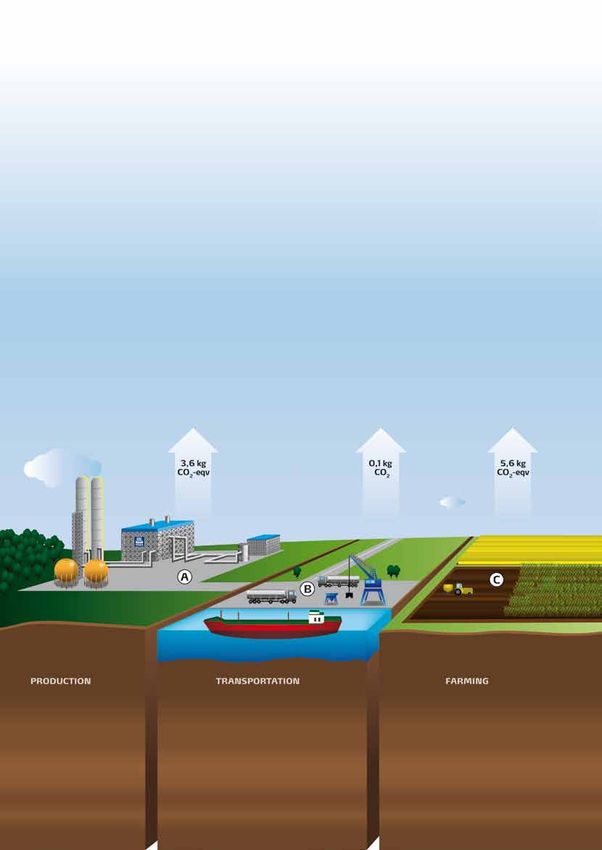
Optimizing fertilizer use
The overall impact and mitigation potential of fertilizer management
with regard to GHG emissions is important (Figure 6). The average                                                    100%

carbon footprint from using AN fertilizer is 5.6 kg CO2-eqv per kg                                                                                                                 Reduction from
                                                                                   kg CO2-eqv / 9,25 t of wheat per ha

applied N [source: ref. 3]. Improved nitrogen management can reduce                                                                                                                fertilizer production:
                                                                                                                                                                                   -35 to -40%
the emissions significantly, depending on soil and weather conditions.
Growers need to ensure that the form and type, as well as amount                                                                                                                   Reduction from
and timing of nitrogen being applied will not result in significant losses                                                                                                         improved N efficiency
                                                                                                                         50%                                                       -10 to -30%
due to denitrification, volatilization or leaching. A good soil structure
further increases N-use efficiency and reduces N2O losses. Optimizing
                                                                                                                                                                                       Fertilizer use
N efficiency does not only reduce climate and other environmental                                                                                                                      Transportation
impact, but it is also a key in maintaining and even increasing                                                                                                                        Solidification
productivity and profitability.                                                                                                                                                        Nitric acid production

Crop nutrition programs developed by Yara help to choose the right                                                                                                                     Ammonia production
                                                                                                                          0

                                                                                                                               European average   Yara with BAT    Yara with BAT
product and apply it in the most efficient way. An array of management                                                           without BAT       technology     technology and
tools such as the N-Sensor™ and the N-Tester™ as well as software                                                                                                  Best Farming
                                                                                                                                                                      Practice
applications such as the Internet based Megalab™ assist farmers in
keeping profitability up and environmental impact down.
In agriculture as in any other domain, less is sometimes more.               Figure 6: Yara has reduced the carbon footprint of nitrate fertilizer production by
A field study conducted on multiple farms in Germany [source: ref. 8]        35 - 40%. Enhancing N efficiency in fertilizer use can contribute by another 10-30%
                                                                             [source: ref. 8, 9].
examined the effect of fertilizer application using the N-Sensor. The
findings demonstrated that use of the N-Sensor increased yields by
6% while reducing N fertilizer use by 12%. This increase in N efficiency       Which fertilizer to use?
reduces the carbon footprint by 10 to 30%.
                                                                               In many regions of the world, urea is used as a source of nitrogen. Under
                                                                               European climate and soil conditions though, ammonium nitrate based
Avoiding land use change                                                       fertilizers (such as AN, CAN, ammonium nitrate based NPKs) have proved to
                                                                               be the most efficient for farmers and more environmentally friendly than urea.
Arable land is a scarce resource that needs to be used in the most
appropriate way in order to ensure food security without further land          Urea has a lower carbon footprint at the production stage of the fertilizer life
use change. Clearing of native vegetation such as rain forest accounts         cycle than ammonium nitrate. This is mainly due to the fact that part of the CO2
for up to 20% of world GHG emissions [source: ref. 10]. Stopping land-         generated in ammonia production is captured in the urea. However, the CO2
use change and deforestation therefore is a primary objective in climate       is released as soon as the urea is spread on the field. In addition, more N2O is
protection.                                                                    emitted from urea by the nitrification process.

The amount of carbon stored in woodland is the highest of all land             Urea also emits more ammonia to the atmosphere during farming than
types. On the other hand, cropland has the lowest carbon content of            AN, increasing the risk of not meeting the national limits on emissions of
all land types, except for deserts and semi-deserts. Intensification           acidifying substances defined by the Gothenburg Protocol. The loss of ammonia
of arable production can save rainforests, grassland savannahs and             from urea also requires higher dosage to compensate for higher losses.
wetlands from being converted into croplands. It therefore has a               In conclusion, the actual life cycle carbon footprint of urea is higher than that
positive effect on carbon balance [source: ref. 11, 12, 13].                   of ammonium nitrate.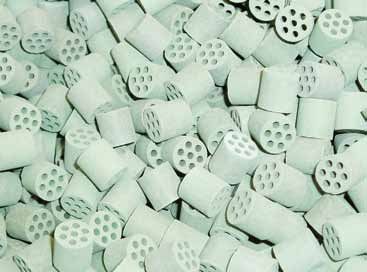
A FErTiLiZEr prodUcTion                                    B TransporTaTion                                      C FErTiLiZEr UsE
 When operating with ‘Best Available Technique’               Ammonium nitrate is transported by ship, barge,     Nitrogen, whether from organic or inorganic
 (BAT) ammonia and nitric acid plants, the total              road or rail.                                       sources, is subject to natural microbial conversion
 carbon footprint of AN is 3.6 kg CO2-eqv per kg N.           • European average: 0.1 kg CO2 per kg N             in the soil. During this process N2O can be lost to
 Ammonia production                                                                                               the air. In addition, CO2 is also released by liming
                                                              MITIGATION POTENTIAL:
                                                                                                                  and farming machinery.
 Binding nitrogen from the air requires energy.               • Optimize logistics chain from production sites
 Natural gas is the most efficient energy source.                                                                 • Average footprint for AN: 5.6 kg CO2-eqv per
                                                                to farmers                                          kg N
 Yara plants are among the best performers in
 terms of energy efficiency worldwide.                                                                            MITIGATION POTENTIAL:
 • European average energy consumption: 35.2 GJ                                                                   • Assure balanced nutrition
   per ton ammonia                                                                                                • Tailor N-application according to actual crop
 • EU BAT energy consumption: 31.8 GJ per ton                                                                       needs
   ammonia (= 2.2 kg CO2 per kg N in AN)                                                                          • Use placement fertilization when appropriate
 Nitric acid production                                                                                           • Just-in-time application to ensure rapid uptake
 Nitric acid is used for making AN-based                                                                          • Use of precision farming tools (N-Sensor,
 fertilizers. Its production releases N2O. Catalytic                                                                N-Tester, online applications)
 cleansing developed by Yara reduces N2O                                                                          • Maintain good soil structure (draining, avoid
 emissions below BAT level.                                                                                         packing)
 • N2O emission without cleansing: 7.5 kg N2O per                                                                 • Select appropriate fertilizer (AN or CAN based
   ton nitric acid                                                                                                  rather than ammonium or urea)
 • EU BAT emission with cleansing: 1.85 kg N2O per                                                                • Efficient manure management
   ton nitric acid (= 1.3 kg CO2-eqv per kg N in AN)
 Solidification
 AN solutions made from ammonia and nitric acid
 are granulated or prilled to form high-quality solid
 fertilizer. Solidification needs energy.
 • European average energy consumption: 0.5 GJ
   per ton of product (= 0.1 kg CO2 per kg N in AN)
 MITIGATION POTENTIAL:
 • Improve the energy efficiency of ammonia
   production and other production systems
 • Install and further optimize catalytic cleansing
   of N2O

 Figure 4: Life cycle analysis of GHG emissions of ammonium nitrate (commercialized as AN, CAN, NP,
 NK, NPK etc.). All figures are expressed in kg CO2 or kg CO2 equivalents (kg CO2-eqv) per kg of nitrogen
 applied. 1 kg of N2O corresponds to 296 kg CO2-eqv [source: ref. 6, 9, 12, 13].
D Biomass prodUcTion E Biomass consUmpTion F ForEsT and wETLands
Plants capture large amounts of CO2 during Most of the biomass produced is consumed Forests and wetlands store 2-8 times more CO2
growth. Optimum fertilization can increase as food or feed. CO2 fixation is therefore only than croplands. Land use change, mainly due to
biomass production, and thus CO2 uptake, by short term and cannot be considered a saving burning of tropical forests, is a large source of
a factor of 4-5 compared to fields that remain on a global scale. The balance is different for CO2 emissions, accounting for 20% of manmade
long-term unfertilized. For example, at a yield of bio-energy since it avoids the burning of fossil CO2 emissions. Preserving tropical and boreal
8 t / ha achieved with 170 kg N / ha, the grain fuels. For example, using biomass instead of forests is the most important contribution to
fixes 12 800 kg / ha of CO2. This corresponds to mineral oil for heating purposes reduces the CO2 mitigate climate change.
75 kg of CO2 fixed per kg of N applied. emission by as much as 70-80%.
MITIGATION POTENTIAL:
• Example footprint: -75 kg CO2-eqv per kg N MITIGATION POTENTIAL: • Protect tropical forests and wetlands
MITIGATION POTENTIAL: • Optimize efficiency of bio-energy production • Reforestation, restoration of wetlands
• Ensure optimal fertilization to increase biomass • Increase productivity in food and feed • Forest fertilization to increase long-term carbon
production and CO2 uptake per ha. production, allowing more acreage for bio capture
• Avoid land-use change at one place to energy production • Avoid further land-use change by increasing
compensate for reduced efficiency at another productivity on existing agricultural land
place
• Preserve and improve soil carbon stocks by
increased inputs of organic material to the
soil (e.g. residues) and conservation tillage
techniques
• Catch and cover vegetation in between actual
crops in order to reduce N leaching losses and
to produce additional CO2-fixing biomass
• Restore degraded agricultural landReducing our footprint Carbon footprint guarantee Yara is committed to provide information on • Yara carbon footprint is verified by an • Yara’s manufacturing sites are certified to its carbon footprint. This enables farmers, independent third party, DNV (Det Norske ISO 9001 (quality management) and ISO retailers and other stakeholders in agriculture Veritas). 14001 (environmental management) by to make decisions according to environmental • Yara has developed and installed catalyst DNV, and are certified by SGS (Société considerations and thus minimize the climate technology for the reduction of GHG Générale de Surveillance) to satisfy the impact of farming. emissions from the production of nitric European fertilizer industry’s Product • Yara guarantees that the carbon footprint for acid (nitrous oxide, N2O). The technology Stewardship Program. fertilizers produced by Yara as of Oct. 1, 2011 qualifies as Best Available Technique, as • Yara shares its knowledge on plant for sale in Denmark, Finland, Norway and defined by the EU Directive on Integrated nutrition and best farming practice with the Sweden is below 3.6 kg CO2-eqv per kg N. Pollution Prevention and Control. agricultural community in order to optimize • Yara’s guarantee satisfies the rules for • Yara promotes its catalyst technology to be fertilizer use and reduce the environmental climate change mitigation in the production used by fertilizer producers worldwide. impacts and carbon footprint of agriculture. and distribution of food in accordance with the Swedish Climate Certification for food. Yara supports application of this initiative internationally.
For further information please contact:
                                                                                                                                          Yara International ASA
                                                                                                                                                  Bygdøy allé 2,
                                                                                                                                            P.O. Box 2464, Solli
                                                                                                                                          N-0202 Oslo, Norway
                                                                                                                                                  www.yara.com

Literature
[ ref. 1 ] Food and Agriculture Organization of the United Nations (2003): World Agriculture towards 2015/2030.
            An FAO Perspective. Ed. Jelle Bruinsma, Earthscan Publications Ltd, London, UK.
[ ref. 2 ] Erisman J.W., M.A. Sutton, J. Galloway, Z. Klimont, W. Winiwarter (2008): How a century of ammonia
            synthesis has changed the world. Nature Geoscience 1: 636-639.
[ ref. 3 ] Fertilizers, Climate Change and Enhancing Agricultural Productivity Sustainably. IFA (2009).
[ ref. 4 ] IPPC Reference Document on Best Available Techniques for the Manufacture of Large Volume Inorganic
            Chemicals - Ammonia, Acids and Fertilizers, EU Commission, August 2007.
[ ref. 5 ] Energy Efficiency and CO2 Benchmarking of European Ammonia Plants - Operating Period 2007-08, Plant
            Surveys International Inc, December 2009.
[ ref. 6 ] Methodology for calculating the carbon footprint of AN-based fertilizers (2010), www.yara.com
[ ref. 7 ] Climate labeling for food (2010), www.klimatmarkningen.se/in-english/
[ ref. 8 ] Agri Con GmbH (2010), www.agricon.de
[ ref. 9 ] Brentrup F., Palliere C. (2010): GHG Emissions and Energy Efficiency in European Nitrogen Fertiliser
            Production and Use. Proceedings of the International Fertiliser Society 639. York, UK.
[ ref. 10 ] IPCC (2007): Climate Change 2007: Synthesis Report. Contribution of Working Groups I, II and III to the
            Fourth Assessment Report of the Intergovernmental Panel on Climate Change [Core Writing Team, Pachauri,
            R.K and Reisinger, A. (eds.)]. IPCC, Geneva, Switzerland.
[ ref. 11 ] Food and Agriculture Organization of the United Nations (2006): Livestock’s long shadow - environmental
            issues and options. FAO, Rome, Italy.
[ ref. 12 ] Bellarby J., Foereid B., Hastings A., Smith P. (2008): Cool Farming: Climate impacts of agriculture and
            mitigation potential. Greenpeace International, Amsterdam, NL.
[ ref. 13 ] Smith, P., D. Martino, Z. Cai, D. Gwary, H. Janzen, P. Kumar, B. McCarl, S. Ogle, F. O’Mara, C. Rice, B. Scholes,
            O. Sirotenko (2007): Agriculture in Climate Change 2007: Mitigation. Contribution of Working Group III to
            the Fourth Assessment Report of the Intergovernmental Panel on Climate Change [B. Metz, O.R. Davidson,
            P.R. Bosch, R. Dave, L.A. Meyer (eds)], Cambridge University Press, Cambridge, United Kingdom and New
            York, NY, USA.

About Yara
Yara delivers solutions for sustainable agriculture and the environment. Our fertilizers and
crop nutrition programs help produce the food required for the growing world population. Our
industrial products and solutions reduce emissions, improve air quality and support safe and
efficient operations. Founded in Norway in 1905, Yara has a worldwide presence with sales to
150 countries. Safety is always our top priority.

          © Yara International 2012
          N-Sensor™, N-Tester™ and Megalab™ are Trade Marks of Yara International ASA
You can also read