Carbon-Negative Policies by Reusing Waste Wood as Material and Energy Resources for Mitigating Greenhouse Gas Emissions in Taiwan - MDPI
←
→
Page content transcription
If your browser does not render page correctly, please read the page content below
atmosphere

Article
Carbon-Negative Policies by Reusing Waste Wood as Material
and Energy Resources for Mitigating Greenhouse Gas
Emissions in Taiwan
Wen-Tien Tsai

                                          Graduate Institute of Bioresources, National Pingtung University of Science and Technology,
                                          Pingtung 912, Taiwan; wttsai@mail.npust.edu.tw; Tel.: +886-8-7703202

                                          Abstract: Carbon-negative policies for mitigating the emissions of greenhouse gas (GHG) from
                                          the energy sector are becoming more urgent and important. Therefore, the environmental policies
                                          and regulatory promotion for reusing waste wood as a carbon-negative resource in Taiwan were
                                          discussed in this work, which focused on mitigating the emissions of GHG from the energy industries
                                          and the manufacturing and construction industries. Considering the official GHG inventory report,
                                          the trend analysis of GHG emissions from the energy and the manufacturing and construction
                                          industries was addressed first. In addition, this study placed emphasis on the environmental policies
                                          and regulatory measures for the material and energy resources from waste wood according to the
                                          promulgation of the relevant acts. It was found that the total GHG emissions from the energy and
                                          the manufacturing and construction industries accounted for over 80% of net GHG emissions in 2018.
                                          In review of the resource recycling and circular economy, lignocellulose-based (or bamboo-based)

                                   char, ecological building material, and wood-to-biofuel pathways (e.g., solid recovered fuel) were
Citation: Tsai, W.-T.
                                          discussed in this work because they have been promoted by the central competent authorities of
Carbon-Negative Policies by Reusing       the Council of Agriculture (COA), the Ministry of Interior (MOI), and the Environmental Protection
Waste Wood as Material and Energy         Administration (EPA), respectively. In order to achieve the sustainable development goals (SDGs) in
Resources for Mitigating Greenhouse       Taiwan, carbon-negative policies for reusing waste wood as material and energy resources will play
Gas Emissions in Taiwan. Atmosphere       an important role in the mitigation of GHG emissions.
2021, 12, 1220. https://doi.org/
10.3390/atmos12091220                     Keywords: carbon-negative; waste wood reuse; greenhouse gas emission; environmental policy;
                                          regulatory measure
Academic Editors: Wan-Yu Liu and
Alvaro Enríquez-de-Salamanca

Received: 9 August 2021
                                          1. Introduction
Accepted: 14 September 2021
Published: 17 September 2021
                                               It is well known that wood and its derived products can be considered carbon-neutral
                                          and carbon-negative materials due to the carbon sequestration process. Approximately
Publisher’s Note: MDPI stays neutral
                                          one metric ton of carbon dioxide is sequestered for each cubic meter of wood via photosyn-
with regard to jurisdictional claims in
                                          thesis. Therefore, wood products can provide some energy and environmental benefits [1],
published maps and institutional affil-   including carbon storage extension, as well as clean fuel and green material use. When
iations.                                  waste wood is generated and burned for energy or heat, the same amount of carbon is
                                          emitted without increasing atmospheric carbon. On the other hand, waste wood can be
                                          transformed into other wood-based materials such as biochar, activated carbon, and parti-
                                          cleboard [2–5], further extending its lifetime in carbon storage. Obviously, wood products
Copyright: © 2021 by the author.
                                          have many environmental advantages over non-wood materials, which are relevant to
Licensee MDPI, Basel, Switzerland.
                                          the mitigation of greenhouse gas (GHG) emissions or climate change [6]. Consequently,
This article is an open access article
                                          several countries, especially in the European Union (EU), have adopted the policies or
distributed under the terms and           directives for promoting electricity or heat from wood-based materials in recent years [7].
conditions of the Creative Commons        A study showed an increase in the consumption of wood fuel, chips, and pellets, as well
Attribution (CC BY) license (https://     as growth in the exports of wood pellets from North America and Russia (mainly for the
creativecommons.org/licenses/by/          European market) and Vietnam (for Korea and Japan) [8]. In addition, the adoption of
4.0/).                                    circular-economy models for the ‘cascading’ use of wood makes it possible to prolong the

Atmosphere 2021, 12, 1220. https://doi.org/10.3390/atmos12091220                                         https://www.mdpi.com/journal/atmosphere
Atmosphere 2021, 12, 1220 2 of 15
storage of carbon in the wood-based products, thus delaying its release in the form of CO2
during its end-of-life energy recovery [9].
According to the World Resources Institute database [10], the energy sector, including
transportation, electricity and heat, buildings, manufacturing and construction, fugitive
emissions, and other fuel combustion [1], is by far the biggest source of anthropogenic GHG
emissions, accounting for about three-quarters worldwide. In terms of the emission sources
in the energy sector, the main contributors of GHG emissions (and their contributions) were
determined in 2018 as follows [10]: heat and electricity (31.9%), transportation (14.2%),
manufacturing and construction (12.6%), residential buildings (11.4%), and commercial
buildings (6.8%). On the other hand, the major GHG emission sources in the non-energy
sector include livestock and manure (5.9%), industrial processes (4.5%), and agricultural
soils (4.2%) [10]. These figures suggest that the mitigation of GHG emissions from the
energy sector should be a primary goal for addressing climate change [11]. In this regard,
environmental policies and regulatory measures will play a crucial role in reducing the
emissions of GHG and air pollutants from the energy sector [12], especially in subsectors
such as heat and electricity, buildings, and agriculture.
Due to the natural forest ban policy in 1990 and the decreased income from domestic
wood production, Taiwan’s wood industry has declined. It was estimated that the percent-
ages of domestic wood production and exported wood products in Taiwan are quite small
(Atmosphere 2021, 12, 1220 3 of 15
carbon-negative measures to mitigate GHG emissions in recent years. More importantly,
reusing waste wood as carbon-negative resources, including wood-to-biochar, wood-to-
building material, and wood-to-energy pathways, has been less discussed in the academic
literature. Therefore, this paper was aimed at addressing the following subjects:
- Trend analysis of GHG emissions from the energy and the manufacturing and con-
struction industries.
- Environmental policies and regulatory measures for reusing waste wood as material
and energy resources.
- Wood-based products for mitigating GHG emissions.
2. Data Mining and Methodology
In this work, the trend analysis of GHG emissions from the subsectors of the energy
(heat and electricity) and the manufacturing and construction industries within the energy
sector was based on the latest National Greenhouse Gas Inventory Report [18], which
was issued by the Environmental Protection Administration (EPA) in Taiwan. In Taiwan,
the report adopted the methodologies in accordance with the “2006 Intergovernmental
Panel on Climate Change Guidelines for National Greenhouse Gas Inventories” proposed
by the Intergovernmental Panel on Climate Change (IPCC) in 2006 [11]. In addition,
the environmental policies and regulatory measures for reusing waste wood as material
and energy resources were compiled from the official databases of the central competent
authorities. Herein, the relevant acts for mitigating GHG emissions, including the Basic
Environment Act, the Greenhouse Gas Reduction and Management Act, the Forestry Act,
the Organic Agriculture Promotion Act, the Renewable Energy Development Act, the
Energy Management Act, and the Building Act, were accessed from the website of the
Ministry of Justice [19]. On the other hand, the important promotion measures, including
renewable energy (e.g., wood fuels as biomass energy), low-carbon products (biochar
products), and green building materials (e.g., wood–based materials), are further discussed
in this study.
3. Results and Discussion
3.1. Trend Analysis of GHG Emissions from the Energy and the Manufacturing and
Construction Industries
In Taiwan, the central competent authority (i.e., EPA) establishes the strategies to
reduce and manage GHG emissions according to the Greenhouse Gas Reduction and
Management Act passed in July 2015. Therefore, the EPA publishes the open-access report
on “Greenhouse Gases Inventory” periodically [18]. Obviously, the energy-related GHG
emissions comprise more than 90% of the total, where carbon dioxide (CO2 ), methane
(CH4 ), and nitrous oxide (N2 O) are responsible for the emissions due to fuel combustion for
electricity and heat generation. Among the subsectors, the energy and the manufacturing
and construction industries are the main emission sources in the energy sector with respect
to the use of waste wood and wood materials as biomass fuels. This section summarizes
the trend analysis of Taiwan’s GHG emissions in the energy and the manufacturing and
construction industries [18].
3.1.1. Analysis of GHG Emissions from the Energy Industries
According to the “Taiwan Greenhouse Gas Inventory Report” [18], total GHG emis-
sions in the energy industries gradually increased from 166,211 × 103 metric tons of CO2e
in 2010 to 189,939 × 103 metric tons of CO2 equivalent (CO2e ) in 2018, as shown in Figure 2
and Tables 1 and 2 [18]. It equivalently accounted for 64.05% of the total GHG emissions
(296,546 × 103 metric tons of CO2e , not including the activities in the land-use, land-use
change, and forestry sectors) in 2018, which was obviously higher than 58.07% in 2010.
An increase of 14.3% in GHG emissions was obtained at an average annual growth rate
of 1.68%. In comparison, CO2 accounted for about 99.3% of GHG emissions from the
energy industries in Taiwan, followed by N2 O and then CH4 . As listed in Table 2, the mostAtmosphere 2021, 12, 1220 4 of 15
important GHG emission source in the energy industries came from electricity and heat
production for the activities of the industrial, service, and residential sectors (Figure 3) [18],
contributing about 90% to the total. In addition, the significant increase between 2015 and
2017 was mainly due to electricity production and petroleum refining expansion, which
were the main sources of GHG emissions and electricity consumption in Taiwan [18]. This
Atmosphere 2021, 12, 1220
trend in GHG emissions was consistent with the average annual economic growth 5rate of 15
during this period of 2010–2018.
Figure2.2.Variations
Figure VariationsininTaiwan’s
Taiwan’sGHG
GHGemissions
emissionsfrom
fromthe
theenergy
energyindustries
industriesduring
duringthe
theperiod
periodofof
2010–2018[18].
2010–2018 [18].
Table
Table 1. Taiwan’s GHG 2. Taiwan’s
emissions fromGHG emissions
the energy from the
industries inenergy industries
terms of in terms
categories of GHGof since
GHG 2010
sources
1 . since 2010 1.
Year
GHG Source Year
GHG Category 2010 2011 2012 2013 2014 2015 2016 2017 2018
2010 2011electricity
Main activity 2012and 2013 2014 2015 2016 2017 2018
150,322 154,552 152,693 151,134 156,577 156,724 160,101 169,289 170,833
Carbon dioxide (CO2 ) 165,522 heat
169,884
production168,333 168,271 175,180 175,198 178,569 187,135 189,212
Methane (CH4 ) 86 Petroleum86 refining 86 7841
85 7171 88 7838 7553 91 8671 928710 8529 94 8314 948862
Manufacture of solid fuels
Nitrous oxide (N2 O) 603 607 603 595 8854 599
8048 585 10,621 595
8491 10,264 621 10,247633
10,437 10,626 10,244
and other energy industries
Total emission 166,211 Total
170,577
emission169,022 166,211168,951 175,867
170,577 175,874
169,022 168,951 179,256
175,867 187,850187,850
175,874 179,256 189,939
189,939
1
1 Source 3
[18];[18];
Source unit: 10310
unit: metric tons
metric based
tons basedon
onCO
CO2 equivalent.
equivalent.
Table 2. Taiwan’s GHG emissions from the energy industries in terms of GHG sources since 2010 1 .
Year
GHG Source
2010 2011 2012 2013 2014 2015 2016 2017 2018
Main activity electricity
150,322 154,552 152,693 151,134 156,577 156,724 160,101 169,289 170,833
and heat production
Petroleum refining 7841 7171 7838 7553 8671 8710 8529 8314 8862
Manufacture of solid fuels
and other energy 8048 8854 8491 10,264 10,621 10,437 10,626 10,247 10,244
industries
Total emission 166,211 170,577 169,022 168,951 175,867 175,874 179,256 187,850 189,939
1 Source [18]; unit: 103 metric tons based on CO2 equivalent.
Figure 3. Pie chart of GHG emissions from the energy industries in terms of GHG sources in 2018
[18].
3.1.2. Analysis of GHG Emissions from the Manufacturing and Construction Industries
According to the report on the “2006 IPCC Guidelines for National Greenhouse Gas
Inventories” [11], the subsector of the manufacturing and construction industries refersMain activity electricity and
150,322 154,552 152,693 151,134 156,577 156,724 160,101 169,289 170,833
heat production
Petroleum refining 7841 7171 7838 7553 8671 8710 8529 8314 8862
Manufacture of solid fuels
8048 8854 8491 10,264 10,621 10,437 10,626 10,247 10,244
Atmosphere 2021, 12, 1220 and other energy industries 5 of 15
Total emission 166,211 170,577 169,022 168,951 175,867 175,874 179,256 187,850 189,939
1 Source [18]; unit: 103 metric tons based on CO2 equivalent.
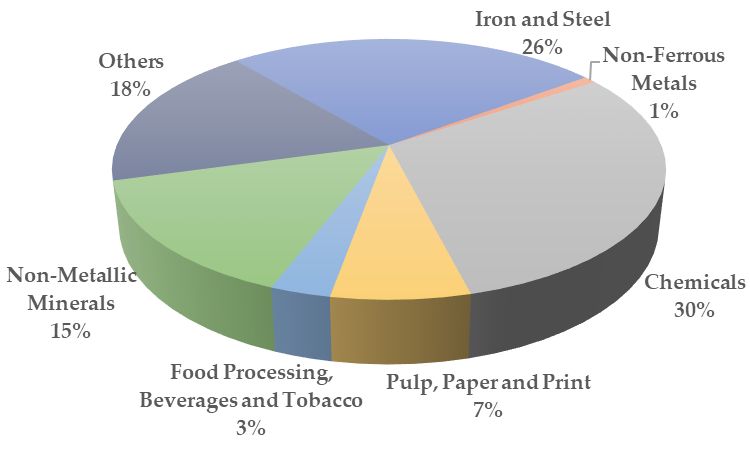
Figure 3.
Figure 3. Pie
Piechart
chartofofGHG
GHG emissions
emissions from
from thethe energy
energy industries
industries in terms
in terms of GHG
of GHG sources
sources in [18].
in 2018 2018
[18].
3.1.2. Analysis of GHG Emissions from the Manufacturing and Construction Industries
3.1.2.According
Analysis oftoGHG Emissions
the report on thefrom
“2006theIPCC
Manufacturing
Guidelines and Construction
for National Industries
Greenhouse Gas
Inventories” [11], the subsector of the manufacturing and construction industries
According to the report on the “2006 IPCC Guidelines for National Greenhouse Gas refers to
the GHG emissions from fossil fuel combustion for the manufacturing and construction
Inventories” [11], the subsector of the manufacturing and construction industries refers
industries
to the GHG such as iron and
emissions fromsteel,
fossilchemicals, minerals,
fuel combustion formachines, and electronics.
the manufacturing Table 3
and construc-
lists
tion Taiwan’s
industriesGHG
suchemissions fromsteel,
as iron and the manufacturing and construction
chemicals, minerals, machines, industries since
and electronics.
2010 [18]. Similarly, CO accounted for about 99.5% of GHG emissions from
Table 3 lists Taiwan’s GHG emissions from the manufacturing and construction indus-
2 the manufac-
turing and construction industries in Taiwan, followed by N2 O and then CH4 . It should
be noted that the GHG emissions from the manufacturing and construction industries
indicated a decreasing trend at an average annual rate of −2.93%, as shown in Figure 4 [18].
This result can be attributed to the industrial structure change and the improvements
in energy efficiency and energy conservation in the manufacturing and construction ac-
tivities during this period. As also listed in Table 4 and depicted in Figure 5 [18], the
main GHG emission sources in the manufacturing and construction industries were the
activities related to chemical, iron and steel, and nonmetallic mineral (i.e., cement and
cement products) manufacturing, contributing about 71–74% to the total. It is noteworthy
that the percentages of GHG emissions from the nonmetallic mineral activities indicated a
significant decrease during this period of 2010–2018, declining by about 31%.
Table 3. Taiwan’s GHG emissions from the manufacturing and construction industries in terms of categories of GHG since 2010 1 .
Year
GHG Category
2010 2011 2012 2013 2014 2015 2016 2017 2018
Carbon dioxide (CO2 ) 41,360 42,298 41,000 42,019 38,953 38,074 38,296 36,741 33,401
Methane (CH4 ) 74 79 76 78 74 74 74 69 59
Nitrous oxide (N2 O) 135 144 137 140 133 131 131 123 103
Total emission 41,569 42,521 41,213 42,237 39,160 38,279 38,501 36,933 33,563
1 Source [18]; unit: 103 metric tons based on CO2 equivalent.GHG Category
2010 2011 2012 2013 2014 2015 2016 2017 2018
Carbon dioxide (CO2) 41,360 42,298 41,000 42,019 38,953 38,074 38,296 36,741 33,401
Methane (CH4) 74 79 76 78 74 74 74 69 59
Atmosphere 2021, 12, 1220
Nitrous oxide (N2O) 135 144 137 140 133 131 131 123 103
6 of 15
Total emission 41,569 42,521 41,213 42,237 39,160 38,279 38,501 36,933 33,563
1 Source [18]; unit: 103 metric tons based on CO2 equivalent.
Figure4.4. Variations
Figure VariationsininTaiwan’s
Taiwan’sGHG
GHG emissions from
emissions thethe
from manufacturing andand
manufacturing construction industries
construction indus-
during the period
tries during of 2010–2018
the period [18]. [18].
of 2010–2018
Tablefrom
Table 4. Taiwan’s GHG emissions 4. Taiwan’s GHG emissions
the manufacturing from the manufacturing
and construction and construction
industries in terms industries
of GHG sources 1.
in terms
since 2010 of
GHG sources since 2010 .1
Year
GHG Source Year
2010 GHG 2011Source 2012 2013 2014 2015 2016 2017 2018
2010 2011 2012 2013 2014 2015 2016 2017 2018
Iron and steel 9546 9452 9472
10,447 8810 8661 8883 8557 8700
Iron and steel 9546 9452 9472 10,447 8810 8661 8883 8557 8700
Non-ferrous metals 296 300 278
Non-ferrous metals 296287 300 294278 276
287 294 259276 219
259 219 290290
Atmosphere 2021, 12, 1220 7 of 15
Chemicals 13,978 13,338
Chemicals 12,035 12,154 12,044
13,978 13,338 12,035 11,990 12,968
12,154 12,044 11,990 12,22712,227
12,968 10,189
10,189
Pulp, paper, and print 2175 2544 2627
Pulp, paper, and print 2175 2530 2544 2397
2627 2097 2397 2044
2530 2097 1951 2285
2044 1951 2285
Food processing,
Food processing,
1062 1057 bever-
1070 1005 1015 993 984 946 997
beverages, and tobacco 1062 1057 1070 1005 1015 993 984 946 997
ages, and tobacco
Nonmetallic minerals 7222 8468 8114
Nonmetallic minerals 72228237 7016
8468 8114 8237 6969
7016 69696428
6428 5922
5922 49934993
Others 7290 7362
Others 7617 72907577 7584 7577 7293
7362 7617 7584 72936933 6933 7111
7111 61096109
Total emission 41,569 Total emission41,213 41,569
42,521 42,521 41,213
42,237 39,16042,237 39,160 38,279
38,279 38,50138,50136,933
36,933 33,563
33,563
1 Source [18]; unit:
1 Source 103 metric
[18]; unit: tons tons
103 metric based on CO
based equivalent.
on 2CO equivalent.
2
Figure 5. Pie
Figure Pie chart
chart of
ofGHG
GHGemissions
emissionsfrom
fromthe manufacturing
the and
manufacturing construction
and industries
construction in terms
industries in terms
of GHG sources in 2018 [18].
of GHG sources in 2018 [18].
3.2. Environmental Policies and Regulatory Measures Relevant to the Material and Energy
Resources from Waste Wood
In review of the carbon-negative benefits of reusing waste wood as material and
energy resources, the central governing authorities in Taiwan jointly promulgated the
environmental policies and regulatory measures under the authorizations of various actsAtmosphere 2021, 12, 1220 7 of 15
3.2. Environmental Policies and Regulatory Measures Relevant to the Material and Energy
Resources from Waste Wood
In review of the carbon-negative benefits of reusing waste wood as material and
energy resources, the central governing authorities in Taiwan jointly promulgated the
environmental policies and regulatory measures under the authorizations of various acts
or laws [19], which are addressed in this section.
3.2.1. Environmental Protection Administration
Basic Environment Act
In Taiwan, the Basic Environment Act is the foundation for all environmental policies.
This law was passed on 11 December 2002, stipulating that economic and technological
development should emphasize environmental protection for the purpose of long-term
national welfare. In addition, any development must be sustainable in terms of future
national security and quality of life. Concerning the reuse (or recycling) of waste, this Act
requires the citizens, enterprises, and government entities at all levels to jointly share the
duties and responsibilities for environmental protection, as described below.
- Government entities (policymakers)
Government entities at all levels should primarily incorporate environmental pro-
tection and sustainable development concepts. They should also develop related science
and technology and establish economically efficient systems for environmental life-cycle
management and green consumption to contend with issues related to the environment.
- Enterprises (manufacturers)
Enterprises should plan for the phasing in of environmental protection concepts
when carrying out their manufacturing activities. According to the product life cycles
and the purpose of achieving sustainable development, enterprises should promote clean
production, prevent and reduce pollution, conserve resources, and recycle and reuse
recycled resources and other raw materials or services that are beneficial to lessen their
environmental impact.
- Citizens (consumers)
Citizens should uphold environmental protection concepts and lessen the environ-
mental impact of daily life. In terms of consumer behaviors, citizens should, as a principle,
practice green consumption. In terms of daily life, citizens should carry out waste reduction,
separation, and reuse (or recycling).
Greenhouse Gas Reduction and Management Act
This Act was passed in July 2015, and it was aimed at mitigating GHG emissions at
all levels of central and local governments by establishing adaptation strategies in Taiwan.
Noticeably, the Act stipulated a mandatory reduction target of 50% below 2005 GHG
emission levels by 2050. In order to achieve the target and the sustainable development
goals announced by the Taiwan government in July 2019 [20], the central competent
authorities are expected to promote the following relevant GHG emission reduction and
climate change adaptation actions:
- Development of renewable energy technology in the use of waste wood as an energy
source.
- Reduction in and management of GHG emissions from buildings in the use of wood-
based building materials.
- Reuse (or recycling) of waste wood as fuels or materials.
- Forest resource management in the forest’s carbon sequestration.Atmosphere 2021, 12, 1220 8 of 15
3.2.2. Ministry of Economic Affairs
Renewable Energy Development Act
In Taiwan, the Renewable Energy Development Act (REDA) is a legal foundation
for promoting renewable energy and its industry development. The Act was recently
revised on 1 May 2019. Among the regulatory measures for the promotion of biomass
energy, the feed-in-tariff (FIT) and installation supports or subsidies may be the most
important incentive in the establishment of a waste-to-power system. In addition, the
central competent authority (i.e., Ministry of Economic Affairs, MOEA) may consider
reasonable costs and profits for the heat utilization of biomass fuel, thus prescribing
the regulations in the form of subsidies and rewards for heat utilization according to
the effectiveness of their energy contribution. In order to produce biomass fuel, reward
expenses for the exploitation of fallow land or idle land to plant energy crops can be
financed by the special agriculture or energy fund. The regulation governing such reward
eligibility, conditions, and subsidy methods, as well as their schedule, is prescribed by the
MOEA in conjunction with the Council of Agriculture (COA).
Energy Management Act
With the aim of promoting the rational and efficient use of energy, the Taiwan gov-
ernment promulgated the Energy Management Act (EMA), which was recently revised in
2016. Thereafter, the goals of the EMA were to meet the national energy security goals and
comply with the GGRMA passed in 2015. The energy user whose steam generation meets
the level stipulated by the MOEA should install cogeneration or combined heat and power
(CHP) systems in connection with the reuse of waste wood as a biomass or auxiliary fuel.
When the CHP system of an energy user meets the levels of effective thermal ratios and
total thermal efficiencies set up by the MOEA, they may ask the local vertical integrated
utilities (e.g., power companies) to purchase excess electricity at rational rates. This Act also
stipulates that the energy conservation standards on the design and construction of new
buildings should be promulgated by the competent authorities of building construction
administration (i.e., Construction and Planning Agency under the Ministry of Interior,
CPA/MOI) in conjunction with the MOEA.
3.2.3. Ministry of Interior
In order to achieve the goals of sustainable, comfortable, and healthy living envi-
ronments, the central competent authority (i.e., MOI) promulgated the building technical
regulations for promoting green buildings (GBs) and green building materials (GBMs)
under the authorization of the Building Act [19]. The central competent authority of
construction and implement (i.e., Architecture and Building Research Institute, ABRI)
under the MOI established and launched the GBM Evaluation and Labeling System in the
early 2000s. According to the definition of GBM by the ABRI, there are four categories of
certified products, consisting of healthy GBMs, high-performance GBMs, recycled GBMs,
and ecological GBMs. Among these categories, the use of wood and waste wood as build-
ing materials can be grouped into ecological GBMs and recycled GBMs, respectively. In
order to further attain the achievable goals, Chapter 17 (“Green Building Guideline”) was
updated in the regulation (“Building Technical Rules-Building Design and Construction
Compilation”) on 18 August 2019. Effective from 1 January 2020, the minimum requirement
for the application ratio of GBMs must be over 60% of total indoor surface area for interior
decoration materials, floor materials, and windows, as well as over 20% of outdoor surface
area for the ground materials.
3.2.4. Council of Agriculture
Forestry Act
The aim of the Act, which was recently revised in May 2021, was to preserve the forest
resources, their natural functions, and their economic viability. The Council of Agriculture
(COA) is the central competent authority of forestry resource management. Under the Act,Atmosphere 2021, 12, 1220 9 of 15
the carbon management with relevance to the wood resource utilization can be further
summarized as follows:
- In order to increase the transfer of carbon from forest biomass to other wood products
such as building materials and/or biomass fuels, harvesting of national forest yields
shall be carried out according to the annual logging plan and national forest yield
management code.
- Forestry enterprises may receive an award if they meet one of the relevant criteria,
including large-scale cultivation of forests as a commodity to supply industry, national
defense, ship building, road engineering, or other important applications, as well
as those who invent or improve tree species, or who undertake bamboo and wood
applications and crafts.
Organic Agriculture Promotion Act
On 30 May 2019, the Taiwan government began to promulgate the Organic Agriculture
Promotion Act. One of the aims in the Act was to promote agricultural operation as a
sustainable and eco-friendly use of resources without using chemical fertilizer, chemical
pesticide, genetically modified organism (GMOs), and related products. In this regard,
biochar is a valuable soil amendment for the benefits of both carbon sequestration and
soil health, leading to its application in a variety of organic farming fields around the
world [21]. The central competent authority (COA) is expected to promote agricultural pro-
duction management systems which use natural resources in order to fulfill the eco-friendly
requirement of organic agriculture. According to the Taiwan sustainable development
goals [20], the organic agriculture promotion goal is set to 30,000 hectares (ha) in 2030,
which is two times that in 2019. Therefore, the use of organic fertilizer in Taiwan has to
increase significantly in the near future.
3.3. Wood-Based Products for Mitigating the GHG Emissions
3.3.1. Wood-to-Biochar
Biochar is a carbonaceous product of biomass pyrolysis, which is operated at 300–
800 ◦ C in the absence or limited supply of oxygen. Therefore, biochar is derived from wood,
bamboo, and other lignocellulosic materials. More significantly, biochar is considered an
environment-friendly material because it can solidify the carbon from the biomass, thus
delaying its release back to the atmosphere and making soils more fertile through the use of
biochar as an organic fertilizer. In addition, biochar can be reused as a solid biofuel as it is
rich in carbon (with a high calorific value) and low in sulfur [22]. When biochar sequesters
more carbon (atmospheric CO2 ) than emitted, it is carbon-negative [21]. In summary, the
motivations for applying biochar in a variety of fields include soil improvement (for im-
proving soil fertility, as well as environmental quality), waste management (for alleviating
environmental burden), climate change mitigation (for reducing GHG emissions), and
energy production (for producing biomass fuel or bioenergy) [23].
In order to promote the use of biochar and mitigate the GHG emissions from the
agricultural sector, the COA promulgated the regulation “Regulations Governing Certifica-
tion of Good Agricultural Products” for certifying the quality and safety of agricultural
products under the authorization of the Agricultural Production and Certification Act [19].
This regulation, recently revised on 30 October 2017, covers a variety of guidelines for
good forestry products such as biochar (wood char, bamboo char), wooden products,
laminated timber, and laminated bamboo. Furthermore, the Forestry Bureau was com-
mitted to building a certification for better awareness of domestic forest products among
consumers. The forest product manufacturers which have already acquired the Traceable
Agricultural Product (TAP) validation, the Forest Products Certification by CAS (Certified
Agriculture Standards), and the QR Code of Taiwan Forest Products Production Traceabil-
ity System can use the “Domestic Timber and Bamboo Certification Mark (the “Taiwan
Wood” mark)” for their processed forest products. This system can encourage a gradual
rise in market demand, drive the growth of wood/bamboo production and its industryAtmosphere 2021, 12, 1220 10 of 15
chain, and provide a sustainable cycle of afforestation, utilization, and reforestation of
artificial forests [24]. According to the Guidelines, the use of biochar covers a variety of
applications, including fuel, moisture-conditioning, freshness-keeping, water treatment,
deodorization, washing, healthcare, and fiber textile material activities. The test items of
biochar products for performance quality depend on the application use, but they quan-
tify moisture content, oven-dried fixed carbon, specific surface area, degree of refining,
hardness, and calorific value. In line with Taiwan’s sustainable development goals (SDGs)
and the Organic Agriculture Promotion Act promulgated in 2019, the use of biochar in
agricultural soils will gradually increase in the near future because the SDG for 2030 was
set to 30,000 ha of organic farming area as compared to the organic farming area of about
14,000 ha in 2019 [21].
3.3.2. Wood-to-Building Material
According to the data on Taiwan’s energy consumption in terms of various sectors
in 2020 [25], the service and residential sectors accounted for about 15% of total domestic
energy consumption. The percentage of service and residential sectors further shared
about 35% of electricity consumption. These figures were counted in the subsector of heat
and electricity (energy industries), as seen in Tables 1 and 2. Therefore, Taiwan’s GHG
emissions from the services and residential sectors in 2018 accounted for about 30% of total
GHG emissions [18]. The GHG emissions from the service and residential sources indicated
a decreasing trend from 9.5 million metric tons (CO2 equivalent) in 2005 to 7.8 million
metric tons in 2018. This can be attributed to the governmental policies for promoting
energy saving, green energy (i.e., electricity/heat generation by renewable resources like
solar energy), green buildings (GBs), and green building materials (GBMs) during this
period [26,27]. In addition, the manufacturing and construction industries are responsible
for a significant share of natural resources and energy consumption, thus emitting large
amounts of GHGs, as listed in Tables 3 and 4.
In order to be in line with the trends of a low-carbon society and healthy indoor
environment around the world, the Taiwan government has promulgated regulations for
promoting GBMs under the authorization of the Building Act since the early 2000s [19].
Currently, there are four categories of GBM (ecology, health, high performance, and re-
cyclability), which must be applied for approval by the central competent authority (i.e.,
MOI) [28]. According to the definition by the Building Technique Rules under the autho-
rization of the Building Act, the constituents of GBMs are expected to meet regulatory
requirements such as recycled wood products and natural materials. In this regard, the
GBMs must be nontoxic to human health, nonhazardous to the environment, and in
accordance with the national or international specifications/standards. Therefore, the
evaluation items of GBMs include restricted substances, e.g., heavy metals and chlorine-
containing polymers [26,27]. Among the GBMs, the scope of wood-to-building material
can be grouped into ecological GBMs and recycled GBMs, which are further summarized
below.
• Ecological GBMs
An ecological GBM is defined as “a building material using natural materials with
natural decomposition and without a shortage crisis, consuming minimal resources and
energy, and requiring less labor treatment”. Its goal is to promote the use of wooden
building materials (including wooden building material, natural plant-based building
material, wooden colorant, curtain, and wallpaper) for both environmental sustainability
and human health. Therefore, the assessment focused on the certificates of Traceable
Agricultural Products (TAP, described in Section 3.3.1), Forest Stewardship Council (FSC),
Program for the Endorsement of Forest Certification Schemes (PEFC), or other certificates
of origin.Atmosphere 2021, 12, 1220 11 of 15
• Recycled GBMs
The goal of recycled GMB use is to reduce construction waste and reuse (or recycle)
building materials such as wood ad minerals. Therefore, recycled GMBs focus on the
regeneration of GBMs in order to ensure basic functional demand and the upgrade reuse (or
recycling) rate of waste building material without causing secondary pollution or adverse
effects on human health. The assessment items include the types of recycled building
materials (e.g., particleboards, medium density fiber boards, and wooden furniture), their
sources and recycled content percentage, and their test methods, which were based on the
Taiwan’s Chinese National Standards (CNS) standards and the International Organization
for Standardization (ISO) standards.
In order to accelerate the development of GBMs, the ABRI, one of the public organiza-
tions under the central competent authority (i.e., MOI), has designated the architecture or
design-related departments of national universities (e.g., National Cheng Kung University)
and nonprofit organizations (e.g., Taiwan Architecture and Building Center) to assist the
industry in evaluating the performance of the prepared building material products. Ac-
cording to the official statistics [28], the annual number of certified GBM labels from 2005
to 2020 indicated an increasing trend, reaching a total of 2668 certified GBM products. In
2020, a total of 292 GBM labels (including 199 new applications and 93 contract renewals)
were issued, showing a significant increase of 38 from the previous year (2019). By the end
of 2020, the percentages of certified GBM labels were 76.5% by health, 8.2% by recyclabil-
ity, 14.9% by high-performance, and 0.4% by ecology. The distributions clearly reflected
that wood-based GBM products are not currently preferred by manufacturers with the
development trends of the GBM market in Taiwan.
3.3.3. Wood-to-Energy
According to the regulatory definition of biomass energy in the REDA, wood-to-energy
refers to energy generated from the direct use or treatment of vegetation, marsh gas (biogas),
and domestic organic waste. In this regard, waste wood can be considered an organic waste
for reuse as an energy source. In Taiwan, waste is basically divided into “general waste” and
“industrial waste” according to the Waste Management Act (WMA). Herein, the categories
(or codes) of waste wood are considered industrial waste because they are generated from
industrial activities such as manufacturing and construction industries. Waste wood can
be grouped into D-type and R-type, depending on the reuse (or recycling) or treatment
(incineration/disposal) costs. The factors affecting cost consideration involve reported
amounts, waste wood constituents, and pretreatment requirements (e.g., shredding or
physical/mechanical separation). As referred to in the database established by the EPA [29],
Table 5 lists the reported amounts of waste wood in terms of categories during the period of
2010–2020. Obviously, the recycled amounts of R-type waste wood indicated an increasing
trend, but the D-type waste wood showed a declining trend (D-07101 and D-0799). As
shown in Figure 6, the variation in the reported amounts of waste wood suggested that
the reuse (or recycling) has been prioritized by waste wood generators in recent years [29].
This situation can be attributed to the regulatory promotions and financial incentives for
resource recycling, circular economy, wood-to-energy, or sustainable material management
(SMM) since the early 2000s [30,31].Atmosphere 2021, 12, 1220 12 of 15
Table 5. Reported amounts of waste wood in terms of categories in Taiwan since 2010 1 .
Year
Waste Wood Category
2010 2011 2012 2013 2014 2015 2016 2017 2018 2019 2020
Waste wood
52,191 45,494 58,184 64,639 56,331 53,783 52,012 60,728 67,121 65,197 71,855
(R-0701)
Waste wood pallet
3501 3782 3493 3587 3741 3807 3632 3537 2915 2238 2196
(D-0701)
Waste mixed wood
20,988 21,860 21,702 21,113 22,061 20,377 18,610 14,902 15,369 12,480 13,911
(D-0799)
Total
Atmosphere 2021, 12, 1220 76,680 71,136 83,379 89,339 82,133 77,967 74,254 79,167 85,405 79,915 87,962
13 of 15
1 Source [29]; unit: metric tons.
Figure6.6.Variation
Figure Variationin in
thethe reported
reported amounts
amounts of waste
of waste woodwood in Taiwan
in Taiwan duringduring the period
the period of 2010–of
2010–2018
2018 [29]. [29].
Table 6. Quality
Over standards
the past of waste-to-energy
decades, solid recovered fuel (SRF)has
(WtE) in Taiwan.
been confirmed as an environment-
friendly systems
Quality Itemfor exploiting
Limit the energyUnitpotential of high-carbon-containing
Standard Method Sample wastes by
Basis
means of the generation of electricity and/or heat [32]. In order to exploit the combustible1
Net calorific value ≥2392 kcal/kg Average CNS 10835 As received
fractions in the waste, the individual/mixed waste streams are subjected to pretreatment
Clorine content ≤3 % Average EN 15408 db 2
in mechanical separation plants. The solid recovered fuel (SRF) or produced secondary
fuelMercury content ≤5 (highmg/kg (db)value),
Average
technicalEN 15411
particle As received 1
has favorable economic calorific (small size, ash and
Leadcontents),
moisture content and environmental
≤150 mg/kg(high
(db) biomass
Averagecontent)ENfeatures.
15411 Therefore,
As received
SRF is
1
Cadmiun used
increasingly content ≤5rangemg/kg
in a wide (db) Average
of co-incineration EN 15411
plants such As received
as high-efficiency boilers1
1 Using wind-dried sample or moisture-constant sample. 2 Dry basis.
and combustion facilities [33]. In line with the international trends in the use of SRF,
the Taiwan EPA formulated the Solid Recovered Fuel Manufacturing Guidelines and
Quality Standards to ensure the manufacturing quality of SRF in 2020. Table 6 lists the
quality standards of SRF in Taiwan, which are mainly based on the EN 15,359 standard
(“Solid recovered fuels- Specifications and classes”) [34]. On the other hand, the regulatory
promotion for electricity generation from the WtE systems is based on the feed-in tariffs
(FIT) under the authorization of the REDA. Figure 7 shows the FIT rates of biomass-to-
electricity since 2010, indicating that a significant increase was seen in 2017 as compared to
that in 2016.Atmosphere 2021, 12, 1220 13 of 15
Figure 6. Variation in the reported amounts of waste wood in Taiwan during the period of
2010–2018 [29].
Table 6. Quality standards of solid recovered fuel (SRF) in Taiwan.
Table 6. Quality standards of solid recovered fuel (SRF) in Taiwan.
Quality Item Limit Unit Standard Method Sample Basis
Net calorific value ≥2392 Quality Item
kcal/kg Limit Average Unit Standard Method
CNS 10835 As Sample
received 1Basis
≤3Net calorific value ≥2392 kcal/kg AverageEN 15408CNS 10835 As
dbreceived
1
Clorine content % Average 2
Clorine content ≤3 % Average EN 15408 db 2
Mercury content ≤5 mg/kg (db) Average EN 15411 As received 1
Mercury content ≤5 mg/kg (db) Average EN 15411 As received 1
Lead content ≤150 mg/kg (db) Average EN 15411 As received 1
Lead content ≤150 mg/kg (db) Average EN 15411 As received 1
Cadmiun content ≤5 Cadmiun content
mg/kg (db) ≤5 Average EN 15411 As received 1
mg/kg (db) Average EN 15411 As received 1
11Usingwind-dried
Using wind-dried sample
sampleoror
moisture-constant sample.
moisture-constant 2 Dry 2basis.
sample. Dry basis.
Figure7.7.Feed-in
Figure Feed-intariff
tariff(FIT)
(FIT)rates
ratesof
ofbiomass-to-electricity
biomass-to-electricityin
inTaiwan
Taiwansince
since2010.
2010.
4.4. Conclusions
Conclusions
Sincethe
Since theKyoto
KyotoProtocol
Protocolwas
was made
madeeffective
effectiveinin2007,
2007,the
thedecoupling
decouplingofofeconomic
economic
development
development from
fromGHG
GHGemissions
emissionshas hasbecome
becomeaacore
coremission
missioniningovernance.
governance.Although
Although
Taiwan
Taiwanisisnot
notaaUNFCCC
UNFCCCparty,
party,itithas
haslong
longbeen
beencommitted
committedto tofulfilling
fulfillingits
itsresponsibility
responsibility
as
asaamember
memberof ofthe
theglobal
globalcommunity
communityby byendeavoring
endeavoringto totake
takeinitiatives
initiativestotohelp
helpmitigate
mitigate
GHG
GHGemissions.
emissions. An
An increase
increase of
of14.3%
14.3%in inthe
theGHG
GHGemissions
emissionsfrom
fromthe theenergy
energyindustries
industries
was obtained at an average annual growth rate of 1.68% during the period of 2010–2018.
More significantly, the GHG emissions from the manufacturing and construction industries
indicated a decreasing trend at an average annual rate of −2.93%. In order to further
reduce GHG emissions from the energy and agricultural sectors, the Taiwan government
promulgated some regulatory measures and promotional actions (or programs) related
to green energy production and efficient energy saving. One of the carbon-negative
policies was to reuse waste wood as material and energy resources, including wood-
based char, ecological building material, and wood-to-biofuel (e.g., solid recovered fuel)
pathways. In line with the sustainable development goals (SDGs) of Taiwan, carbon-
negative policies involving the reuse of waste wood and other lignocelluloses as material
and energy resources will play an important role in the mitigation of GHG emissions by
2030. On the other hand, the forestry sector in Taiwan must provide more wood resources
in wood-based products, which are important carbon substitution patterns.
Author Contributions: Conceptualization, W.-T.T.; data collection, W.-T.T.; data analysis, W.-T.T.;
writing—original draft preparation, W.-T.T.; writing—review and editing, W.-T.T. The author have
read and agreed to the published version of the manuscript.
Funding: This research received no external funding.
Institutional Review Board Statement: Not applicable.Atmosphere 2021, 12, 1220 14 of 15
Informed Consent Statement: Not applicable.
Data Availability Statement: Not applicable.
Conflicts of Interest: The author declares no conflict of interest.
References
1. Food and Agricultural Organization, FAO. Carbon Storage and Climate Change Mitigation Potential of Harvested Wood Products.
Available online: http://www.fao.org/forestry/49800-0812a13ea85265539335c760f45630d3d.pdf (accessed on 5 August 2021).
2. Januszewicz, K.; Kazimierski, P.; Klein, M.; Kardaś, D.; Łuczak, J. Activated carbon produced by pyrolysis of waste wood and
straw for potential wastewater adsorption. Materials 2020, 13, 2047. [CrossRef] [PubMed]
3. Kosakowski, W.; Bryszewska, M.A.; Dziugan, P. Biochars from post-production biomass and waste from wood management:
Analysis of carbonization products. Materials 2020, 13, 4971. [CrossRef] [PubMed]
4. Haryanto, A.; Hidayat, W.; Hasanudin, U.; Iryani, D.A.; Kim, S.; Lee, S.; Yoo, J. Valorization of Indonesian wood wastes through
pyrolysis: A review. Energies 2021, 14, 1407. [CrossRef]
5. Rodriguez-Franco, C.; Page-Dumroese, D.S. Woody biochar potential for abandoned mine land restoration in the US: A review.
Biochar 2021, 3, 7–22. [CrossRef]
6. Bergman, R.; Puettmann, M.E.; Taylor, A.; Skog, K.E. The carbon impacts of wood products. For. Prod. J. 2014, 64, 220–231.
[CrossRef]
7. European Parliamentary Research Service. Biomass for Electricity and Heating: Opportunities and Challenges. 2015. Available
online: https://www.europarl.europa.eu/RegData/etudes/BRIE/2015/568329/EPRS_BRI(2015)568329_EN.PDF (accessed on 5
September 2021).
8. Brack, D. Sustainable Consumption and Production of Forest Products. In Proceedings of the Thirteenth Session of the United
Nations Forum on Forests, New York, NY, USA, 7–11 May 2018; Available online: https://www.un.org/esa/forests/wp-content/
uploads/2018/04/UNFF13_BkgdStudy_ForestsSCP.PDF (accessed on 5 September 2021).
9. Besserer, A.; Troilo, S.; Girods, P.; Rogaume, Y.; Brosse, N. Cascading recycling of wood waste: A review. Polymers 2021, 13, 1752.
[CrossRef]
10. World Resources Institute, WRI. 4 Charts Explain Greenhouse Gas Emissions by Countries and Sectors. Available online:
https://www.wri.org/insights/4-charts-explain-greenhouse-gas-emissions-countries-and-sectors (accessed on 5 August 2021).
11. Intergovernmental Panel on Climate Change (IPCC). 2006 IPCC Guidelines for National Greenhouse Gas Inventories; IPCC: Geneva,
Switzerland, 2007.
12. Tsai, W.T.; Lin, Y.Q. Trend analysis of air quality index (AQI) and greenhouse gas (GHG) emissions in Taiwan and their regulatory
countermeasures. Environments 2021, 8, 29. [CrossRef]
13. Chen, L.C.; Lin, J.C.; Wu, C.S.; Huang, G.M.; Chen, Y.H. The current status of the wood product in Taiwan. Q. J. Forest Res. 2012,
34, 287–296. (In Chinese)
14. Taiwan Forestry Research Institute, Council of Agriculture. Taiwan Forestry Knowledge Planform—Forestry Information.
Available online: https://woodsearch.tfri.gov.tw/information_statistics_search.php (accessed on 5 September 2021).
15. Sanchez, D.; Kammen, D. A commercialization strategy for carbon-negative energy. Nat. Energy 2016, 1, 15002. [CrossRef]
16. Goswami, M.; Pant, G.; Mansotra, D.K.; Sharma, S.; Joshi, P.C. Biochar: A carbon negative technology for combating climate
change. In Advances in Carbon Capture and Utilization; Pant, D., Nadda, A.K., Pant, K.K., Agarwal, A.K., Eds.; Springer Nature:
Singapore, 2021; pp. 251–272.
17. Vinci, G.; Ruggieri, R.; Billi, A.; Pagnozzi, C.; Di Loreto, M.V.; Ruggeri, M. Sustainable management of organic waste and recycling
for bioplastics: A LCA approach for the Italian case study. Sustainability 2021, 13, 6385. [CrossRef]
18. Environmental Protection Administration (EPA). Taiwan Greenhouse Gases Inventory; EPA: Taipei, Taiwan, 2020.
19. Ministry of Justice, Taiwan. Laws and Regulation Retrieving System. Available online: https://law.moj.gov.tw/Eng/index.aspx
(accessed on 3 August 2021).
20. Council for Sustainable Development. Annual Review Report on the Taiwan’s Sustainable Development Goals; Environmental
Protection Administration: Taipei, Taiwan, 2020. (In Chinese)
21. Das, S.K.; Avasthe, R.K.; Singh, R.; Babu, S. Biochar as carbon negative in carbon credit under changing climate. Curr. Sci. 2014,
107, 1090–1091.
22. Basu, P. Biomass Gasification, Pyrolysis and Torrefaction: Practical Design and Theory, 2nd ed.; Academic Press: San Diego, CA, USA,
2013; pp. 47–86.
23. Lehmann, J.; Joseph, S. Biochar for environmental management: An introduction. In Biochar for Environmental Management, 2nd
ed.; Lehmann, J., Joseph, S., Eds.; Routledge: New York, NY, USA, 2015; pp. 1–13.
24. Tsai, W.T. Forest resource management and its climate-change mitigation policies in Taiwan. Climate 2021, 9, 3. [CrossRef]
25. Ministry of Economic Affairs (MOEA). Energy Statistics Handbook; MOEA: Taipei, Taiwan, 2021.
26. Hsieh, T.T.; Chiang, C.M.; Ho, M.C.; Lai, K.P. The application of green building materials to sustainable building for environmental
protection in Taiwan. Adv. Mater. Res. 2012, 343, 267–272. [CrossRef]
27. Tsai, W.T. Overview of green building material (GBM) policies and guidelines with relevance to indoor air quality management
in Taiwan. Environments 2018, 5, 4. [CrossRef]Atmosphere 2021, 12, 1220 15 of 15
28. Taiwan Architecture and Building Center, TABC. Green Building Materials. Available online: https://www.tabc.org.tw/tw/
modules/about/gbm (accessed on 13 June 2021).
29. EPA, Taiwan. Industrial Waste Reporting and Management Information System. Available online: https://waste.epa.gov.tw/
RWD/Statistics/?page=Month1 (accessed on 16 July 2021).
30. Tsai, W.T.; Chou, Y.H. Overview of environmental impacts, prospects and policies for renewable energy in Taiwan. Renew. Sustain.
Energy Rev. 2005, 9, 119–147. [CrossRef]
31. Tzou, L.; Liu, K.H.; Hu, A.H. The development of sustainable materials management (SMM) and circular economy in Taiwan. In
Waste Management and Resource Efficiency; Ghosh, S., Ed.; Springer: Singapore, 2019; pp. 209–217.
32. Makarichi, L.; Jutidamrongphan, W.; Techato, K. The evolution of waste-to-energy incineration: A review. Renew. Sustain. Energy
Rev. 2018, 91, 812–821. [CrossRef]
33. Lorber, K.E.; Sarc, R.; Aldrian, A. Design and quality assurance of solid recovered fuel. Waste Manag. Res. 2012, 30, 370–380.
[CrossRef] [PubMed]
34. Flamme, S.; Geiping, J. Quality standards and requirements for solid recovered fuels: A review. Waste Manag. Res. 2012, 30,
335–353. [CrossRef] [PubMed]You can also read