Cash Is KIng But the KIng Is DeaD - By: Justin Hughes, CFA - Empire Financial ...
←
→
Page content transcription
If your browser does not render page correctly, please read the page content below
Cash Is KIng…

       …But…

…the KIng Is DeaD
       By: Justin Hughes, CFA

                                PHILADELPHIA FINANCIAL
1                               of San Francisco, L.L.C.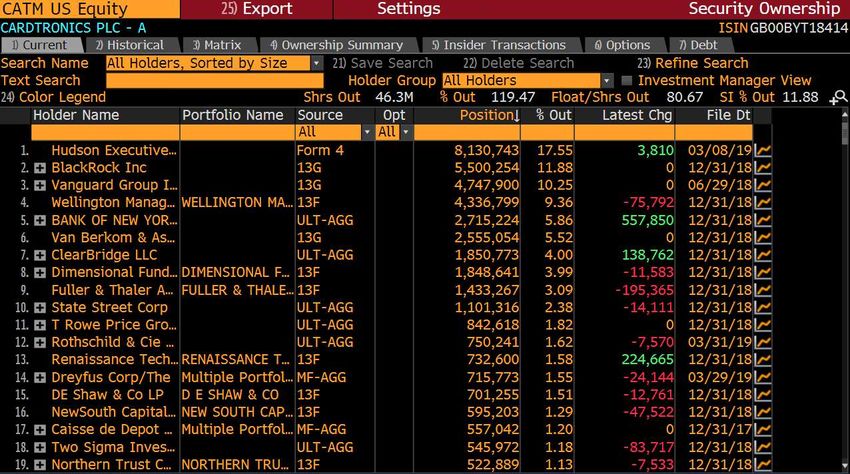
2

                           Short Idea Introduction
• Cardtronics is a case of technical obsolescence, their product being physical paper cash,
  which has been losing share to electronic payments for decades. Recently, cash usage has
  declined according to the Federal Reserve.

• The ATM business is heavily leveraged to volumes. We estimate a 10% revenue decline
  could impact earnings by 40%.

• Tap to Pay adoption likely results in 25% to 35% declines in ATM transactions as
  witnessed in the U.K. and Australia. Adoption curves show Tap to Pay cannibalizes cash
  and will typically be 50% of in person transactions within 5 years.

• All 5 of the largest U.S. mass transit systems are adopting Tap to Pay within the next 12 to
  18 months. International examples show that Tap to Pay adoption rapidly accelerates in
  areas with mass transit adoption.

                                                                                  PHILADELPHIA FINANCIAL
                                                                                  of San Francisco, L.L.C.
                   2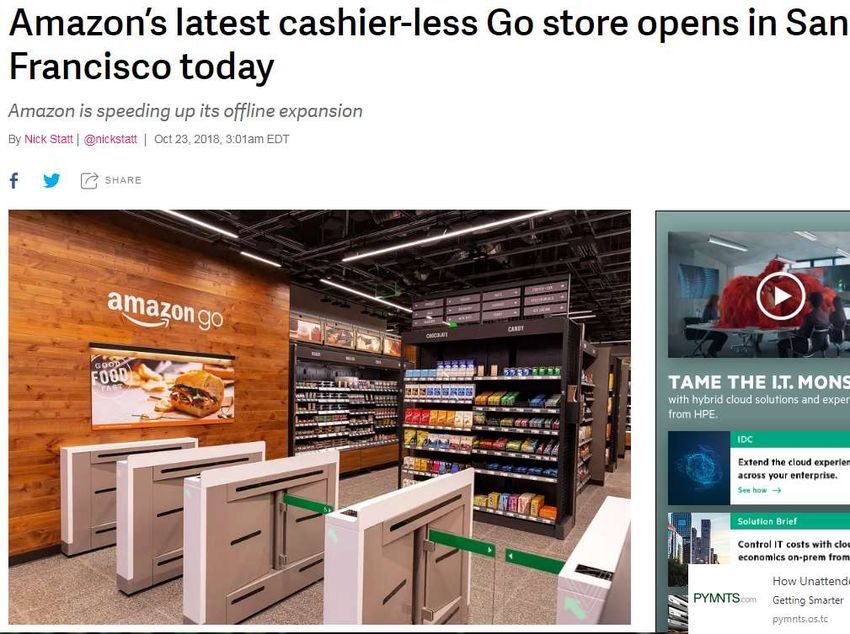
3
Outline
• Our case study is a short position on Cardtronics (CATM), an
ATM owner and operator:
Technological Obsolescence
Then & Now
Cash Is The New Check
Federal Reserve Data Shows Cash In Decline
More Recent Research Shows The Decline is Accelerating
Demographics Make It Unlikely To Reverse Trend
Tap To Pay Adoption Cannibalizes Cash
Global Phenomenon
U.K. Example: 25% ATM Volume Decline
Australian Example: 35% ATM Volume Decline
U.S. Adoption Has Started
Transit Accelerates Adoption
PHILADELPHIA FINANCIAL
3 of San Francisco, L.L.C.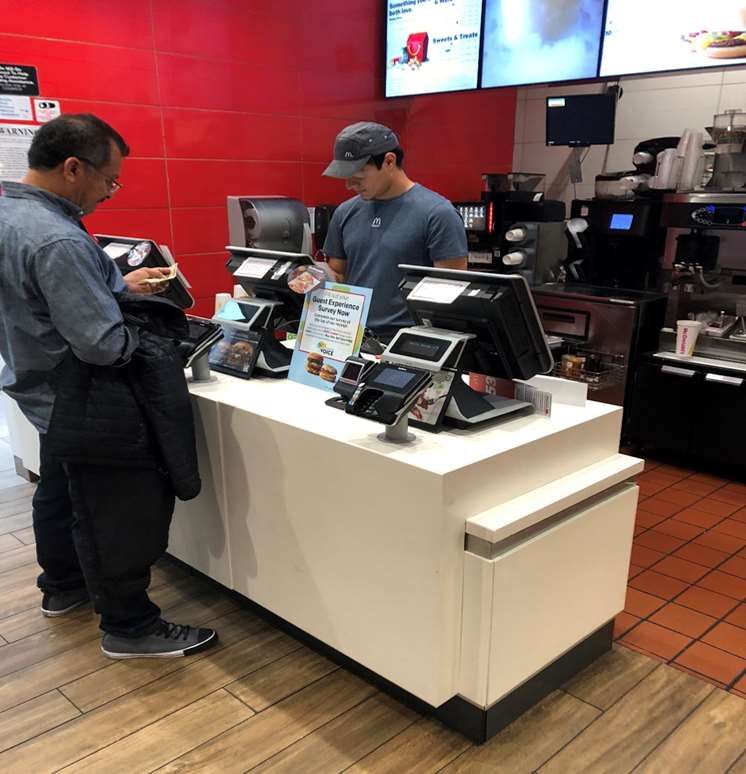
4
Outline
Cardtronics Specific
Are Challenges Behind?
Leverage * Leverage * Declining Revenue = Trouble³
CATM’s Top Partners Embracing Contactless
Revenue Metrics A Concerning Trend
2018 Metrics Had One-Time Benefits
Tailwinds Becoming Headwinds
Questionable ‘Organic Growth’
Economically Impaired Assets Weigh On The Balance Sheet
Gap Widening Between GAAP And Adjusted Results
Roller Coaster Guidance
Refuting The Bull Case
Earnings Beats Do Not Fix Fundamental Problems
Is CATM A Software Or Hardware Company?
High CapEx Relative To Peers Makes EBITDA Metrics Less Relevant
Appendix
PHILADELPHIA FINANCIAL
4 of San Francisco, L.L.C.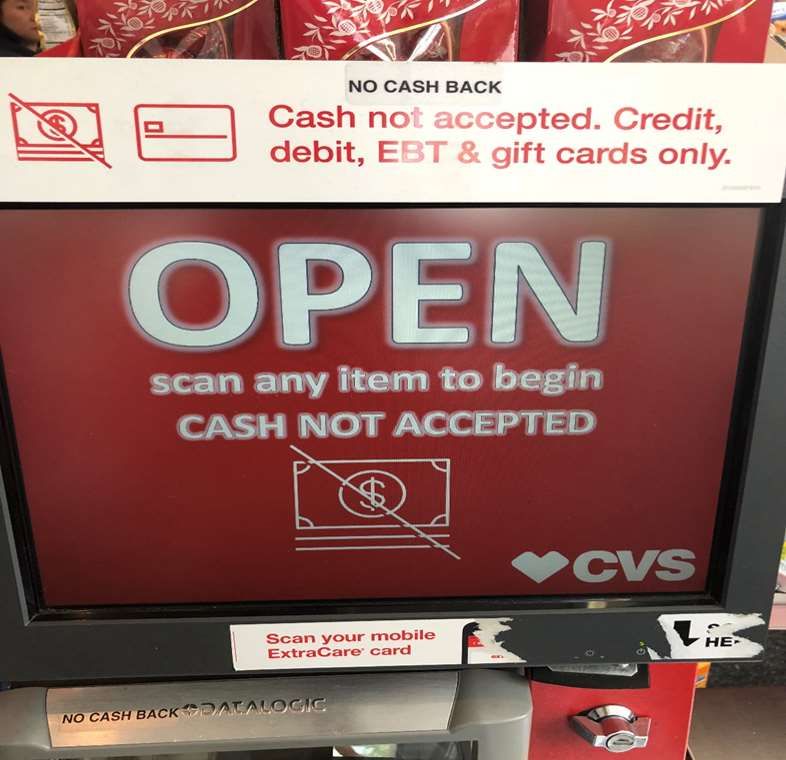
5

Technological Obsolescence

                             PHILADELPHIA FINANCIAL
 5                           of San Francisco, L.L.C.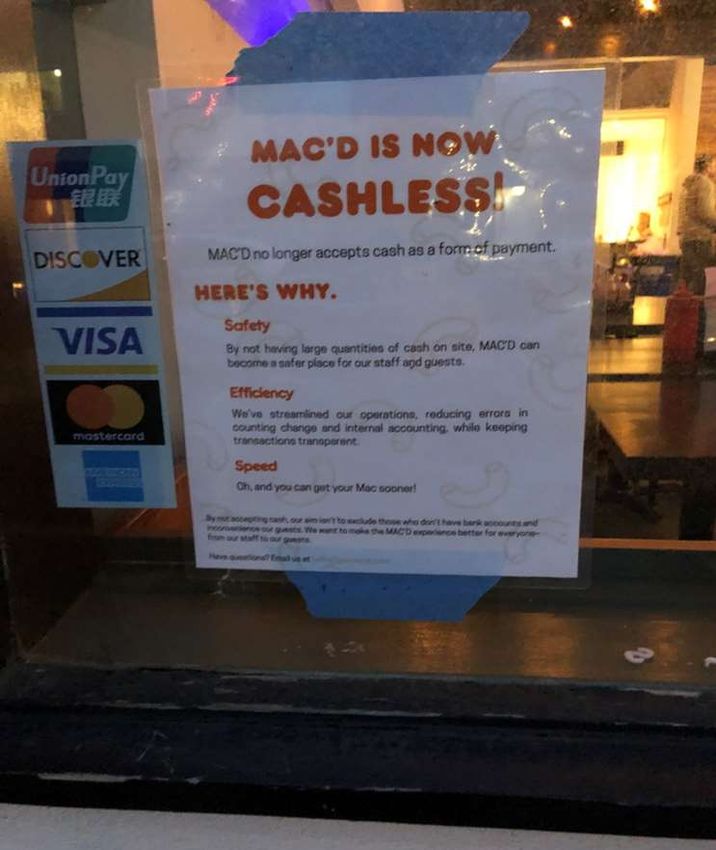
6

    Then & Now

                 PHILADELPHIA FINANCIAL
6                of San Francisco, L.L.C.
7

                                      Cash Is The New Check
For hundreds of years, check volumes grew despite the introduction of credit cards, the internet, eCommerce, and the dot
com boom. As we entered the new millennium, it seemed the check was unstoppable. However, year 2000 proved to be
the tipping point as checks not only lost share, but went into absolute decline.

     Source: Triennial Federal Reserve Payments Study   Source: Federal Reserve Payments Study

                                                                                                        PHILADELPHIA FINANCIAL
                       7                                                                                of San Francisco, L.L.C.
8

                           Cash Is The New Check
Consumers are making a rational choice to move away from cash:

• Faster checkout experience and no cumbersome coins

• Cards often offer cashback, points, or rewards

• Transactions can be disputed if not properly delivered

• Safer: A lost card can be deactivated, cash is gone

• Cards offer ability to revolve balance

• Cards can execute transactions much larger than would be practical with cash

• Government programs moving to card-based systems

                                                                                 PHILADELPHIA FINANCIAL
                 8                                                               of San Francisco, L.L.C.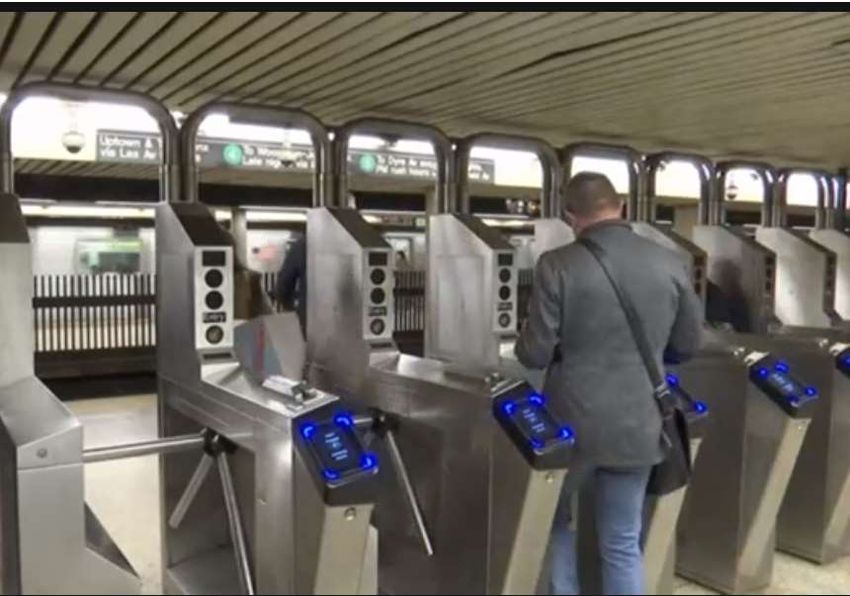
9

CATM Overstates Its Addressable Market By Pointing
         Investors to Cash in Circulation
   CATM management points investors to ‘Total Cash in Circulation’ even though
   CATM is not paid on cash outstanding. We believe CATM is more closely tied
   to ‘Transactional Cash’.

                Source: Cardtronics 2019 Investor Day

   We have done a deep dive into Federal Reserve data to analyze ‘Transactional
   Cash’ using the definition provided by the Federal Reserve – Transactional
   Cash includes: $1, $5, $10, and $20s.
                                                                          PHILADELPHIA FINANCIAL
            9                                                             of San Francisco, L.L.C.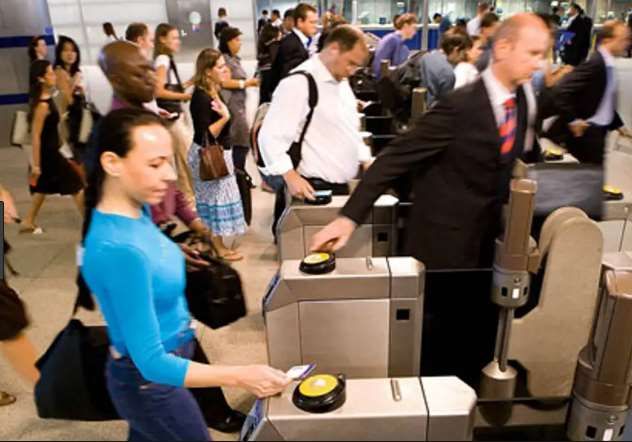
10
Federal Reserve Data Shows Cash In Decline
‘Transactional Cash’ Demand In Decline: $1s, $5s, $10s, and $20s
Since 2000:
Nominal GDP has nearly doubled
U.S. Population +16%
Transactional Cash 3-year average print orders down 37%
100,000 100
1981-1982: Iran/Oil
1990-1991: Oil Shock
2001: Dot Com
2007-2009:GFC
3-Year Average 'Transactional Cash' ($Bs)
75,000 75
U.S. Nominal GDP ($Bs)
50,000 50
25,000 25
0 0
1982
1983
1984
1985
1986
1987
1988
1989
1990
1991
1992
1993
1994
1995
1996
1997
1998
1999
2000
2001
2002
2003
2004
2005
2006
2007
2008
2009
2010
2011
2012
2013
2014
2015
2016
2017
2018
Nominal GDP Total Transactional Cash Printed (3-year Avg)
Source: Federal Reserve PHILADELPHIA FINANCIAL
10 of San Francisco, L.L.C.11
Federal Reserve Data Shows Cash In Decline
Transactional Coin Demand In Decline
How much change is in your pocket?
(pennies, nickels, dimes, and quarters)
8,000 400
328
3-Year Avg Coins Minted ($M)
6,000 282 300
U.S. Population
$4.8B
4,000 200
$2.5B
2,000 100
0 0
'00 '01 '02 '03 '04 '05 '06 '07 '08 '09 '10 '11 '12 '13 '14 '15 '16 '17 '18
3-Yr Avg Coins Minted U.S. Population
Source: Federal Reserve
We believe coins represent an important indicator of everyday cash usage.
PHILADELPHIA FINANCIAL
11 of San Francisco, L.L.C.12
Federal Reserve Data Shows Cash In Decline
• Transactional cash “velocity” is slowing as shown by the Fed’s unusually low 2019 print order.
Bills are lasting longer, and banks sit with high inventory.
“During FY 2018, Reserve Banks destroyed fewer notes than we estimated when we prepared the FY 2018
order. As a result, Reserve Banks will end the year with larger inventories.”
• Cash outstanding (specifically $100s, which CATM does not dispense) can be growing while
transactional cash can be declining. The number of outstanding U.S. $100 bills has doubled
since the financial crisis and accounted for the vast majority of the growth in cash in
circulation.
PHILADELPHIA FINANCIAL
12 of San Francisco, L.L.C.13
Federal Reserve Data Shows Cash In Decline
The Federal Reserve’s Most Recent Data Showed ATM Transactions Declined 2.8% In 2017.
These trends tend not to reverse:
UK reported its first decline in ATM activity in 2016. Every year has been negative since.
Australia never reported negative ATM activity until 2008. Every year has been negative
since.
Source: The Federal Reserve Payments Study: 2018 Annual Supplement
PHILADELPHIA FINANCIAL
13 of San Francisco, L.L.C.14
More Recent Research Shows An Acceleration
Management teams across industries
“Cash as a tender continues to approach zero over time.” - Bradley Lukow, Sprouts Farmer’s Market Interim Co-CEO
and CFO, on 3Q18 earnings call.
“Delivery is so new, but it’s like credit card sales. At some point, you got to be in that game.” – Kevin Ozan, CFO of
McDonald’s. McDonald’s is currently installing cashless kiosks at all locations.
“New guest-facing technology that enhances the overall dining experience, such as our no-wait tool to provide more
accurate wait times, server tables to increase order efficiency and accuracy, and wireless credit card devices to allow
guests to easily pay.” - Darren Rebelez, President of IHOP, Dine Brands 4Q18 earnings call.
‘So, we’re seeing credit card charges continue to be a bit higher than what we typically run. Some of that is due to
credit card transactions, more of those transactions being plastic versus cash, so that’s one thing we saw this
quarter.” – 2Q18 earnings call, Tonya Robinson, Texas Roadhouse CFO.
PHILADELPHIA FINANCIAL
14 of San Francisco, L.L.C.15
More Recent Research Shows An Acceleration
It’s Not Just About Cards, Multiple Technologies Are Cannibalizing
• Square/Dongle
Square has built a $28B market cap company by targeting the ‘micro-merchant’, i.e. the cash based merchant that
traditional merchant acquirers deemed too small for credit card processing – that has all changed and now we have a
million impersonators: Toast, Lightspeed, Revel, etc.
• Venmo
Venmo was used by 40 million people in the last twelve months for person to person payments.
• SQ Cash App
Cash App (Square) reports 15 million monthly users.
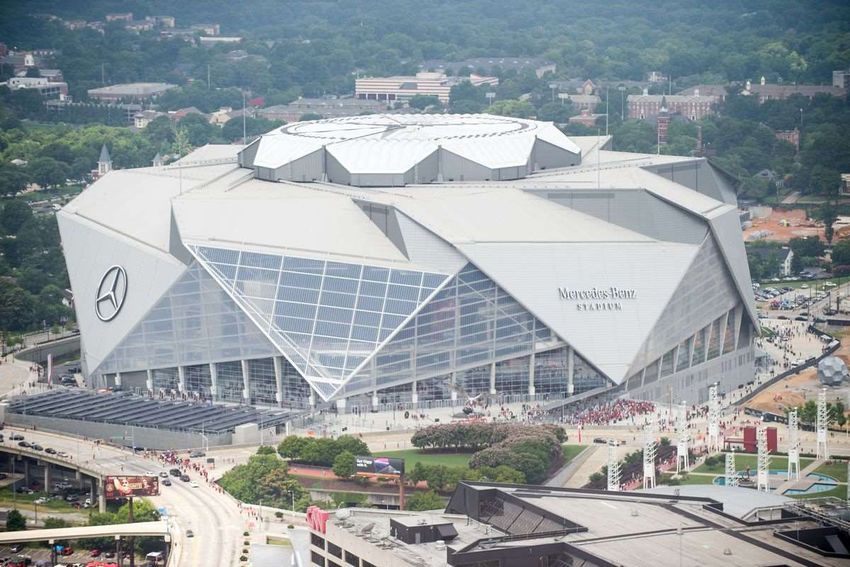
• Select businesses moving to cashless
60% of McDonald’s U.S. locations now have kiosks and mobile ordering and 100% roll out is targeted by 2020.
Mercedes-Benz Stadium in Atlanta is now cashless citing a better customer experience.
PHILADELPHIA FINANCIAL
15 of San Francisco, L.L.C.16
Demographics Make It Unlikely To Reverse Trend
• Venmo #1 downloaded app on college campuses according to Paypal
• Half of Millennials use peer-to-peer payments at least once a week - Economist
• 75% of adults under 25 would rather be without their wallet than their phone
• 18-34 age group is now making 54% of their purchases online
Generation Z (ages 12-23) Is Clearly More Comfortable With Mobile Payments Than Cash
PHILADELPHIA FINANCIAL
16 Source: Manole Capital proprietary survey of San Francisco, L.L.C.17
Tap To Pay Cannibalizes Cash
- Visa
PHILADELPHIA FINANCIAL
17 of San Francisco, L.L.C.18
Global Phenomenon
• Tap to Pay technology executes a transaction instantaneously
by ‘tapping’ the card by the POS machine.
• Mobile wallets (Apple & Samsung) offer a similar experience.
Outside the U.S., 48% of face-to-face transactions are tap to pay.
Apple Pay volumes more than doubled and are on pace for 10 billion this year
“Tap to pay has proven it can displace cash at a more rapid rate and one of the most effective
ways to accelerate the shift from cash to card.” – F2Q19 Visa earnings call.
Tap to Pay Market Share, Ex U.S.
60%
Domestic % Face-to-Face Transactions,
48%
44%
40%
40% 36%
34%
Ex U.S.
20%
0%
1Q18 2Q18 3Q18 4Q18 1Q19
PHILADELPHIA FINANCIAL
18 Source: Visa of San Francisco, L.L.C.19
U.K. Example: 25% ATM Volume Decline
Tap to Pay led to a 25% decline in ATM volumes
UK-Annual ATM Transactions
3,000
2,500
Following Tap to Pay introduction
2,000 in 2007 ATM Withdrawals
declined 25% from Peak, most of
which was lost after Tube
1,500
adoption in 2014
1,000
Source: LINK (U.K.)
CATM has highlighted the pressure this has created in the company’s U.K. business
Australia and the UK have reported increasing rates of contactless payment use as cash-based payments have declined as a percentage of
total payments in recent years, with growth in contactless payments appearing to be the primary driver of the decline. - 2018 10K
PHILADELPHIA FINANCIAL
19 of San Francisco, L.L.C.20
U.K. Example: 25% ATM Volume Decline
“The continuing adoption of new payment methods is reducing the
demand for cash and therefore ATM withdrawals.” – Link’s (Largest UK
cash machine network) February 2019 Monthly ATM Footprint Report
PHILADELPHIA FINANCIAL
20 of San Francisco, L.L.C.21
Australia Example: 35% ATM Volume Decline
“Around the turn of decade, Australians went to an ATM, on average, around 40 times
per year. Today, we go to an ATM around 25 times a year and the downward trend is
likely to continue.” - Reserve Bank of Australia Governor Philip Lowe
Australia-Monthly ATM Transactions
80,000
70,000
60,000 Following Tap to Pay introduction
in 2006 ATM Withdrawals
50,000
declined 35% from Peak. Mass
transit made availabe late 2018
could push further declines
40,000
Jan-2003
Jan-2006
Jan-2009
Jan-2012
Jan-2015
Jan-2018
Oct-2003
Oct-2006
Oct-2009
Oct-2012
Oct-2015
Oct-2018
Jul-2004
Jul-2007
Jul-2010
Jul-2013
Jul-2016
Apr-2002
Apr-2005
Apr-2008
Apr-2011
Apr-2014
Apr-2017
Source: Reserve Bank of Australia
CATM has highlighted the pressure this has created in the company’s Australian business
PHILADELPHIA FINANCIAL
21 of San Francisco, L.L.C.22
Tap To Pay: U.S. Adoption Has Started
More than 100 million contactless cards will be issued in the US by the end of 2019 – according to Visa.
Wells Fargo, Capital One, American Express, Citi, and Chase are all issuing Tap to Pay cards.
78 of the top 100 merchants (by transactions) currently enabled for contactless payments. 92% of
pharmacies and 82% of quick service restaurants are accepting Tap to Pay cards.
Contactless enabled merchants already represents 68% of all face to face transactions in the US.
PHILADELPHIA FINANCIAL
22 of San Francisco, L.L.C.23
Transit Accelerates Adoption
London Tube: Accepts contactless payments NY Contactless payments…NOW: May 31st Launch
When transit adopts ‘Tap to Pay,’ the adoption
curves are much steeper - Visa
PHILADELPHIA FINANCIAL
23 of San Francisco, L.L.C.24
Transit Accelerates Adoption: U.S. Conversions Underway
NY Subway & Staten Island Bus: Friends & family testing now, release to public May 31st on limited lines.
NY is the largest mass transit system in the U.S., moving more people than the next 10 systems combined.
Chicago: Apple & Samsung Pay and Tap to Pay cards enabled 2H19. Chicago is 2nd largest mass transit
system in the U.S.
Washington DC: Expects to be ready in 2019. This is 3rd largest system.
Boston: Tap to Pay and mobile roll out over the next 12 months. Boston is the 4th largest mass transit
system in the U.S.
SF Bay Area: Tap to Pay in next year. This is the 5th largest system.
Portland: Tap to Pay available now.
We estimate 25% of CATM’s ATMs are in MSAs in the process of rolling out Tap to Pay and mobile
payments within the next 18 months.
PHILADELPHIA FINANCIAL
24 of San Francisco, L.L.C.25
Cardtronics Specific
PHILADELPHIA FINANCIAL
25 of San Francisco, L.L.C.26
Are Challenges Behind?
The company has had to deal with:
1. Tap to Pay adoption in the U.K. and Australia
2. Australian banks eliminating ATM surcharge fees while CATM is all
surcharge (i.e. competition went to free)
3. Interchange fees reduced in the U.K.
4. Loss of largest partner: 7-Eleven, who is now part of the MoneyPass
surcharge free network.
The company has maintained pro forma profitability, but we
believe new challenges are ahead.
PHILADELPHIA FINANCIAL
26 of San Francisco, L.L.C.27
Leverage * Leverage * Declining Revenue = Trouble³
CATM’s business model has the following characteristics:
Declining revenue outlook driven by technological obsolescence
High operating leverage
Example: 7-Eleven loss accounted for 12% of revenues, but nearly 40% pre-tax income
Balance Sheet Leverage
Debt/Adjusted EBITDA at 2.8x
PHILADELPHIA FINANCIAL
27 of San Francisco, L.L.C.28
CATM’s Top Partners Embracing Contactless
CATM lists the following retailers as among their largest partners
CVS
Walgreens
Speedway
• 3,000 Speedways now accept Apple Pay
PHILADELPHIA FINANCIAL
28 of San Francisco, L.L.C.29
Revenue Metrics A Concerning Trend
• Constant currency organic revenue growth trending in wrong direction
Constant Currency Organic Growth
1Q18 2Q18 3Q18 4Q18 2018 1Q19
North America -14% -18% -19% -10% -15% -2%
- Ex-7-11 7% 4% 2% 2% 4% 1%
Europe & Africa -1% -2% -4% -3% -2% -1%
Australia & NZ -12% -12% -10% -8% -9% -7%
Subtotal N/D -13% -14% -8% -11% -2%
Corporate N/D -1% 7% -2% -7% -3%
Consolidated N/D -14% -14% -8% -11% -2%
- Ex-7-11 3% 1% -1% -1% 0% 0%
Source: Company reports
ND = Not disclosed
Data not provided prior to 1Q18
• CATM has reduced its ATM fleet for 5 consecutive quarters before stopping disclosure
Company Owned Ending # of Transacting ATMs:
1Q17 2Q17 3Q17 4Q17¹ 1Q18 2Q18 3Q18 4Q18
North America 52,583 52,288 51,962 47,082 45,726 44,393 43,943 43,233
Europe & Africa 24,850 25,512 25,988 26,148 25,291 24,369 24,335 23,768
Australia & NZ 9,100 8,784 8,636 8,312 8,249 8,010 7,813 7,585
Company Owned 86,533 86,584 86,586 81,542 79,266 76,772 76,091 74,586
Q/Q Change 0.1% 0.0% -5.8% -2.8% -3.1% -0.9% -2.0%
Merchant Owned Ending # of Transacting ATMs:
1Q17 2Q17 3Q17 4Q17¹ 1Q18 2Q18 3Q18 4Q18
North America 15,327 15,279 15,045 14,357 14,238 14,177 13,979 13,406
Europe & Africa 743 881 793 537 300 218 0 231
Australia & NZ 103 103 103 103 103 103 103 103
Merchant Owned 16,173 16,263 15,941 14,997 14,641 14,498 14,082 13,740
Q/Q Change 0.6% -2.0% -5.9% -2.4% -1.0% -2.9% -2.4%
¹Most of 7-Eleven rolls off PHILADELPHIA FINANCIAL
29 Source: Company reports of San Francisco, L.L.C.
Company stopped disclosing end of period machine counts30
2018 Metrics Had One-Time Benefits
1. 7-Eleven volume recapture: When 7-Eleven went off CATM’s free Allpoint
network, the company believed some of the volume was recaptured. So, while
the 7-Eleven loss was ‘pro forma’d’ out of organic growth, the recapture benefit
remained as an organic benefit. See below.
2. CATM likely eliminated its lowest performing machines. Thus, the reported “SSS”
number only shows the performance of their best performing machines. Even
post the 7-Eleven machine removals, ATMs are declining at a 7% annualized rate.
3. 2017 EMV upgrades led to high “downtimes” in 2017 so 2018 “uptimes” were
bound to improve and the company currently claims “record” levels of “uptimes.”
“We estimate that the year ended December 31, 2018 was also positively impacted by transactions which
migrated back to our network following the removal of Allpoint from 7-Eleven stores on July 1st, 2017.
Finally, we believe the growth rate during the year ended December 31st, 2018 was positively impacted by
higher ATM availability relative to the prior year as a result of the software upgrades and outages in 2017
that negatively impacted transaction volumes during the first part of that year.” - CATM 2018 10K
PHILADELPHIA FINANCIAL
30 of San Francisco, L.L.C.31
Tailwinds Becoming Headwinds
CATM annualized 7-Eleven volume recapture in 1Q19
Machines will be comparing against the ‘record uptimes’ reported in 2018 and
thus difficult to show further improvement
Machines will incur downtime for Windows 10 upgrades
Machine fleet has been rationalized, but the company now has fewer machines
deployed
PHILADELPHIA FINANCIAL
31 of San Francisco, L.L.C.32
Tailwinds Becoming Headwinds
New competition: MoneyPass boasts 32,000 surcharge-free ATMs versus the 55,000 at
Allpoint. MoneyPass partners include: 7-Eleven, Fifth Third, US Bancorp, Zions, East West
Bank, Mechanics Bank, Provident Credit Union, etc.
Customers likely to change their behavior to avoid surcharge fees. In the UK, CATM added
surcharges to 4,000 machines in 1Q19 and we believe this could negatively impact
volumes.
In Australia, 77% of CATM revenues are from surcharge while all major banks offer free
ATM transactions to not only their own customers, but customers of their competitors,
essentially creating a free to use utility. We believe consumers will continue to rationally
take advantage of free ATMs.
Post the 7-Eleven loss, North America ATM count (CATM owned) has declined at a 7.4%
annualized rate. For all of 2018, ATMs in Europe declined 9.1% and Australia ATMs
declined 8.7%. Because of seasonality, it is more difficult to measure trends in the number
of ATM transactions post 7-Eleven, however if trends were strong or even stable, we do not
believe CATM would be removing ATMs.
PHILADELPHIA FINANCIAL
32 of San Francisco, L.L.C.33
Questionable ‘Organic Growth’
CATM Has Inconsistencies In Its Definition Of ‘Organic Growth’
Organic growth excludes price cuts due to LINK price changes
Includes price increase via added surcharge to offset the LINK price reductions
Excludes all geographies with negative same store sales
Excludes machine removals
Despite all these inconsistencies, claimed revenue growth is still roughly in line with inflation
PHILADELPHIA FINANCIAL
33 of San Francisco, L.L.C.34
Economically Impaired Assets Weigh On The Balance Sheet
The company has 4,000 ATMs out of operation, yet has not impaired the value of these
assets. With continued declining ATM counts, we think it is unlikely that these ATMs will be
put back into service.
We estimate these assets have a carrying value of $10M to $20M. The impact of a write off
would be noncash, but we question why the company sits on so many unused machines.
PHILADELPHIA FINANCIAL
34 of San Francisco, L.L.C.35
Gap Widening Between GAAP and Adjusted Results
$60
$40
Net Income ($M)
$20
$0
-$20
1Q16 2Q16 3Q16 4Q16 1Q17 2Q17 3Q17 4Q17 1Q18 2Q18 3Q18 4Q18 1Q19
GAAP Net Income Adjusted Net Income
Source: Company reports
PHILADELPHIA FINANCIAL
35 of San Francisco, L.L.C.36
Roller Coaster Guidance
We are usually skeptical when a company projects accelerating trends.
Given all the industry headwinds we have cited thus far, we are even more skeptical of CATM’s
projected ramp in organic growth.
Total Company Organic Revenue Growth
- Excluding 7-Eleven & FX
1Q18 2Q18 3Q18 4Q18 1Q19 2Q19E 3Q19E 4Q19E 2020E
3% 1% -1% -1% 0% -1% 3% 4% 4%
6%
Organic Revenue
4%
Growth
2%
0%
-2%
1Q18 2Q18 3Q18 4Q18 1Q19 2Q19E 3Q19E 4Q19E 2020E
Source: Company reports
PHILADELPHIA FINANCIAL
36 of San Francisco, L.L.C.37
Refuting The Bull Case: Allpoint
CATM highlights the value of their surcharge free Allpoint network, particularly
highlighting the growth in Allpoint transactions. However, minimal financial
information is provided.
• Despite highlighting ‘almost 10%’ growth in surcharge free transactions (Allpoint) in 1Q19, total
domestic revenue growth was negative 2% in 1Q19.
• It is generally believed that Allpoint transactions are at a significantly lower price point than non-
Allpoint transactions. Thus, Allpoint volume may be cannibalizing higher priced surcharge
transactions.
• Allpoint either charges a fixed monthly fee per cardholder or a fixed fee per transaction, but the
mix between the two is not disclosed. The fixed monthly pricing mechanism is listed first, making
us suspect that is more common. Thus, revenue is not necessarily correlated with transactions.
• At the end of 1Q19, 20,000 ATMs were branded with 500 institutions offering surcharge-free
transactions, unchanged from 2017. Revenue from bank branding & surcharge free network
revenue only increased 3% in 1Q19 (negative 6% for all of 2018).
PHILADELPHIA FINANCIAL
37 of San Francisco, L.L.C.38
Refuting The Bull Case: Outsourcing
One positive argument is that as cash demands decline, banks are more likely to outsource to specialists like CATM.
We disagree:
• In Australia, ATM transactions are 35% below their peak, but CATM’s Australian managed services business is
contracting, not growing. Australian Managed services revenue declined 35% in 1Q19. It seems a shrinking
market is bad for all.
• In the UK, ATM transactions are 25% below their peak, but CATM does not even offer managed services in this
market.
• In the US, where Federal Reserve data shows transactions just starting to decline, managed services revenue
was down 2% in 1Q19.
• Managed services revenue today is less than 5% of total revenue. It does not appear material enough to us to
change the overall growth.
• Many ATMs are already outsourcing cash needs with Brink’s and servicing with NCR or Diebold. Further
outsourcing to CATM may not represent material savings.
• “We would never outsource our ATMs, that would be too much of a compliance risk.” – Bank of America
Executive
PHILADELPHIA FINANCIAL
38 of San Francisco, L.L.C.39
Refuting The Bull Case: Expanded Service
CATM is testing new ATM machines that accept check deposits. Most banks offer
mobile check deposit. We see little demand for these services and even less consumer
willingness to pay when there are so many more convenient and free alternatives.
Mobile: Testing ability to get ATM cash using a smart phone rather than a debit card.
In other words, this will do for the ATM what calling cards did for pay phones. Like the
calling card, we don’t see this saving the ATM.
Wells Fargo sells stamps at some ATMs, but demand is limited. We believe this shows
limited consumer interest in expanded ATM services.
PHILADELPHIA FINANCIAL
39 of San Francisco, L.L.C.40
Refuting The Bull Case: International Expansion
CATM is citing growth opportunities in Germany, Spain, and South Africa:
• Card payments in Germany surpassed cash payments for the first time in
2018.
A survey by EHI Retail Institute showed that last year, card payments made
up 48.6 percent of all retail sales, while cash payments made up 48.3
percent (source: pymnts.com).
• Cash in Spain is still the preferred in person payment. But, the ATM industry is
mature and in slight decline. ATM usage in Spain peaked in 2008 and has
generally declined since (latest data 4% below peak), according to a CATM
industry report.
PHILADELPHIA FINANCIAL
40 of San Francisco, L.L.C.41
Refuting Bull Case: Government Regulations
For every positive, we see at least one negative
• Several cities (Philadelphia, San Francisco, etc.) have banned
stores from not accepting cash. Some bulls point to these bans
as bullish for continued cash usage. We see it as a sign of
dwindling demand for cash.
• California has proposed a bill requiring e-receipts rather
than paper. We believe if this is passed, it forces all businesses
to accept electronic payments.
• Several states are proposing digital IDs. If enacted, consumers
will have one less reason to carry a physical wallet.
PHILADELPHIA FINANCIAL
41 of San Francisco, L.L.C.42
Earnings Beats Do Not Fix Fundamental Problems
• Ed West was promoted from CFO to CEO of Education Management Corp. in 2012
• Ed West was promoted from CFO to CEO of CATM in 2017
• In Mr. West’s first 6 quarters as CEO, Education Management rationalized expenses and
exceeded EBITDA estimates by 9% on average. Shares peaked over $16 in 2013.
• In Mr. West’s first 6 quarters, Cardtronics rationalized expenses and exceeded EBITDA
estimates by 15% on average.
• In the 7th quarter under Mr. West, Education Management reported only ‘in-line’ results.
Shares started trading below $1 in 4Q14 and have stayed below that level since.
• “As CEO of Education Management, Ed did a great job of rationalizing expenses, he just
didn’t have the ability to fix the revenue problem.” – Sell-side analyst covering Education
Management
PHILADELPHIA FINANCIAL
42 of San Francisco, L.L.C.43
Is CATM A Software Or Hardware Company?
Company Name: Ticker '20 P/E 5-Yr Return
Software: Fidelity National Info Serv FIS 15.6x 138.3%
Fleetcor Technologies Inc FLT 20.3x 123.4%
Global Payments Inc GPN 21.3x 347.9%
Total System Services Inc TSS 18.3x 230.9%
Wex Inc WEX 19.1x 125.9%
Software Median: 19.1x 138.3%
CATM Cardtronics Plc - A CATM 14.7x 7.4%
Hardware: Diebold Nixdorf Inc DBD 11.0x -69.5%
Ncr Corporation NCR 10.1x 1.7%
Hardware Median: 10.5x -33.9%
Source: Company reports, Bloomberg L.P.
PHILADELPHIA FINANCIAL
43 of San Francisco, L.L.C.44
High CapEx Relative to Peers
Makes EBITDA Metrics Less Relevant
Company Name: Ticker CapEx / EBITDA
Software: Fidelity National Info Serv FIS 19.9%
Fleetcor Technologies Inc FLT 8.4%
Global Payments Inc GPN 15.2%
Total System Services Inc TSS 17.7%
Wex Inc WEX 16.7%
Software Median: 16.7%
CATM Cardtronics Plc - A CATM 36.5%
Hardware: Diebold Nixdorf Inc DBD 17.7%
Ncr Corporation NCR 33.5%
Hardware Median: 25.6%
Source: Company reports
*Using 2018 PP&E and Capitalized Software / 2018 EBITDA
PHILADELPHIA FINANCIAL
44 of San Francisco, L.L.C.45
Disclosures
• No Investment Advice
• This article is not an offer to sell or the solicitation of an offer to buy any security in any jurisdiction where such an offer or
solicitation would be illegal. This article is distributed for informational purposes only and should not be construed as investment
advice or a recommendation to sell or buy any security or other investment, or undertake any investment strategy, nor does it
constitute any prediction of likely future movement in rates or prices or any representation that any such futures movements
will not exceed those shown in any illustration. It does not constitute a general or personal recommendation or take into
account the particular investment objectives, financial situations, or needs of individual investors. The price and value of
securities referred to in this article will fluctuate. Past performance is not a guide to future performance, future returns are not
guaranteed, and a loss of all of the original capital invested in a security discussed in this article may occur. Certain transactions,
including those involving futures, options, and other derivatives, give rise to substantial risk and are not suitable for all investors.
Projections and estimates presented in this presentation are subject to change without notice.
Note: Pricing as of May 21st, 2019.
PHILADELPHIA FINANCIAL
of San Francisco, L.L.C.
4546
Appendix: Revenue Declines Could Devastate Earnings
Given the Street forecasts $2.27 for 2020, we see several revenue decline scenarios wiping out all of earnings
UK AUS
Example Example
Revenue % Decline -10% -15% -20% -25% -30% -35%
Revenue Impact (132) (198) (264) (330) (396) (462)
Assumed Gross Margin* 40% 40% 40% 40% 40% 40%
EBITDA Impact (53) (79) (106) (132) (158) (185)
Per share Impact -$0.86 -$1.29 -$1.72 -$2.15 -$2.58 -$3.01
Source: Company reports
*Using the company's guidance from the 7-Eleven loss
PHILADELPHIA FINANCIAL
46 of San Francisco, L.L.C.47
Appendix: Concentrated Holders
Top 5 ~55%
Source: Bloomberg L.P.
PHILADELPHIA FINANCIAL
47 of San Francisco, L.L.C.48
Appendix: Mass Transit Rollouts
Boston: (Massachusets Bay Transportation): Limited rollout 2019
https://afc2.mbta.com/
New York MTA: Testing Now, Public rollout May 31, 2019
https://new.mta.info/system_modernization/omny
San Francisco (BART): Rolling out new mobile app
https://sf.curbed.com/2018/9/24/17897210/clipper-transit-card-
transportation-fare-system-payment-tech
Chicago Transit Authority: Live
https://www.ventrachicago.com/how-to/mobile-wallet-apps/
Washington, DC: Expects to be mobile ready in 2019
https://www.wmata.com/about/news/mobile-ready.cfm
PHILADELPHIA FINANCIAL
48 of San Francisco, L.L.C.You can also read