CASTROL INDIA LTD - MARKETSMOJO
←
→
Page content transcription
If your browser does not render page correctly, please read the page content below
Castrol India Ltd
November 06, 2018
Market Cap.                  52 Week H/L                         CMP                        Target Price
             Castrol India Ltd                                              Rs. 12,364 Cr                 Rs. 162/90                       Rs. 125                        Rs. 155
                                                     Personal Mobility to continue to drive the growth: The Management has been focused on ‘Personal Mobility’ segment which
              STOCK DATA
                                                     has been a key growth driver on account of huge traction in the two-wheelers and four-wheelers. Accordingly, the share of this
 Recommendation                             BUY      segment has increased from ~10% to ~45% driven by strong brand recognition, consistent increase in the realizations per litre
                                                     due to its B2C business model and higher blending cycles. Going forward, the company expects the segment to remain a key
 Reuters Code                CAST.BO
                                                     strategic priority as the rural segment of the country as it still offers a huge opportunity in the two-wheelers space. Additionally,
 Bloomberg Code              CSTRL IN
                                                     the drain intervals for passenger vehicles extend at a lower rate than commercial vehicles.
 BSE Code                     500870                 Strategic collaborations to aid growth in future: During previous year, the company joined hands with a global player, 3M to
 NSE Symbol              CASTROLIND                  bring a range of market leading vehicle care products in the Indian automotive after-market. This collaboration will enable the
 Face Value                      Rs. 5               company to offer 3M’s branded car and bike care products, such as shampoo, glass cleaners, cream wax, dashboard and tyre
 Shares                                              dressers, etc, across the country through its pan-India marketing & distribution network comprising of over 100,000
                               98.9 Cr
 Outstanding*                                        independent workshops & retail outlets.
 Avg. Daily                 20,21,471                Recent fall in crude prices to benefit the company to a great extent: A substantial portion of the base oils and additives that
 Volume (6m)                   shares                are used in manufacturing of lubricants are imported due to its shortage in the domestic market. Them being derivatives of
 Price Performance (%)                               crude oil exposes the company to not only price risk but also to forex risk. Oil price and gross margins of lubricant companies
                                                     are inversely related.
     1M          3M          6M
      33         (5)         (7)                                                                        OUTLOOK & VALUATION
         200 Days EMA Rs. 133
                                                       The lubricants industry has witnessed a huge transition from volume-to-value, yet, the Indian lubricants industry still
                                                       remains one of the fastest growing amongst the world. The leadership position of Castrol India, back-up by the robust
        * On fully diluted equity Shares
                                                       international parent, strong fundamentals and consistent technological advancements keeps the company best placed
        SHARE HOLDING (%)                              to benefit from the opportunity in Personal Mobility, Commercial Vehicles and Industrials segments. The company is
 Promoters                                 51.0        expanding capacities and the Management is confident of stable and steady growth over the next few years. However,
 FII                                       12.2        the unprecedented event of Covid-19 has brought the world to standstill and accordingly, we expect volumes to
                                                       witness steep fall during the current year only to register a good bounce back in the next year. Going forward, we
 FI/Bank                                   17.6
                                                       expect company to deliver an EPS of Rs.9.1 in CY 2022; assigning a target multiple of 17x, which is below its median
 Body Corporate                             1.2
                                                       P/E of last 1, 3 and 5 Years; we arrive at a target price of Rs.155 showcasing an upside potential of 24% from current
 Public & Others                           18.1
                                                       levels with an investment horizon of 18-24 months.
                         Revenue                  EBITDA           EBITDA             PAT             NPM              A-EPS          P/E            P/S             P/B
  Y/E Mar
                          (Rs. Cr)                (Rs. Cr)       Margin (%)         (Rs. Cr)           (%)             (Rs.)           (x)            (x)             (x)
 CY 2019                  3,876.8                 1,153.0           29.7%             827.4            21.3%              8.4              14.9               3.2              9.0
 CY 2020 E                3,163.5                  860.5            27.2%             623.8            19.7%              6.3              19.8               3.9              8.8
 CY 2021 E                3,728.9                 1,040.4           27.9%             762.3            20.4%              7.7              16.2               3.3              8.4
 CY 2022 E                4,322.6                 1,223.3           28.3%             902.4            20.9%              9.1              13.7               2.9              7.8

# Scrips part of Sushil’s Bonanza                                                                                                                                                   2
                                                                                                                                                                         April 24, 2020
Castrol India Ltd.

                                                             Company Overview

Castrol India, a step-down subsidiary (51%) of UK based BP Plc has an operating history of a hundred years in India now. It is one of the oldest and widely
known brands in the country. Though the new name ‘Castrol’ evolved in 1960 but this lubricant producer has been associated with the Indian
automotive industry soon after this industry started setting up its feet here. Today, the company is a leading lubricants company and has established
itself as a pioneer and innovator in the Indian lubricants industry.
The company operates 3 manufacturing facilities (Navi Mumbai, Silvassa, and Kolkata) and markets automotive, industrial, marine & energy lubricants,
distributed through more than 350 distributors from over 100,000 retail outlets. The company also leverages its distribution network to reach a wider
network through Castrol Bike Points, Castrol Car Care, Castrol Pit Stops, Castrol Authorized Service Associates and Independent workshops. Castrol sub-
distributors also reach additional outlets in rural markets whilst the company also directly services over 3,000 key institutional accounts. The company
has an inclusive and innovative outreach program to connect and engage with key consumers, customers and influencers.
Apart from its own production, the company also has third-party tie-ups to fill some of the products which they do not manufacture. In total, the
company has a capacity of 280 million litres across different segments. During 2019, the company produced and sold nearly 204 million litres of
lubricants and oils commanding a volume market share of ~18%. According to the Management, at the end of the calendar year, the capacity utilization
stood at ~80%. There were no significant exports by the company during the previous year barring some small quantities of its products were exported
to Malaysia, China, Thailand and Indonesia.
For the CY2019, the company reported a turnover of Rs.3,876.8 cr and an EBITDA of Rs.1,153.0 cr (EBITDA margin of 29.7%) and a net profit of Rs.827.4
cr translating into an EPS of Rs.8.37 per share. For the year, the dividend declared stood at Rs.5.50 per share (110% of FV of Rs.5)

 After quitting a job at Vacuum Oil in 1899, Charles Wakefield founded CC Wakefield & Company to start a new business of selling lubricants. His
 researchers found that adding a measure of castor oil resulted in oils that were runny enough to work from cold at start-up and thick enough to keep
 working at very high temperatures – much required for new engines for automobile and aero-planes. They called the new product ’Castrol’. By 1960,
 the name of the motor oil eclipsed the name of the company and the founder thereby, becoming, Castrol Ltd. In 1966, The Burmah Oil Company
 bought Castrol and in 2000 Burmah-Castrol was purchased by BP. During 2016, BP’s wholly owned subsidiary Castrol parted stake in Castrol India in
 two tranches of 11.5% in May and 8.5% in September bringing down its stake in the company to 51.0%. That time BP had divested some of its global
 assets amidst weak crude oil prices which negatively impacted its bottom line. In the first half of 2016, BP had globally divested assets worth USD 1.9
 bn, including the partial sale of its interest in Castrol India in May.

  April 24, 2020                                                                                                                                        3
Castrol India Ltd.
Business Overview
The products of the company help in reducing friction, and thus, noise and heat generated by metallic friction in engines and motors in the automotive
industry and cutting or honing parts in industrial applications. Additionally, detergents & dispersants in a lubricant help cleaning, while anti-wear agents
help protect the metal surface from wear and tear as well as corrosion. Automotive vehicles require engine oils, transmission fluids, brake fluids,
hydraulic oils & greases, while industrial & manufacturing applications require lubricants for metal working, rust preventives & coolants.
The lubricants are manufactured by blending base oils, either mineral-based or synthetic based oils and additives, with base oil being the primary
component. They are blended following advanced formulations as per the specifications based on purpose the lubricant serves. These formulations are
also customized as per the requirements of OEMs and the industry norms. With India being a net base-oil deficit market as well as many additives are
not available locally, base oils & additives are imported on a large scale, which exposes the lubricants business to fluctuations in foreign exchange rates.
As mentioned earlier, the company through its three manufacturing facilities and other arrangements holds a total capacity of 280 Mn litres across all
the segments. Further, the company is currently undergoing an expansion at its Silvassa plant. This investment program will increase the capacity of the
plant by 50% from 80 million litres to 120 million litres by 2021. This capex program of Rs.140 Cr spanned over two years would take the total capacity
to 320 million litres.
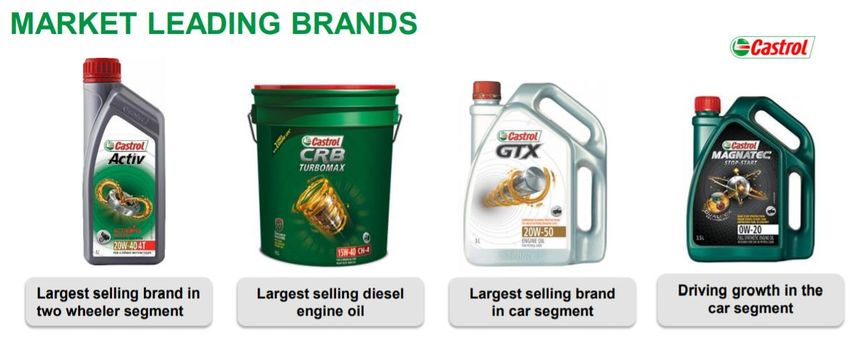
The company enjoys strong brand power amongst consumers and mechanics. Some of the company’s iconic brands are Castrol CRB, Castrol GTX, and in
more recent times power brands like Castrol Activ, Castrol MAGNATEC and Castrol VECTON.
Source: Investor Presentation, Company Data; Sushil Finance
April 24, 2020 4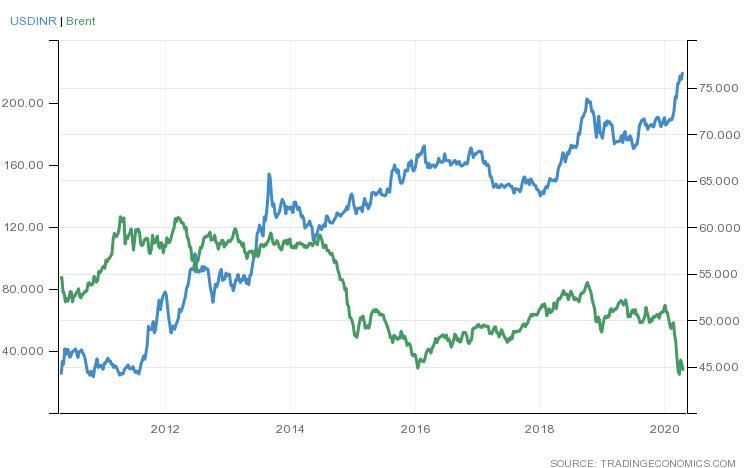
Castrol India Ltd.

                                                       Business Overview

Revenue Mix (2019) –Addressable Market                                  Revenue Mix (2019)- Product Wise

                           13%         12%
                                                                                                                             Personal Mobility
                                                       Industrials
                                                                                     43%                     45%             Industrials
                                                       Bazaar

                                                       B2B                                                                   CVO & Heavy
                                                                                                                             Duty
                                  75%                                                          12%

Volume Growth                                             (Mn litres)   Blended Realization/ litre                                           (INR)
 215.0                                        213.7                     195.0                                                        190.0
                                                                        190.0
 210.0                                                                                                              182.7
                                                                        185.0
                              204.6                     204.0
 205.0                                                                  180.0                        175.2
              199.3                                                     175.0
 200.0                                                                             169.1
                                                                        170.0
 195.0                                                                  165.0
                                                                        160.0
 190.0
                                                                        155.0
            CY 2016          CY 2017         CY 2018   CY 2019
                                                                                  CY 2016        CY 2017           CY 2018          CY 2019
Source: Company Data, Sushil Finance

 April 24, 2020                                                                                                                                  5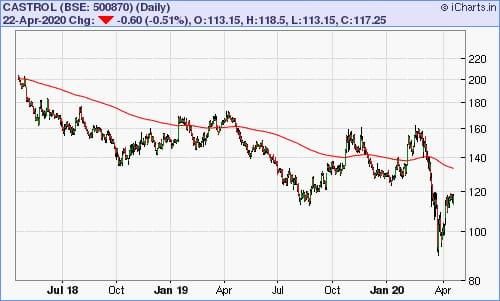
Castrol India Ltd.

                                                              Business Overview
Technology: The company has always been a pioneer in introduction of latest technologies in its product basket, thereby, recording several innovation in
its name. Castrol was the first company in the country to introduce a long-drain multi-grade engine oil approved by Maruti when it first launched its cars
in India. The company has always attempted to come up with longer drain products based on customer requirements. In the recent years, the company
had introduced a new premium product for its commercial vehicle segment, named, Castrol Vecton Long Drain. This diesel engine oil product claims to
deliver a 45% extra performance reserve that fights oil-breakdown by controlling oxidation, reducing deposits, and neutralizing harmful acids. This
means longer useful oil life, and thus substantially lower operating costs. Similarly, during 2018, the latest generation of Castrol Magnatec Stop-Start
engine oil with breakthrough Dualock technology was launched.
Branding: Apart from consistent technological up-gradations, the company focuses on branding and promotions. The company has consistently been
running television commercials, field-campaigns, and sponsorships. For the year ended December 31, 2018, the company had spent Rs.127.9 cr (3.3%)
on advertising as against Rs.112.7 cr (3.1%) in the previous year. In addition, the company also spent Rs.124.1 cr (3.2%) in 2018 as against Rs.124.6 cr
(3.5%) in 2017 on sales promotions. The numbers for 2019 were not available as the Annual Report for 2019 was not published till the time this report
was written. Going forward, the company is likely to increase this expenditure with an objective to gain market share, specially in the ‘Personal Mobility’
segment which faces stiff competition.
Royalty: The royalty to Castrol Ltd, UK is currently pegged at 3.5% of sales subject to maximum of 10% of the profits. During 2018, the company paid a
royalty of Rs.111.4 cr (2.9%) as against Rs.106.0 cr (3.0%) during the previous year.
Raw Material: A substantial chunk of the base oils and additives which are used in manufacturing of lubricants, being unavailable or deficit in the
country are imported. Most of these base-oils and additives are derivatives of crude oil and thus, the company is exposed not only to the prices of crude
oil but exchange rate well. The raw material comprises 45.1% of CY2019 sales as against 48.8% in CY2018 led by fall in crude prices & lower volumes.

                                                                 Key OEM Clientele

Source: Investor Presentation, Company Data; Sushil Finance
  April 24, 2020                                                                                                                                        6
Castrol India Ltd.
Business Overview
Revenue & Revenue Growth EBITDA & EBITDA Margin
4,500 10.0%
1400 35.0%
4,000 8.0%
3,500 1200 30.0%
6.0% 1000 25.0%
3,000
2,500 4.0% 800 20.0%
2,000 2.0% 600 15.0%
1,500
0.0% 400 10.0%
1,000
500 -2.0% 200 5.0%
- -4.0% 0 0.0%
2013 2014 2015 2016 2017 2018 2019 2013 2014 2015 2016 2017 2018 2019
Revenue (Rs. Cr) Growth EBITDA EBITDA %
Gross Margin Earnings & Dividend Per Share
60.0% 10.00
55.0%
8.00
8.37
50.0%
7.16
6.00
6.99
6.78
45.0%
6.22
5.14
40.0% 4.00
4.80
35.0%
2.00
3.50
3.75
4.50
5.50
4.75
5.00
5.50
30.0%
2013 2014 2015 2016 2017 2018 2019 -
2013 2014 2015 2016 2017 2018 2019
Gross Margin
EPS DPS
Source: Company Data, Sushil Finance
April 24, 2020 7Castrol India Ltd.
Industry Overview
India is the third largest lubricant market after the US and China. It is also one of the fastest growing lubricant markets worldwide. The total lubricants
market is comprised of three segments - automotive, industrial and process oils. According to the industry reports, the Indian lubricants sector is a 3
billion litres market with the automotive segment holding 42% share, industrial 23%, transformer and white oils 23%, process oils 8%, and greases 4%.
Of more than 20 players present in the industry, the three public sector undertakings namely BPCL, HPCL and IOC along with leading private sector
player Castrol commands nearly 55% market share. The international brands like Total, Shell, Mobil, Valvoline, Motul command another ~20% and the
remaining ~25% is with other domestic private players like Gulf Oil Lubricants India, Tide Water Oil, Savita Oil, etc. In value terms, the entire lubricants
industry is roughly valued at USD 6.5-7.0 bn i.e. roughly Rs.50,000 cr. According to industry reports, the lubricants industry in India is expected to grow
at an annual growth of 4-5% over the next few years.
During FY19, even though the lubricant market in the country recorded a positive growth but continued to witness stiff competition among players
leading to an overall shift in perception of lubricants market from volume driven to value driven. The major factors driving the growth of the market
are the increasing vehicular population along with the growing industrial sector. During the fiscal, the overall domestic vehicles sales grew at 5.1% YoY
to 2.62 cr units including 33.77 lakh Passenger Vehicles (+2.7%), 10.07 lakh Commercial Vehicles (+17.6%), 7.01 lakh Three Wheelers (+10.3%) and
211.81 lakh two-wheelers (+4.9%). On the industrial front, the India industrial lubricant market stood at USD 1.28 bn in 2017 and is projected to grow
steady at a middle single digit growth rate on account of initiatives being taken by the government towards infrastructure development and growing
focus of manufacturers on expanding their production capacities. With huge amount being planned to spent on upgrading infrastructure facilities
across the country and developing new ports and airports are anticipated to drive the industrial lubricant market in India over the next few years.
Global Volumes Indian Volumes
24% 16% CV
30% CV 30%
Industrial Industrial
Personal Mobility
45% 52% Personal Mobility
Source: MotorIndiaOnline
April 24, 2020 8Castrol India Ltd.
Industry Overview
Industry Structure – Market Share (FY19) Domestic Sales Trend in Indian Automobile Industry (Lakhs)
250
202 212
4%
13% 3% 200 176
160 165
148
150
100
80%
50 25 26 28 30 33 34
6 5 6 5 7 5 7 5 9 6 10 7
-
FY14 FY15 FY16 FY17 FY18 FY19
Passenger Vehicles Commercial Vehicles Passenger Vehicles Commercial Vehicles
Three Wheelers Two Wheelers Three Wheelers Two Wheelers
Volume Growth in Indian Domestic Sales Export Trend (Lakhs)
30.0% 100%
80%
20.0% 21 25 25 23 28 33
60%
10.0% 40%
4 4 4 3 4
20% 1 1 1 1 1 6
0.0% 1
6 6 7 8 7 7
FY15 FY16 FY17 FY18 FY19 0%
FY14 FY15 FY16 FY17 FY18 FY19
-10.0%
Passenger Vehicles Commercial Vehicles Three Wheelers Passenger Vehicles Commercial Vehicles
Two Wheelers Total Three Wheelers Two Wheelers
Source: SIAM, Sushil Finance
April 24, 2020 9Castrol India Ltd.
Investment Rationale
Personal Mobility to continue to drive the growth: Over the last 10-15 years, the Management has been focused
on ‘Personal Mobility’ segment which has been a key growth driver on account of huge traction in the 2Ws & 4Ws. “With multiple opportunities in
Accordingly, the share of this segment has increased from ~10% to ~45% driven by strong brand recognition, personal mobility driven by
consistent increase in the realizations/litre due to its B2C business model & higher blending cycles. Going forward, increase in first time users,
the company expects the segment to remain a key strategic priority as the rural segment of the country as it still growing number of women
offers a huge opportunity in the two-wheelers space. Additionally, the drain intervals for passenger vehicles extend riders, as well as a continuing
at a lower rate than commercial vehicles. With multiple opportunities in personal mobility driven by increase in shift towards higher quality
first time users, growing number of women riders, as well as a continuing shift towards higher quality formulations formulations and lighter viscosity
and lighter viscosity grades, the company is well placed to tap this potential. The consistent investments in grades, Castrol India is well
branding and promotions is likely to drive sales & realizations resulting into top-line growth and margin expansion placed to tap this potential.”
with rising contribution. Additionally, the customized offerings of value-added packs and wider distribution reach
have also contributed to this growth. Personal mobility has been posting consistent & steady growth, thereby,
improving the product-mix and also making up for low growth in other segments like Industrials, CVO & Heavy
Duty. Further, according to Management Interview as given to MotorIndia, the contribution of personal mobility
segment is 24% globally & 16% in India also showcases the growth potential.
Strategic collaborations to aid growth in future: During previous year, the company joined hands with another
global player, 3M to bring a range of market leading vehicle care products to the Indian automotive after-market. “Through this collaboration, we
The company has collaborated with 3M India to offer the latter’s branded car and bike care products such as enter into the $200 mn vehicle
shampoo, glass cleaners, cream wax, dashboard and tyre dressers, etc. across the country through its pan-India care market in India, a move
marketing & distribution network of over 100,000 independent workshops & retail outlets. The Management which aligns with Castrol's
stated that the size of Indian vehicle care market is estimated to be around USD 200 mn (Rs.1,400-1,500 cr) and is approach to developing and
rapidly growing. Moreover, the company has tie-ups with OEMs for supply of original oils & endorsements. embracing new business models
Recently, the company had signed a strategic partnership with Renault India for supply of exclusive after- in the ever-evolving automotive
sales engine oil lubricants across it's pan-India network. Castrol India gets advantage from exclusive tie-ups with landscape,"
OEMs due to global tie-ups of auto companies with BP Plc. Furthermore, the company’s marketing endeavors also ------- Castrol India
likely to strengthen company’s business. For instance, the company had announced Castrol FastScan, a digital
incentive platform for key stakeholders including mechanics and retailers. It helps retailers/mechanics to earn,
track & redeem rewards, and receive them instantly in their bank account using IMPS, leading to significant
simplification and shortening of the incentive payment cycle from months to minutes.
April 24, 2020 10Castrol India Ltd.
Investment Rationale
Timely technological advancements continue to be a strength: As mentioned earlier, the company has been a
“Castrol has already developed a
pioneer in the lubricants industry and has registered several firsts in its name. The company has always been
proactive in matching the pace with the technological advancements changing the automotive world. The company wide range of EV fluids for
benefits from the technological and scientific expertise from BP Plc, which works through its 7 global R&D centers international markets and these
fluids will be available to Castrol
in the US, UK, Germany, China, & Japan. For instance, the company became the first Indian player to have a
India”
complete range of BS-VI compliant portfolio which is also backward compatible as this would be phased evolution
over the next few years. From a practical perspective, the BS-IV to BS-VI leap has resulted into the need of
lubricants compatible with the new after-treatment devices being adopted by OEMs, as well as the ability to
handle more stress as a result of internal emissions control technology. This means new products specially
formulated with lower sulphated ash and phosphorous while maintaining the same durability. Similarly, on electric
vehicle front, although the company believes that EV adoption will be faster but conventional internal combustion
engines are likely to co-exist, as well, for a long-time – rather the Management expects internal combustion
engines to still dominate for decade to come and grow substantially over the next decade. Nevertheless, Castrol,
globally, has already developed a wide range of EV fluids including transmission fluids, battery coolants and greases
which would be available to Castrol India proving to be a great benefit.
Robust fundamentals, strong leadership & wider reach to benefit: Castrol India is a debt free company with
As on December 31, 2019, Castrol
strong cash generation. The robust business model coupled with brand image results into strong realizations and
India is a zero-debt company and
stable profitability. The company generates healthy operating cash flows to the tune of Rs.550-650 cr annually and
holds cash and cash equivalents
most of which flows towards the dividends payout. The company has been kind in issuing bonuses as well; over the
of Rs.946.1 cr. Additionally, the
past thirty years the company has issued 8 bonuses comprising 98% of its current equity. Furthermore, as on
strong operating cash-flows flow
December 31, 2019, this zero-debt balance sheet holds cash and cash equivalents of Rs.946.1 cr translating into
to dividend payouts.
Cash Per Share of Rs.9.57. Apart from being a financially strong company, the company also enjoys benefits of
having an internationally strong parent which consistently helps the company with research and technology.
Furthermore, the company has strong distribution network of more than 350 distributors from over 100,000 retail
outlets. The company also leverages its distribution network to reach a wider network through Castrol Bike Points,
Castrol Car Care, Castrol Pit Stops, Castrol Authorized Service Associates and Independent workshops. The
premium quality, consistent branding and promotional campaigns and regular workshops and reward programs for
mechanics and garages helps the company to retain this market share. Going forward, the company is well
positioned to give away some of its margins to gain market share.
April 24, 2020 11Castrol India Ltd.
Investment Rationale
Recent fall in crude prices to benefit the company to a great extent: As mentioned earlier, a substantial chunk of
the base oils and additives which are used in manufacturing of lubricants, being unavailable or deficit in the
country are imported. Most of these base-oils and additives are derivatives of crude oil and thus, the company is
exposed not only to the prices of crude oil but exchange rate well. When oil prices decline the lubricant
companies gross margins/litre goes up. During the recent past, the crude oil prices witnessed a steep fall
nevertheless, the Indian Rupee has further weakened as well (showcased in the chart on the right side). Thus,
the margin expansion on account of substantially lower crude oil and its derivates would be partially offset by the
weak INR against USD. If base oil prices soften further or sustain at present level, it may lead to further gross
margin expansion. In any case, the gross margins are not likely to go up. Over the past decade, the change in
product-mix, technological advancements and decrease in crude oil prices led to increase in gross margins from Major fall was witnessed during
41.5% in CY 2012 to 54.9% in CY 2019. Since last one year, the Brent crude feel from ~$75/Bbl in April, 2019 to the past one month when the
~$25/Bbl in April, 2020. More importantly, the major fall was witnessed during the past one month when the price of Brent crude halved from
price of Brent crude halved from $56/Bbl in the mid of February, 2020 to $28/Bbl in mid of April, 2020. $56/Bbl in the mid of February
Brent vs USD INR Raw Material Cost, as a percentage of Revenue
70.0%
60.0%
50.0%
40.0%
30.0%
20.0% 58.5%
56.2%
57.1%
48.5%
45.4%
46.5%
48.8%
45.1%
10.0%
0.0%
2012 2013 2014 2015 2016 2017 2018 2019
Source: Trading Economics, Company Data, Sushil Finance
April 24, 2020 12Castrol India Ltd.
Peer Comparison
Sales EBITDA Net D/E CMP* 52 Week Mkt Cap Enterprise P/E P/S P/B EV/
(Rs. Cr) Margin Margin (x) (Rs.) H/L (Rs.) (Rs. Cr) Value (x) (x) (x) EBITDA
(%) (%) (Rs. Cr) (x)
Castrol India 3,877 29.7% 21.3% - 125 162/90 12,364 11,418 14.9 3.2 9.0 9.9
Gulf Oil Lubricants 1,720 17.8% 12.5% 0.47x 586 910/450 2,784 2,709 13.0 1.7 4.2 9.1
(India)
Tide Water Oil 1,375 10.8% 9.2% 0.05x 3,494 5,300/2,550 1,210 1,561 9.6 0.9 1.8 7.2
(India)
Source: Sushil Finance
Outlook & Valuation
Over the last decade, the lubricants industry has witnessed a huge transition from volume-
to-value, yet, the Indian lubricants industry still remains one of the fastest growing amongst
the world. The leadership position of Castrol India, robust back-up by the parent, strong
fundamentals and consistent technological advancements keeps the company best placed
to benefit from the opportunity in growth in Personal Mobility, Commercial Vehicles and
Industrials segments. The company is expanding capacities and the Management is
confident of stable and steady growth over the next few years. However, the
unprecedented event of Covid-19 has brought the world to standstill and accordingly, we
expect volumes to witness steep fall during the current year only to register a good bounce
back in the next year. Going forward, we expect company to deliver an EPS of Rs.9.1 in
CY2022; assigning a target multiple of 17x, which is below its median P/E of last 1 year, 3
Years and 5 Years, we arrive at a target price of Rs.155 showcasing an upside potential of
24% from current levels with an investment horizon of 18-24 months.
April 24, 2020 13Castrol India Ltd.
PROFIT & LOSS STATEMENT (Rs.Cr) BALANCE SHEET STATEMENT (Rs.Cr)
Y/E Mar. CY19 CY20E CY21E CY22E As on 31st Mar. CY19 CY20E CY21E CY22E
P,P&E (including WIP) 224.7 236.0 251.3 298.1
Revenue 3,876.9 3,163.5 3,728.9 4,322.6
Other Intangibles 2.3 1.6 1.6 1.6
Raw material cost 1,747.7 1,423.6 1,678.0 1,945.2
Other Non-current Assets 166.3 169.3 169.3 169.3
Employee cost 213.1 215.1 227.5 246.5
Inventories 304.7 253.5 298.8 346.4
Other Expenses 763.0 664.3 783.1 907.7 Trade Receivables 482.0 346.7 408.7 473.7
EBITDA 1,153.0 860.5 1,040.4 1,223.3 Cash & Bank Balances 946.1 964.3 1,008.7 1,061.5
Other Financial Assets 24.0 23.5 23.5 23.5
Depreciation 69.7 74.2 77.9 82.9
Other Current Assets 78.7 63.3 74.6 86.5
EBIT 1,083.3 786.3 962.5 1,140.4
Total Assets 2,228.8 2,058.2 2,236.1 2,460.5
Finance Costs 1.2 2.0 2.0 2.0
Equity Share Capital 494.6 494.6 494.6 494.6
Other Income 64.8 47.5 55.9 64.8 Reserves & Surplus 872.4 902.8 972.2 1,083.8
PBT 1,146.9 831.8 1,016.4 1,203.2 Provisions 21.4 15.9 15.9 15.9
Tax Expense 319.5 207.9 254.1 300.8 Other non-current - - - -
Borrowings (ST) - - - -
Adjusted Net Profit 827.4 623.8 762.3 902.4
Trade Payables 471.8 351.0 413.8 479.6
EPS 8.37 6.31 7.71 9.12
Other Financial Lia 241.2 189.8 223.7 259.4
CEPS 9.07 7.06 8.49 9.96 Other current liabilities 127.4 104.1 115.4 127.3
DPS-Not Required 5.50 6.00 7.00 8.00 Total Liabilities 2,228.8 2,058.2 2,236.1 2,460.5
Source: Company, Sushil Finance Research Estimates
April 24, 2020 14Castrol India Ltd.
CASH FLOW STATEMENT (Rs.Cr) FINANCIAL RATIO STATEMENT
Y/E Mar. CY19 CY20E CY21E CY22E Y/E Mar. CY19 CY20E CY21E CY22E
PBT 1,146.9 831.8 1,016.4 1,203.2 Growth (%)
Revenue (0.7) (18.4) 17.9 15.9
Depreciation & Amortization 69.7 74.2 77.9 82.9
EBITDA 7.7 (25.4) 20.9 17.6
Finance Cost 1.2 2.0 2.0 2.0 16.8 (24.6) 22.2 18.4
Net Profit
Chg. in Inventories 152.1 51.2 (45.3) (47.6) Profitability (%)
Chg. In Receivables (90.2) 135.3 (62.0) (65.1) EBIDTA Margin (%) 29.7 27.2 27.9 28.3
Net Profit Margin (%) 21.3 19.7 20.4 20.9
Chg. In Payables (112.3) (120.8) 62.7 65.9
ROCE (%) 79.2 56.3 65.6 72.2
Other Changes in WK - - - - 60.5 44.6 52.0 57.2
ROE (%)
Net Operating Cash Flow 1,167.4 973.6 1,051.8 1,241.4 Per Share Data (Rs.)
Capex (75.0) (85.4) (93.2) (129.7) A-EPS (Rs.) 8.4 6.3 7.7 9.1
CEPS (Rs.) 9.1 7.1 8.5 10.0
Change in current invest (10.2) - - -
BVPS (Rs) 13.8 14.1 14.8 16.0
Others 1.0 (0.7) 0.7 - Valuation
Cash Flow from Investing (85.8) (84.8) (93.2) (129.7) PER (x) 14.9 19.8 16.2 13.7
P/BV (x) 9.0 8.8 8.4 7.8
Change in Others (879.4) (870.6) (914.6) (1,058.5) 9.9 13.3 11.0 9.3
EV/EBITDA (x)
Change in Borrowings - - - - P/ Sales (x) 3.2 3.9 3.3 2.9
Turnover
Cash Flow from Financing (879.4) (870.6) (914.6) (1,058.5)
Inventory Days 64 65 65 65
Opening Cash 743.9 946.1 964.3 1,008.3 Debtor Days 45 40 40 40
Creditors Days 99 90 90 90
Cashflow during the year 202.2 18.2 44.0 53.2
Gearing Ratio
Cash at the End of the Year 946.1 964.3 1,008.3 1,061.5 D/E - - - -
Source: Company, Sushil Finance
April 24, 2020 15Research Analyst Sales:
Saurabh Jain | +91 22 4093 4004 Devang Shah | +91 22 4093 6060/62
saurabh.jain@sushilfinance.com devang.shah@sushilfinance.com
Rating Scale
This is a guide to the rating system used by our Institutional Research Team. Our rating system comprises of six rating categories, with a corresponding risk rating.
Risk Rating
Risk Description Predictability of Earnings / Dividends; Price Volatility
Low Risk High predictability / Low volatility
Medium Risk Moderate predictability / volatility
High Risk Low predictability / High volatility
Total Expected Return Matrix
Rating Low Risk Medium Risk High Risk
Buy Over 15 % Over 20% Over 25%
Accumulate 10 % to 15 % 15% to 20% 20% to 25%
Hold 0% to 10 % 0% to 15% 0% to 20%
Sell Negative Returns Negative Returns Negative Returns
Neutral Not Applicable Not Applicable Not Applicable
Not Rated Not Applicable Not Applicable Not Applicable
Please Note
• Recommendations with “Neutral” Rating imply reversal of our earlier opinion (i.e. Book Profits / Losses).
• ** Indicates that the stock is illiquid With a view to combat the higher acquisition cost for illiquid stocks, we have enhanced our return criteria for such stocks by five
percentage points.
• Stock Review Reports: These are Soft coverage’s on companies where Management access is difficult. Views and recommendation on such companies may not
necessarily be based on management meeting but may be based on the publicly available information and/or attending Company AGMs. Hence Stock Reviews may be
just one-time coverage’s with an occasional Update, wherever possible.
…
Sushil Financial Services Private Limited
Regd. Office : 12, Homji Street, Fort, Mumbai 400 001.
Phone: +91 22 40936000 Fax: +91 22 22665758
Email : info@sushilfinance.com
16Disclaimer & Disclosures :
https://www.sushilfinance.com/Disclamier/research
Member : BSE / NSE - SEBI Regn. No. INZ000165135
Research Analyst – SEBI Registration No. INH000000867
http://goo.gl/1sOHeV
This report has been furnished to you for your general information only and should not be reproduced, re-circulated, published in any media, website or otherwise, in any form or manner, in
part or as a whole, without the express consent in writing of Sushil Financial Services Private Limited. This Research Report is meant solely for use by the original recipient to whom it is sent and
is not for circulation. Any unauthorized use, disclosure or public dissemination or copying of information (either whole or partial) contained herein is prohibited.
This Report does not constitute a personal recommendation or take into account the particular investment objectives, financial situations, or needs of individual clients. The recommendations,
if any, made herein are expression of views and/or opinions and should not be deemed or construed to be neither advice/offer for the purpose of purchase or sale of any securities mentioned
herein. Past performance is not a guide for future performance, future returns are not guaranteed. Opinions expressed herein are subject to change without notice. Investor should rely on
information/data arising out of their own investigations. Investors are advised to seek independent professional advice and arrive at an informed trading/investment decision before executing
any trades or making any investments. The price and value of the investments referred to in this material and the income from them may go down as well as up, and investor may realize losses
on any investments. This Report has been prepared on the basis of publicly available information, internally developed data and other sources believed by us to be reliable. A graph of daily
closing prices of securities is available at www.nseindia.com, www.bseindia.com. Research Analyst views on Subject Company may vary based on Fundamental and Technical Research. Sushil
Financial Services Private Limited or its directors, employees, affiliates or representatives do not assume any responsibility for, or warrant the accuracy, completeness, adequacy and reliability
of such information / opinions / views. None of the directors, employees, affiliates or representatives of company shall be liable for any direct, indirect, special, incidental, consequential,
punitive or exemplary damages/loss etc whatsoever from the information/opinions/views contained in this Report and investors are requested to use the information contained at their risk.
Sushil Financial Services Private Limited (SFSPL) and its connected companies, and their respective Directors, Officers and employees or their relative, may have a long or short position in the
subject companies mentioned in the report and it may not be construed as potential conflict of interest with respect to any recommendation and related information and opinions. Reports
based on technical and derivative analysis center on studying charts company’s price movement, outstanding positions and trading volume, as opposed to focusing on a company’s
fundamentals and, as such, may not match with a report on a company’s fundamental analysis. SFPSL has different business segments/Divisions with independent research and maintains arm’s
length distance catering to different set of customers having various objectives, risk profiles, investment horizon, etc. and therefore may at times have different contrary views on stocks sector
and markets. Research Report may differ between SFSPL’s RAs on account of differences in research methodology, personal judgment and difference in time horizons for which
recommendations are made. User should keep this risk in mind and not hold - SFSPL, its employees and associates responsible for any losses, damages of any type whatsoever.
This report is not intended to be a complete statement or summary of the securities, market or developments referred to in this document. SFSPL or its affiliates or employees are under no
obligation to update the information. SFSPL or its affiliates or employees shall not be in any way responsible and liable for any loss or damage that may arise to any person from any inadvertent
error in the information contained in this report.
SFSPL or its affiliates and/or its employees/its associates or his relative does not have financial interest in the subject companies. SFSPL or its affiliates and/ or its employees/its associates or his
relative may or may not have beneficial ownership of one per cent or more securities of the subject company, at the end of the month immediately preceding the date of publication of the
research report. SFSPL/its Associates/ Research Analyst have not received any compensation from the subject company in the past twelve months. Further the subject company is/was not a
client during twelve months preceding the date of distribution of the research report and the types of services provided. SFSPL or its research analyst has not served as an officer, director or
employee of the subject company. SFSPL or its affiliates and/or its research analysts have not been engaged in market making activity for the subject company.
SFSPL or its associates or its Research Analyst have not received any compensation or other benefits from the subject companies or third party in connection with the research report. SFSPL/its
Associates/ Research Analyst/ his Relatives not have any other material conflict of interest at the time of publication of the research report.
SFSPL/its Associates/ Research Analyst/ his Relatives have not managed or co-managed public offering of securities, have not received compensation for investment banking or merchant
banking or brokerage services, have not received any compensation for product or services other than investment banking or merchant banking or brokerage services from the subject
companies in the last twelve months.
There are no material disciplinary action that been taken by any regulatory authority impacting equity research analysis activities.
17You can also read