Causes and Predictability of the 2011-14 California Drought
←
→
Page content transcription
If your browser does not render page correctly, please read the page content below
ASSESSMENT REPORT

Causes and Predictability
         of the 2011-14
     California Drought

                                               RICHARD SEAGER
          Lamont Doherty Earth Observatory of Columbia University

                                            MARTIN HOERLING
                           NOAA Earth System Research Laboratory

                                         SIEGFRIED SCHUBERT
                                                 HAILAN WANG
                                 NASA Goddard Space Flight Center

                                                  BRADFIELD LYON,
             International Research Institute for Climate and Society

                                                   ARUN KUMAR
                                    NOAA Climate Prediction Center

                                         JENNIFER NAKAMURA
                                           NAOMI HENDERSON
          Lamont Doherty Earth Observatory of Columbia University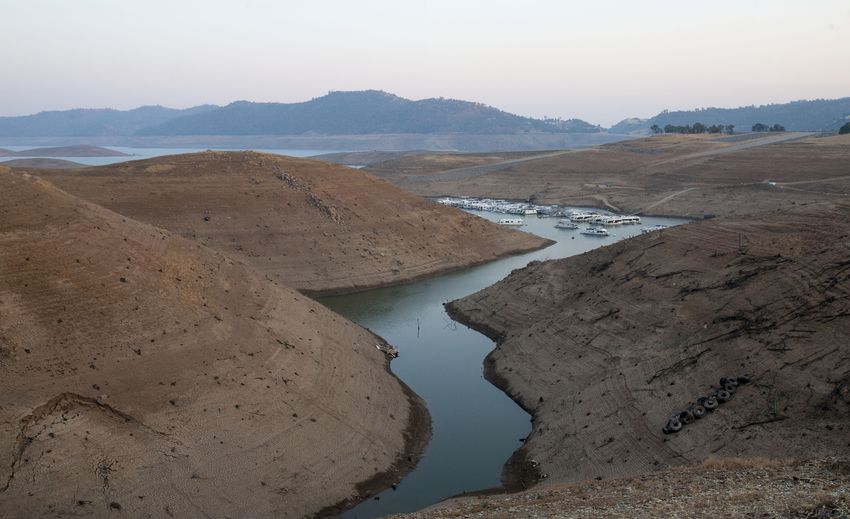
Corresponding author address:                                        Photo: New Melones Lake boat mooring, showing previous high water marks. August 2014
Richard Seager, Lamont Doherty Earth Observatory of Columbia
University, 61 Route 9W., Palisades, NY 10964.
Email: seager@ldeo.columbia.edu
                                                                     Table of Contents
For a downloadable pdf of this report, go to:
http://cpo.noaa.gov/MAPP/californiadroughtreport                     Abstract                                                                         3
Acknowledgments                                                      1. Introduction                                                                  3
This work was performed as part the NOAA Drought Task                2. Observational data and model simulations                                      6
Force organized by the NOAA Modeling, Analysis, Predictions
and Projections Program (MAPP) of the Office of Oceanic and
Atmospheric Research/Climate Program Office in partnership
                                                                     3. Atmosphere-ocean conditions during the 2011 to 2014 winters
with the National Integrated Drought Information System                                                                           8
(NIDIS). We thank MAPP Program Managers Annarita Mariotti
and Dan Barrie for their encouragement, motivation and               4. The multimodel mean SST-forced simulation of the last three
support.                                                             winters                                                        10
Dr. Seager was supported by NOAA awards
NA10OAR4310137(Global Decadal Hydroclimate Variability and           5. The ocean, atmosphere and precipitation states associated with
Change) and NA14OAR4310232 and NSF awards AGS-1401400
and AGS-1243204. The MAPP Program provided financial
                                                                     all-California dry and wet winters in observations and SST-forced
support for several of the authors of this report. Research grants   models                                                          10
NA14OAR4310221 and NA12OAR4310088 constitute some of
that support.                                                        6. Model simulation of the 2011-12 to 2013-14 winters                           14
We thank Haibo Liu for assembling the CMIP5 data for analysis.
                                                                     7. On the role of SST anomalies in causing the California drought
Thanks to our reviewers: Tom Delworth (NOAA GFDL), Kelly
Redmond (Desert Research Institute), Dan Cayan (University of
                                                                     of the last three years                                         21
California, San Diego), and one additional anonymous reviewer.
                                                                     8. How well can the history of California winter precipitation be
Photos by Andrew Williams, andrew@awilliamsmedia.com                 reproduced by SST-forced models?                                 23
Publication design team:
Kathleen Bogan, kathleen.bogan@noaa.gov                              9. Assessing long-term climate change contribution to the 2011-
Barb DeLuisi, barb.deluisi@noaa.gov                                  14 California drought                                        25
                                                                     10. Implications for the upcoming winter of 2014/15                             27
                                                                     11. Conclusions and discussion                                                  29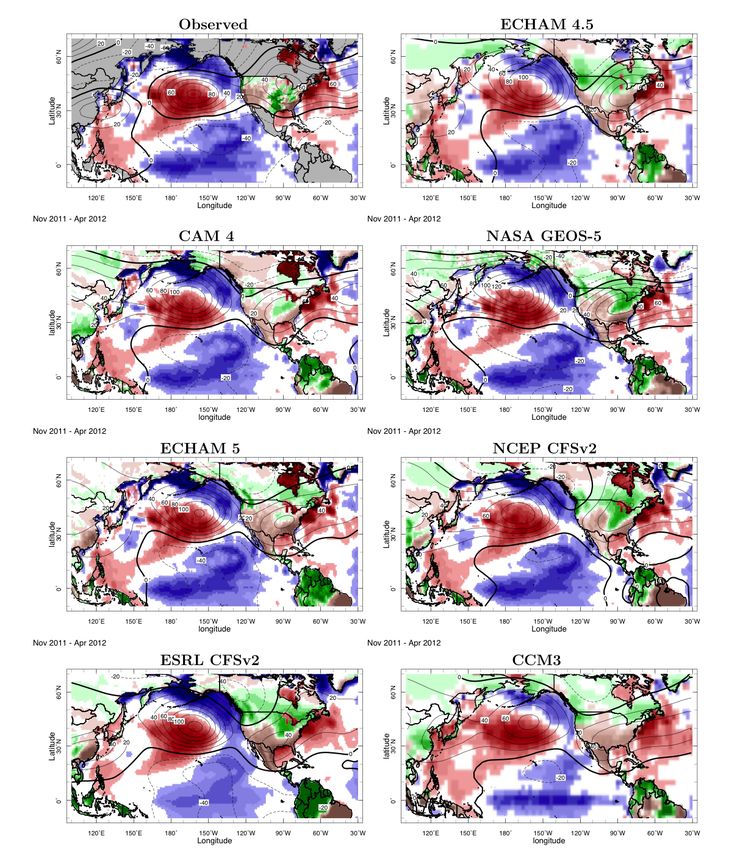
C A U S E S A N D P R E D I C TA B I L I T Y O F T H E 2 0 1 1 - 1 4 C A L I F O R N I A D R O U G H T

                                                                                                                     3
    ABSTRACT         The causes and predictability of the California drought during the three consecu-
                  tive rainy seasons (November-April) 2011/12 to 2013/14 are analyzed using observa-
                  tions and ensembles of simulations conducted with seven atmosphere models forced
                  by observed sea surface temperatures (SSTs). Historically, dry California winters have
                  most commonly been associated with a ridge off the west coast, part of a mid-latitude
                  wave train having no obvious SST forcing. Wet winters have most commonly been as-
                  sociated with a trough off the west coast and an El Niño event. These attributes of dry
                  and wet winters are captured by many of the models used in the current assessment.
                  According to the models, up to a third of California winter precipitation variance
                  can be explained in terms of SST forcing, with the majority explained by internal
                  atmospheric variability. Nonetheless. SST-forcing was key to sustaining a ridge of
                  high pressure over the west coast during each of the last three winters, and may have
                  explained nearly one-third the CA precipitation deficits during the recent drought. In
                  2011/12 the forced component was a response to a La Niña event whereas in 2012/13
                  and 2013/14 it was related to a warm tropical west Pacific SST anomaly. All mod-
                  els contain a mode of climate variability that links west Pacific SST anomalies to a
                  northeastward propagating wave train with a ridge off the North American west coast
                  as part of its SST sensitivity during at least the last 35 years. This mode explains less
                  variance than ENSO and Pacific decadal variability and its importance in 2012/13 and
                  2013/14 was unusual. The CMIP5 models project that rising greenhouse gases should
                  increase California winter precipitation but that changes to date are small compared
                  to the recent drought anomalies. As such, the recent drought was dominated by
                  natural variability, a conclusion framed by a discussion of the differences between
                  observed and modeled tropical SST trends over the past decades.

1. Introduction      The November through April winter precipitation season in 2013/14 was, accord-
                  ing to National Oceanic and Atmospheric Administration Climate Division Data, the
                  sixth driest for the state of California as a whole that has occurred since records begin
                  in 1895. The previous two winter precipitation seasons were also dry and the same
                  data show that the 2011/14 three year average precipitation for California was the
                  second driest that has occurred since 1895 (Figure 1, page 4). The past winter, coming
                  as the third year of a major drought, has left California water resources in a severely
                  depleted state. In April 2014 Governor Jerry Brown issued the second emergency
                  drought proclamation in two months. In November 2014, according to the Califor-
                  nia Department of Water Resources (http://cdec.water.ca.gov/cgi-progs/reservoirs/
                  STORAGE), statewide water storage was about 56% of average for the time of year.
                  The impacts of lack of precipitation were exacerbated by warm temperatures with
                  November-April 2013/14 being the warmest winter half-year on record. Warming in-
                  creases evaporative loss, raises water demand and reduces snow pack. California is the
                  nation’s leading agricultural producer and one of the major agricultural regions of the
                  world. Reductions in precipitation and water available for irrigation are being largely
                  offset by increased groundwater pumping, an unsustainable situation at least in the
                  southern Central Valley (e.g. Scanlon et al. (2012); see also Famiglietti and Rodell
                  2013, Amos et al. 2014, Borsa et al. 2014) and, though food prices are not expected
                  to rise, the last year of drought has cost California $2.2 billion in damages and 17,000
                  agricultural jobs (Howitt et al. 2014).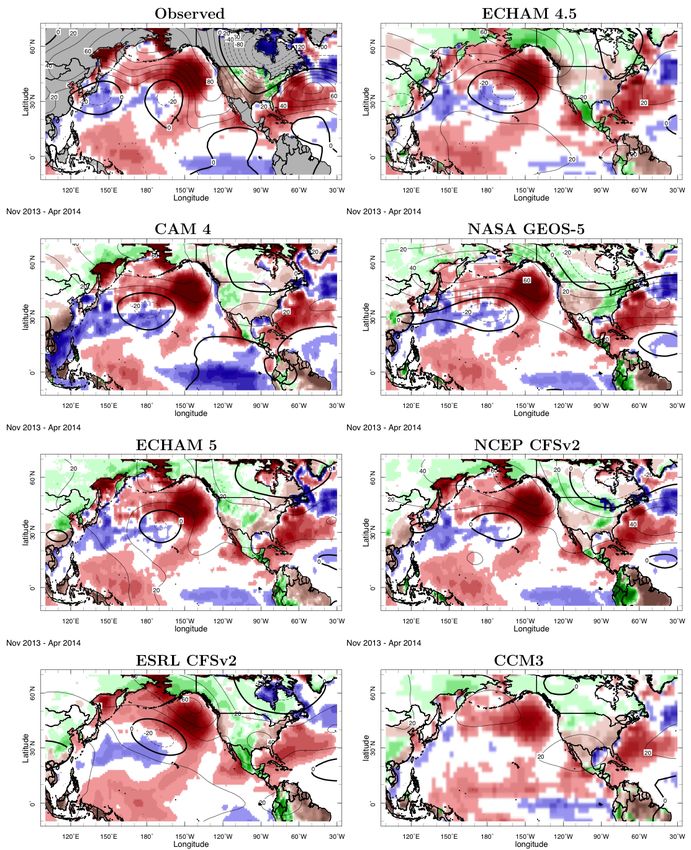
C A U S E S A N D P R E D I C TA B I L I T Y O F T H E 2 0 1 1 - 1 4 C A L I F O R N I A D R O U G H T

4
                1. I N T R O D U C T I O N

                        FIGURE 1
  California Winter Climate
      division Precipitation
       Histograms of one-year (top) and
     three-year average (bottom) winter
  all-California precipitation for 1895-96
to 2013-14 from NOAA Climate Division
 data. The last three years are marked in
   the top panel and the last three-year
average is marked in the bottom panel.

                                                  The ongoing California drought lies within a larger scale context whereby, at any
                                               one time, drought has been afflicting much of southwestern North America since
                                               the end of the 1990s (Seager 2007; Weiss et al. 2009; Hoerling et al. 2010; Cayan et al.
                                               2010; Seager and Vecchi 2010; Seager and Hoerling 2014) and shortly after a devas-
                                               tating one-year drought struck the Great Plains and Midwest (Hoerling et al. 2014).
                                               Concern for the future of southwestern water is only intensified by projections from
                                               climate models. These indicate that, for much of southwest North America (including
                                               southern but not northern California), a combination of declining winter precipi-
                                               tation and rising temperatures will reduce water availability in coming decades as a
                                               consequence of rising greenhouse gases (Seager et al. 2007, 2013; Maloney et al. 2014;
                                               Vanos et al. 2014). During the last winter’s drought there was much discussion, up to
                                               the level of the President, as to whether it was caused or made worse by human-driv-
                                               en climate change.
                                                  Three recent short papers examined the potential role for climate change in the
                                               California drought of the last two winters. The comparison of these three studies,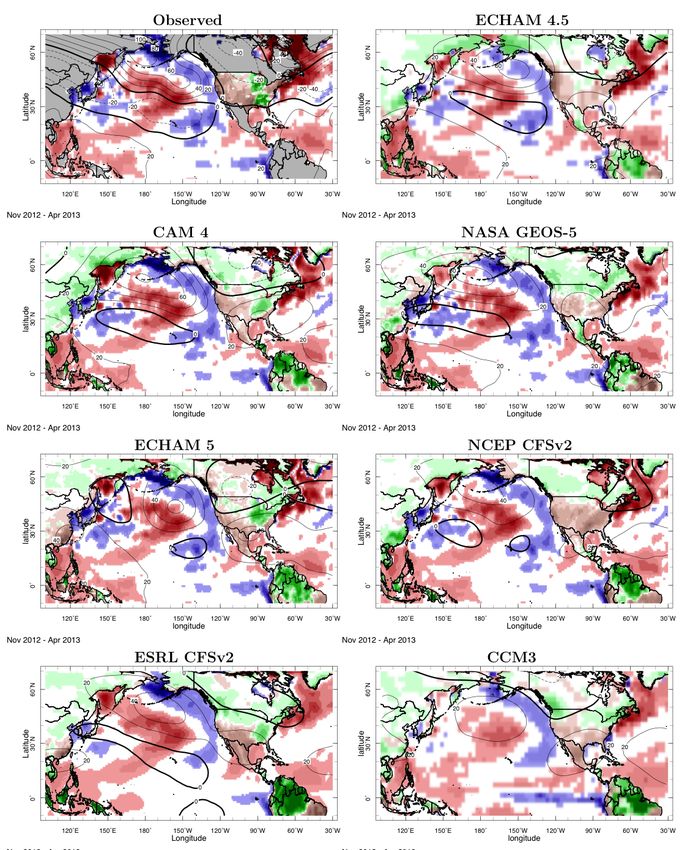
C A U S E S A N D P R E D I C TA B I L I T Y O F T H E 2 0 1 1 - 1 4 C A L I F O R N I A D R O U G H T

                                                                                                                                             5
             1. I N T R O D U C T I O N   employing different methods and models found no substantial effect of human-
                                          induced climate change on the severe precipitation deficits over California (Herring
                                          et al. 2014). One of the studies (Swain et al. 2014) concluded that global warming was
                                          increasing the likelihood of extreme high pressure over a index region of the North
                                          Pacific similar to that observed during the recent drought, though the implications
                                          for drought remained uncertain. However, in the analysis here we will show that
                                          model projections indicate a radiatively-forced change to a relative low over the
                                          North Pacific in winter. Wang and Schubert (2014) found some evidence of forcing
                                          by (sea surface temperature) SST anomalies of a dry tendency for winter 2012/13
                                          but no evidence of an influence from the long-term SST trend. Their result largely
                                          agreed with a separate analysis by Funk et al. (2014) using a different atmospheric
                                          model. These results are good motivation for the more comprehensive analysis of the
                                          complete (to date) three-year California drought presented here.
                                              Drought is of course nothing new to California. Figure 1 also shows that, despite
                                          the remarkable nature of the last year and last three years in California’s recorded
                                          history, these events are not without precedence. Figure 2 (below) shows the winter
                                          half-year precipitation history for all of California. For example the driest winter was
                                          1976-77 and there was an extended dry period in the 1920s and 1930s (Mirchi et
                                          al. 2013), which included the second driest winter of 1923-24. The driest three-year
                                          period was 1974 to 1977, which included the driest winter and 1975-76, the fourth
                                          driest winter. There have also been extended wet periods, including one in the mid
                                          1990s. This preceded a period of steadily declining precipitation up to and including
                                          the 2013-14 drought and part of the explanation of the recent drought will involve
                                          explaining the decline in winter precipitation over the recent two decades. However,
                                          over the entire 120 years of record, there is no clear trend towards wetter or drier
                                          conditions.
                                              Over the last few decades since the pioneering work of Ropelewski and Halpert
                                          (1986), it has become clear that SST variability exerts a strong control over precip-

                     FIGURE 2

Climate Division California
    Precipitation Anomaly
Time series of all-California November
  to April winter precipitation for1895
  to 2014 and the same after low-pass
    filtering with a seven year running
             average Units are mm/day.
C A U S E S A N D P R E D I C TA B I L I T Y O F T H E 2 0 1 1 - 1 4 C A L I F O R N I A D R O U G H T

6
              1. I N T R O D U C T I O N       itation across much of southwestern North America. In a recent review, Seager and
                                               Hoerling (2014) claim that as much as a quarter of the interannual variability of
                                               precipitation for southwest North America as a whole is explained in terms of an
                                               atmospheric response to tropical Pacific SST anomalies with El Niño events tending
                                               to make the region wet and La Niña events tending to make it dry. These tropical
                                               Pacific-driven precipitation teleconnections do include California during winter (e.g.
                                               Mason and Goddard (2001); Seager et al. (2014a)) but, according to the same anal-
                                               ysis, SST-driven variability tends to account at most for a quarter of the interannual
                                               precipitation variance in California. This suggests that the precipitation history of
                                               California will be heavily influenced by random atmospheric variability.
                                                  So what did cause the drought? Random atmospheric variability, SST forcing or
                                               human- driven climate change or some mix of these? Could this drought have been
                                               predicted? Is the 2011-14 event akin to prior California droughts or different? Can
                                               we say anything about whether the current three-year drought will persist, intensify
                                               or weaken? Was it related to human-induced climate change? These are among the
                                               questions we attempt to address in this report using analyses of observations, simu-
                                               lations with atmosphere models forced by observed sea surface temperatures (SSTs)
                                               through April 2014 and coupled atmosphere-ocean models forced by known past and
                                               estimated future changes in radiative forcing. By taking a long-term perspective on
                                               the meteorological causes of California drought, as well as considering projections
                                               of radiatively-driven climate change, we hope to provide a considerably improved
                                               understanding of the causes and predictability of California drought in general.
                                                  In Section 2 we detail the observational data and models used. Section 3 describes
                                               the observed atmosphere-ocean state during the past 3 winters and Section 4 exam-
                                               ines the multimodel ensemble mean response to imposed SST anomalies for these
                                               winters. Section 5 then discusses the more general causes of wet and dry winters in
                                               California. Section 6 examines in more detail the model simulations of the past three
                                               winters. Section 7 examines the role of SST forcing for the recent drought, Section
                                               8 compares the long-term history of California precipitation with that simulated by
                                               SST-forced models. Section 9 assesses the contribution of human-induced climate
                                               change to the recent drought. Section 10 briefly considers the upcoming winter and
                                               conclusions and discussion are offered in Section 11.

         2. Observational                         The precipitation data used are the Climate Division data from the National
                                               Oceanographic and Atmospheric Administration (NOAA) chosen because they ex-
          data and model
                                               tend up to the most recent month, begin in 1895, and hence allow the recent winters
              simulations                      to be placed in long-term context (Vose et al. 2014). To create the all-California values
                                               used here, the seven California climate divisions were formed into an area-weighted
                                               average. Circulation anomalies are diagnosed using the National Centers for Envi-
                                               ronmental Prediction-National Center for Atmospheric Research (NCEP-NCAR)
                                               Reanalysis extending from 1949 to the past month (Kalnay et al. 1996; Kistler et al.
                                               2001). Sea surface temperature (SST) data for the observational analysis are from
                                               the NCEP Reanalysis. The model simulations to be described below, however, use a
                                               variety of SST analyses.
                                                  The model simulations used are an ensemble-of-opportunity of various models
                                               that have been forced by global historical SSTs up through the past winter and with
                                               multiple ensemble members available. These are: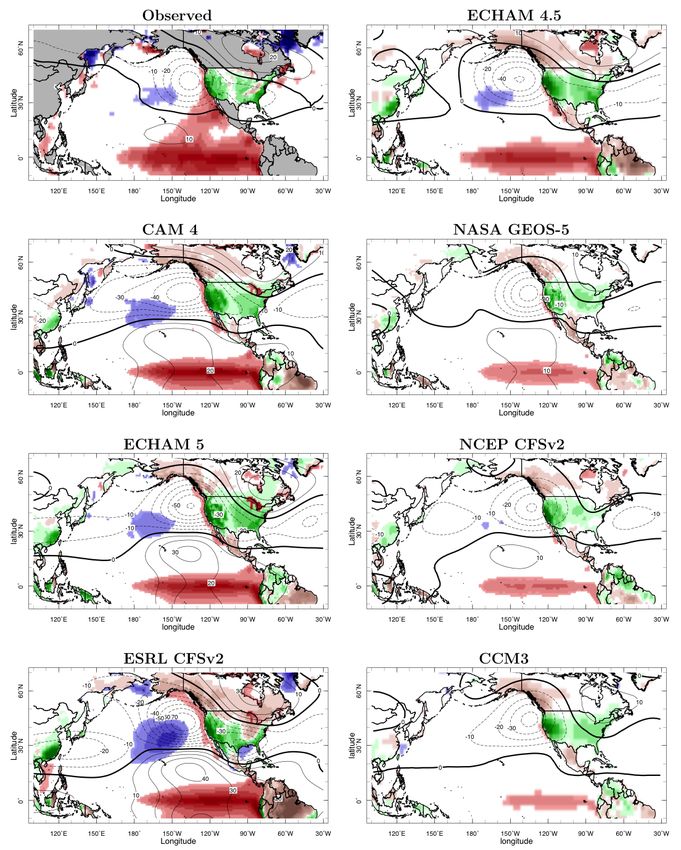
C A U S E S A N D P R E D I C TA B I L I T Y O F T H E 2 0 1 1 - 1 4 C A L I F O R N I A D R O U G H T

                                                                                                                                               7
2 . O B S E R VAT O N A L DATA A N D          1. A 16-member ensemble with the NCAR Community Climate Model 3 (CCM3,
           M O D E L S I M U L AT I O N S        Kiehl et al. (1998)) that covers January 1856 to April 2014. The model was run
                                                 at T42 resolution with 18 vertical levels. Sea ice was held at climatological val-
                                                 ues. The SST forcing combines the Kaplan et al. (1998) SST globally from 1856
                                                 to 1870, and in the tropical Pacific Ocean (20°N to 20°S) through 2009, and
                                                 the Hadley Centre SST (Rayner et al. 2003) outside of the tropical Pacific from
                                                 1871 through 2009. The Hadley data were used globally from 2010 to 2014.
                                              2. A 24-member ensemble with the European Centre-Hamburg Max Planck
                                                 Institut fur Meteorologie model 4.5 (ECHAM4.5, Roeckner et al. (1996)) from
                                                 January 1950 through February 2014, forced by the NOAA ERSST data set for
                                                 SST (Smith and Reynolds 2004) and with sea ice held fixed at climatological
                                                 values from the same data. Trace gases were held fixed at 1990 values. Model
                                                 resolution was T42 with 19 vertical levels.
                                              3. A 20-member ensemble with the ECHAM5 model (Roeckner et al. 2013) from
                                                 January 1979 through April 2014 forced by the Hurrell et al. (2008) SST and
                                                 sea ice data, as recommended for use in CMIP5 simulations, and time varying
                                                 GHGs, using the RCP6.0 scenario after 2005. The resolution was T159 with 31
                                                 vertical levels.
                                              4. A 12-member ensemble with the National Aeronautics and Space Admin-
                                                 istration (NASA) Goddard Earth Observing System model 5 (GEOS5, Rie-
                                                 necker et al. 2008, Molod et al. 2012, Schubert et al. 2014) from January 1871
                                                 to April 2014, forced by observed SSTs and sea ice from Hurrell et al. (2008)
                                                 up through March 2010 and the NOAA OI data since, and with time-varying
                                                 greenhouse gases. Model resolution was 1° latitude by 1° longitude with 72
                                                 hybrid-sigma levels in the vertical.
                                              5. A 50-member ensemble of the NCEP Global Forecast System (GFS, the at-
                                                 mosphere component of the Coupled Forecast System) version 2 model in the
                                                 version run by the NOAA Earth System Research Laboratory (ESRL GFSv2),
                                                 extending from January 1979 to April 2014. The model was run at T126 reso-
                                                 lution with 64 vertical levels. The model was forced by observed SST and sea
                                                 ice from the Hurrell et al. (2008) data and had time varying CO2 with other
                                                 radiative forcings held fixed.
                                              6. A 18-member ensemble of the GFSv2 with the version run by the National
                                                 Centers for Environmental Prediction (NCEP) for January 1957 to April 2014.
                                                 The model was run at T126 resolution with 64 vertical levels. The model was
                                                 also forced by the Hurrell et al. (2008) SST and sea ice data and had time vary-
                                                 ing CO2 with other radiative forcings fixed.
                                              7. A 20-member ensemble with the NCAR Community Atmosphere Model
                                                 4(CAM4) from January 1979 to April 2014 forced by SST and sea ice from the
                                                 Hurrell et al. (2008) data set and with time varying GHGs using the RCP6.0
                                                 scenario after 2005. The resolution was 0.94° × 1.25° with 26 vertical levels.

                                               Of these models, CCM3 and CAM4 are earlier and later generations of the
                                            NCAR atmosphere models with different dynamical cores and significantly different
                                            treatments of atmospheric physics. Similarly, ECHAM5 was a successor model to
C A U S E S A N D P R E D I C TA B I L I T Y O F T H E 2 0 1 1 - 1 4 C A L I F O R N I A D R O U G H T

8
                                               ECHAM4.5; both use a spectral formulation but major changes were made to atmo-
                                               sphere and land surface physics. The GFSv2 and GEOS-5 models have their own sep-
                                               arate lineages. The NCEP and ESRL versions of GFSv2 are almost the same model but
                                               small differences as well as the use of different code compilers and computers mean
                                               that they do simulate different climates.
                                                  As a reality-check, the seasonal cycles of all-California precipitation for observa-
                                               tions, the seven model ensemble means and the multimodel ensemble mean were
                                               computed. The observations and all the models have a June to September dry sea-
                                               son, precipitation increasing from October to a December to February winter peak
                                               followed by a decline to May. However, all the models except for ECHAM5 and ESRL
                                               GFSv2 have a peak weaker than observed. The multimodel ensemble mean peak pre-
                                               cipitation is about 3 mm/day compared to the observed peak of about 3.5 mm/day.
                                                  Model data analyzed here are available at http://dolphy.ldeo.columbia.edu:81/
                                               SOURCES/.DTF/.

3. Atmosphere-ocean                               Figure 3 (page 9) shows maps of the 2011-12, 2012-13 and 2013-14 November
                                               through April winter half year U.S. Climate Division precipitation, NCEP Reanalysis
conditions during the
                                               200mb geopotential heights and SST anomalies, all relative to the common 1949 to
 2011 to 2014 winters                          April 2014 period. California, and most of the western U.S., has had below normal
                                               precipitation anomalies for all of the last three winters. Parts of the central and east-
                                               ern U.S. were, in contrast, wet during these winters. SST conditions were also similar
                                               for the last three winters. 2011-12 had quite striking La Niña conditions with SSTs
                                               colder than normal by up to 1K, along with the classic La Niña pattern of cold SSTs
                                               along the western coast of North America and warm SSTs in the central North Pacific
                                               Ocean and far western tropical Pacific Ocean. The La Niña waned in winter 2012-13
                                               leaving weak tropical SST anomalies and much weaker North Pacific SST anoma-
                                               lies as well. In winter 2013-14 the equatorial eastern Pacific cooled and the western
                                               tropical Pacific warmed while a strong warm anomaly developed in the central, and
                                               especially eastern, North Pacific Ocean.
                                                  The geopotential height anomalies show the most obvious differences between the
                                               three winters. In 2011-12 there were low heights above the tropical Pacific, typical
                                               of La Niña conditions, and a rather zonally oriented ridge from the western North
                                               Pacific, across North America to the mid-latitude Atlantic Ocean, a pattern that is not
                                               exactly typical of La Niña winters. In 2012-13, tropical height anomalies were weaker,
                                               but there was a ridge over the North Pacific centered near the Aleutian Islands. 2013-
                                               14 was different again with weak tropical height anomalies but with an extremely
                                               strong ridge stretching from the Bering Sea down the west coast of North America all
                                               the way to Central America and an intense trough centered over Hudson Bay.
                                                  The height anomalies were in general coherent in the vertical and can be used to
                                               largely explain the North Pacific SST anomalies in terms of surface flow and heat flux
                                               anomalies, consistent with analyses dating back at least to Davis 1976 that mid-lati-
                                               tude SST anomalies are primarily driven by atmospheric circulation anomalies (and
                                               not vice-versa). For example, southerly flow around the North Pacific high is consis-
                                               tent with anomalous warming of the central North Pacific by warm, moist advection
                                               that reduces sensible and latent heat loss as well as reduced wind speed (and hence
                                               warming) on the southern flank of the anomalous high. Similar arrangements of wind
                                               and SST anomalies are seen in the other two winters, for example, the localized very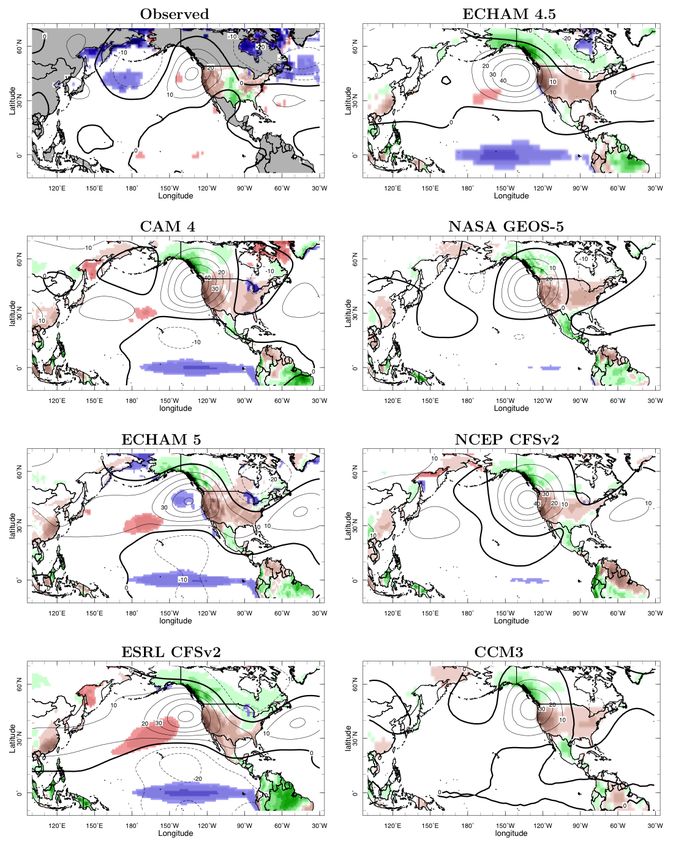
C A U S E S A N D P R E D I C TA B I L I T Y O F T H E 2 0 1 1 - 1 4 C A L I F O R N I A D R O U G H T

                                                                                                                                          9
      3. AT M O S P H E R E - O C E A N
         CO N D I T I O N S D U R I N G
             T H E 2011 T O 2014
                           WINTERS

                       FIGURE 3

        Winter SSTA (ocean),
        Precip (land), 200 mb
            Height (contour)
The observed 200mb height anomalies
 (contours), SST (colors, ocean) and U.S.
  precipitations (colors, land) anomalies
       for winter 2011-12 (top), 2012-13
         (middle) and 2013-14 (bottom).
C A U S E S A N D P R E D I C TA B I L I T Y O F T H E 2 0 1 1 - 1 4 C A L I F O R N I A D R O U G H T

10
                                               warm SST anomalies in the northeast Pacific in winter 2013-14 under strong souther-
                                               ly wind anomalies.
                                                  These examinations of the observed conditions during the three year drought sug-
                                               gest that it arose from a series of winter circulation anomalies all of which involved
                                               high pressure over the North Pacific immediately upstream from California, and
                                               which can be expected to be associated with dry, subsiding air and a lack of mois-
                                               ture-bearing low pressure systems, but with the conditions in each winter not exactly
                                               like the other two. It also suggests that the strong SST anomalies in the North Pacific
                                               Ocean were themselves forced by the atmospheric circulation anomalies and, hence,
                                               not causal.

      4. The multimodel                           In Figure 4 (page 11) we show the seven model average of the ensemble means of
                                               the simulated precipitation and 200mb geopotential height for the past three winters.
        mean SST-forced
                                               The ensemble mean of each model attempts to isolate the boundary forced response
        simulation of the                      common to the ensemble members while the average across the models seeks to
       last three winters                      identify responses that are not model dependent but are robust. Comparing Figure 4
                                               with the observed state in Figure 3, it can be seen that the multimodel ensemble mean
                                               (MEM) produces a ridge off the west coast of North America, over the eastern North
                                               Pacific, in each of the past three winters. In winter 2011-12 the MEM has a rather
                                               classic La Niña pattern (Seager et al. 2014a) with a clear connection to cold SSTs and
                                               low geopotential heights in the tropical Pacific. In the following two winters the MEM
                                               produces a northwest- to southeast-oriented ridge akin to that observed, but quite
                                               different (even in quadrature over the North Pacific-North America region) to the La
                                               Niña-forced 2011-12 pattern. The MEM also has low heights over northern Canada
                                               in the past two winters, providing for northerly flow anomalies over western Cana-
                                               da. Like the observations, the MEM height pattern hints at a wave train originating
                                               from the western tropical Pacific Ocean. Consistent with the height pattern including
                                               the ridge off the west coast, and consistent with the observations, the MEM has dry
                                               anomalies in all winters over southwestern North America. These results are sugges-
                                               tive of an ocean-forced component to the three-year California drought. Notably,
                                               however, it appears the multimodel mean height anomaly at the West Coast is about
                                               half that observed but the California (and West Coast) precipitation anomaly is less
                                               than half that observed.

           5. The ocean,                          Having examined the observed and modeled state during 2011 to 2013 we next
                                               take a longer term perspective and examine the typical atmosphere-ocean state
        atmosphere and
                                               during all-California droughts and pluvials. This will be first examined in the obser-
           precipitation                       vational record and then within simulations with climate models forced by observed
       states associated                       SSTs.
      with all-California                      a. The observational record
            dry and wet                           To analyze the observed state during droughts and pluvials we determined the driest
               winters in                      and wettest 15% of winter half years for all of California in the 1949-50 to 2010-11 peri-
      observations and                         od1. This excludes the three recent drought winters so that they can be cleanly compared
     SST-forced models                         to the normal drought or pluvial state. We begin the analysis in 1949 to correspond to

                                               1
                                                The wettest winters were 1951-52, 1957-58, 1968-69, 1977-78, 1980-81, 1982-83, 1994-95, 1997-98 and 2005-06.
                                               The driest winters were 1956-57, 1958-59, 1963-64, 1975-76, 1976-77, 1986-87, 1989-90, 1993-94, 2006-07.
C A U S E S A N D P R E D I C TA B I L I T Y O F T H E 2 0 1 1 - 1 4 C A L I F O R N I A D R O U G H T
11
FIGURE 4
7 Model Avg. Winter SSTA
(ocean), Precip (land), 200
mb Height (contour)
The observed 200mb height anomalies
(contours), SST (colors, ocean) and U.S.
precipitations (colors, land) anomalies
for winter 2011-12 (top), 2012-13
(middle) and 2013-14 (bottom).C A U S E S A N D P R E D I C TA B I L I T Y O F T H E 2 0 1 1 - 1 4 C A L I F O R N I A D R O U G H T
12
5. T H E O C E A N , the beginning of the NCEP/NCAR Reanalysis data from which we use the geopoten-
AT M O S P H E R E A N D tial height fields. Figure 5 (page 12) shows in its upper left panel the anomalies of U.S.
P R E C I P I TAT I O N S TAT E S
precipitation, 200mb heights and SSTs for the 15% of driest California winter half years.
A S S O C I AT E D W I T H
A L L- C A L I F O R N I A D R Y The driest winters tend to be dry along the entire U.S. West Coast and associated with
AND WET WINTERS IN an anomalous high pressure system centered just west of Washington State with an
O B S E R VAT I O N S A N D anomalous low just south of the Aleutian Isles. The SST anomalies are restricted to the
S S T- F O R C E D M O D E L S North Pacific and of the sign consistent with atmosphere circulation forcing: cold in the
FIGURE 5
California Dry Winter
Composite Precip (land),
SSTA (ocean), 200mb
Height (contour)
The 200mb height (contours), SST
(colors, ocean) and precipitation (colors,
land) anomalies composited over
the driest 15% of California winters
for observations (top left, only U.S.
precipitation shown) and for the SST-
forced models (remaining panels). For
the models the 15% driest winters were
identified in each ensemble member
and the composites were then formed
by averaging across the ensemble.C A U S E S A N D P R E D I C TA B I L I T Y O F T H E 2 0 1 1 - 1 4 C A L I F O R N I A D R O U G H T
13
5. T H E O C E A N , western North Pacific under northwesterly and westerly flow that will induce cooling by
AT M O S P H E R E A N D cold, dry advection and increased wind speed and weak warm conditions under south-
P R E C I P I TAT I O N S TAT E S
erly flow over the eastern North Pacific. Notably there are no SST or height anomalies
A S S O C I AT E D W I T H
A L L- C A L I F O R N I A D R Y in the tropics indicating the typical California drought winters are not tropically forced.
AND WET WINTERS IN The companion figure for the 15% of wettest California winters is shown in the upper
O B S E R VAT I O N S A N D left panel of Figure 6 (page 13). For California wet years the entire U.S. west tends to
S S T- F O R C E D M O D E L S be wet and there is a low pressure system centered west of Oregon. In those cases, and
FIGURE 6
California Wet Winter
Composite Precip (land),
SSTA (ocean), 200mb
Height (contour)
Same as Figure 4 but for composites of
California wet winters.C A U S E S A N D P R E D I C TA B I L I T Y O F T H E 2 0 1 1 - 1 4 C A L I F O R N I A D R O U G H T
14
5. T H E O C E A N , unlike the case for dry winters, the low is clearly associated with a subtropical high to its
AT M O S P H E R E A N D south and a warm tropical Pacific Ocean, a classic El Niño-like arrangement of SST and
P R E C I P I TAT I O N S TAT E S height anomalies. These two results indicate an interesting and impressive nonlinear-
A S S O C I AT E D W I T H
ity in California climate variability: while wet winters are usually El Niño winters, dry
A L L- C A L I F O R N I A D R Y
AND WET WINTERS IN winters are not usually La Niña winters. Instead it appears that the typical dry winters
O B S E R VAT I O N S A N D are more related to a local North Pacific-North America wave train of presumed internal
S S T- F O R C E D M O D E L S atmospheric origin.
b. The model record
For each of the model simulations are ensembles forced by the same history of ob-
served SST but begun with different atmospheric initial conditions. For any model the
individual ensemble members thus have different sequences of random internal atmo-
spheric variability (weather) together with an SST-forced component that is com-
mon to all. To examine the atmosphere-ocean states for modeled California dry and
wet winters, and to allow for the possibility that these are generated by atmospheric
processes alone, we identified the driest and wettest 15% of winters in each ensemble
member and then averaged the results across the ensemble to derive the dry and wet
patterns for each model. The entire lengths of the ensembles were used and anomalies
are relative to each model’s long-term climatology.
Results are shown in Figures 5 and 6 for dry and wet composites respectively. All
models correctly have a high pressure anomaly west of Washington State during Cal-
ifornia dry winters. The CCM3, NCEP CFSv2 and GEOS5 models correctly have this
high appearing as a mid- latitude wave train while the other models have a wave train
connected to the tropics and a La Niña like SST anomaly. The mid-latitude SST anom-
alies seen in observations to accompany the circulation anomaly are not seen in the
model runs. This is because the SSTs are not coupled in the models and hence cannot
respond to the atmospheric circulation anomalies as happens in nature.
For the California wet years all of the models have an anomalous low pressure
system off the west coast connected with tropical height and SST anomalies that are
a clear expression of El Niño. This is much as observed. While all the models are
roughly correct in this sense it means that only CCM3 and GEOS5 correctly represent
the nonlinearity of the California precipitation relationship to SST anomalies while
ECHAM4.5 and CAM4 are too linear.
The nonlinearity itself probably arises from the different height teleconnections for
La Niña and El Niño events. Tropical Pacific SST anomalies for La Niña events tend
to be to the west of those for El Niño events with the latter forcing a wave pattern with
strong westerly anomalies at the west coast at the latitude of California while, for La
Niña events, the wave train is phase-shifted westward and there are weaker northwest-
erly anomalies over the Pacific Northwest (Haston and Michaelson 1994; Hoerling
et al. 1997, 2001; Lin and Derome 2004; Wu and Hsieh 2004; Peng and Kumar 2005;
Kumar et al. 2005; Schubert et al. 2008; Zhang et al. 2014). Because of this nonlineari-
ty El Niño events are more likely to influence California statewide winter precipitation
than are La Niña events.
6. Model simulation a. The ensemble mean response
of the 2011-12 to Figures 7, 8 and 9 (pages 15,16,17) show the model-by-model ensemble mean pre-
2013-14 winters cipitation and 200mb height anomalies simulated by the SST-forced models presentedC A U S E S A N D P R E D I C TA B I L I T Y O F T H E 2 0 1 1 - 1 4 C A L I F O R N I A D R O U G H T
15
6 . M O D E L S I M U L AT I O N O F along with the observations (repeated from Figure 3). SST anomalies are also shown
T H E 2011-12 T O 2013 -14 since the different models used different SST data sets and this, hence, provides an
WINTERS
idea of uncertainty in the SST. The ensemble mean for each model is shown since that
approximates the SST-forced and, hence, potentially predictable component.
FIGURE 7
Winter 2011-12 SSTA
(ocean), Precip (land),
200mb Height (contour)
The 200mb height (contours), SST
(colors, ocean) and precipitation (colors,
land) anomalies for observations (top
left, precipitation plotted for the U.S.
only) and the ensemble means of
model simulations (other panels) for
the winter of November 2011 to April
2012). Units are meters for height, K for
SST and mm/day for precipitation.C A U S E S A N D P R E D I C TA B I L I T Y O F T H E 2 0 1 1 - 1 4 C A L I F O R N I A D R O U G H T
16
6 . M O D E L S I M U L AT I O N O F Several of the models do a creditable job of simulating the Pacific and North
T H E 2011-12 T O 2013 -14 America height and U.S. West Coast precipitation anomalies in the past three win-
WINTERS ters. However none have height and precipitation anomaly amplitudes as large as
those observed. This suggests that, even if there is an SST-forced component to these
anomalies, according to the models, this is not a full explanation leaving a potential
and important role for a coincident and constructive influence of internal atmosphere
variability. During winter 2011-12 (Figure 7) there were extensive cold SST anomalies
FIGURE 8
Winter 2012-13 SSTA
(Ocean), Precip (land), 200
mb Height (contour)
Same as Figure 6 but for the winter of
November 2012 to April 2013.C A U S E S A N D P R E D I C TA B I L I T Y O F T H E 2 0 1 1 - 1 4 C A L I F O R N I A D R O U G H T
17
6 . M O D E L S I M U L AT I O N O F in the central and eastern equatorial Pacific Ocean characteristic of a La Niña event.
T H E 2011-12 T O 2013 -14 The models respond appropriately in a classic La Niña way (e.g., Seager et al. (2014a))
WINTERS
with low height anomalies in the tropics, a high anomaly over the North Pacific
Ocean extending across southern North America into the Atlantic Ocean and a low
over western Canada. The observed height anomalies had some similarity to this but
were more zonally oriented across the Pacific-North America-Atlantic sector. The
models correctly had California and the west coast of the U.S. drier than normal.
FIGURE 9
Winter 2013-14 SSTA
(ocean), Precip (land), 200
mb Height (contour)
Same as Figure 6 but for the winter of
November 2013 to April 2014.C A U S E S A N D P R E D I C TA B I L I T Y O F T H E 2 0 1 1 - 1 4 C A L I F O R N I A D R O U G H T
18
6 . M O D E L S I M U L AT I O N O F In the following two winters, 2012-13 and 2013-14 (Figures 8 and 9), the eastern
T H E 2011-12 T O 2013 -14 equatorial Pacific SST anomalies had weakened to near normal. Despite this most
WINTERS
of the models still placed a high pressure anomaly over the west coast, especially in
winter 2013-14. In this case the high, over the North Pacific Ocean, is far to the north
of the typical La Niña-forced high. Given that the ridge is associated with a low height
anomaly over the subtropical western Pacific, there is some hint that these may be a
wave pattern forced from the tropical to subtropical Indo-west Pacific region. During
these two winters most of the models also produce drier than normal conditions
FIGURE 10
% of Climatology (black)
and trends (green)
Observed Winter CA (x),
Model Mean (*)
Box and whiskers plots showing for
each model and each of the past
three winters, the mean (star), median
(horizontal line inside boxes), 25th
and 75th percentile spread (horizontal
edges of boxes) and spread (whiskers)
of the model ensemble with outliers
shown as red crosses. The same is
shown but for the three winter average
in the bottom row. 1979 to 2014
observed and modeled trends are
shown as green crosses and stars. Units
are percent of the climatological mean.C A U S E S A N D P R E D I C TA B I L I T Y O F T H E 2 0 1 1 - 1 4 C A L I F O R N I A D R O U G H T
19
6 . M O D E L S I M U L AT I O N O F across the west coast of the U.S. including California. The height and precipitation
T H E 2011-12 T O 2013 -14 anomalies are, however, much weaker than those that actually occurred. Nonetheless,
WINTERS
of the 21 simulated ensemble mean winters (3 years times 7 models), 20 were drier
than normal in California. By this elementary test there is widespread model consen-
sus that the SST conditions of the last three years should have heavily tilted California
towards drought.
CCM3 is probably the most unrealistic model in simulating the west coast ridge
of winter 2013-14. It is also the only one to use the Hadley SST data. We re-ran a
16-member ensemble with CCM3 from January 2013 to April 2014 using the NOAA
ERSST data set and found that the model did reproduce the west coast ridge with a fi-
delity comparable to that of the other models. The Hadley SST anomalies for the past
winter differ to those in the Hurrell and NOAA data sets primarily by being weaker.
The success of the models forced with the latter data sets suggests that their SSTs are
probably more correct than those in the Hadley data but this source of uncertainty
needs to be noted, tracked down and assessed.
b. The ensemble spread of precipitation anomalies for the past three
winters
The analysis just discussed focused on the SST-forced ensemble mean. Also of
interest is the spread of the ensemble, because this can provide a model-based assess-
ment of whether the observed anomalies are consistent with a mix of SST-forcing and
internal variability and the extent to which this combination favored dry conditions.
In Figure 10 (page 18) we show this information in the form of box-and-whiskers
plots for all-California precipitation for each of the three winters and the three-win-
ter average and for each model. The 25th and 75th percentiles of the ensembles are
shown as the limiting horizontal lines of the boxes with the mean as the line cross-
ing the boxes while the median is the star and the range is given by the limits of
the whiskers. The observed values are shown by crosses. For 2011-12 the mean and
2
It is usually the case in climate research
median precipitation anomaly for all models were drier than normal and the ob-
that the amplitudes of the climate served anomaly was easily reached by the ESRL GFSv2 and the two ECHAM models.
anomalies being investigated are at For winter 2012-13 all the means and medians and a clear majority of the multimodel
the very limits of the range of model
simulations. That this is usually so might ensemble indicated drier than normal conditions and the observed anomaly fell with-
be interpreted as indicating that the in the all-model range. For winter 2013-14, all model ensembles except CAM4 had
models have variability that is too weak.
However we prefer an interpretation in mean and median drier than normal, but with the observed value falling at the edge
terms of a climate version of the weak of, or beyond, the model distribution. However, the observed anomaly, at about -1.4
anthropic principle (WAP). In cosmology
the WAP says that it is not surprising mm/day, does not appear to be beyond the full range of possibilities of the models,
that the chance of the Universe evolving based on looking at the model extremes for all the three winters. For the three-win-
to support sentient life is extremely
small. That is because it is only in such
ter average, the observed anomalies are also at the range of, or beyond, the range of
a Universe that we exist to ponder this simulations but not so far beyond as to appear beyond the capability of the models to
question while the much larger number generate such intense three-year droughts. (Examining the full range considering all
of Universes that could not support
life would go unobserved. Similarly winters in all ensemble members confirms that the models are capable of getting ab-
in climate research we choose to only solute and percentage declines in precipitation of the magnitude seen in the last three
examine the interesting extreme events,
while ignoring the vastly greater number winters and the three winter average). Notably the model with the largest ensemble
of run-of-the-mill events, and hence (ESRL GFSv2, 50 members) is the one that encompasses the extreme of winter 2013-
are always looking at the most unusual
climate anomalies. Our models confirm 14 and the three-year average so it is possible the other models would have done too
for us that these are indeed truly rare. had their ensembles been larger.2The left column shows the 200mb height anomaly pattern associated with the third EOF mode of model ensemble mean northern
FIGURE 11 hemisphere winter half year 200mb height. The middle column shows the associated principal component (PC). The right column shows
the regression of SST on the third PC with values only shown where significant at the 95% level. Units are meters for height and K for SST.C A U S E S A N D P R E D I C TA B I L I T Y O F T H E 2 0 1 1 - 1 4 C A L I F O R N I A D R O U G H T
21
7. On the role of The results so far have suggested that, while California dry winters in general,
SST anomalies in might arise from internal atmospheric variability, the past three dry winters likely
contained a component of ocean forcing. The winter of 2011-12 is easiest to explain
causing the California
in that there was an ongoing La Niña event and this forced circulation anomalies that
drought of the last made California dry consistent with a weak La Niña connection to California winter
three years precipitation. The dry winters of 2012-13 and 2013-14 were, however, ENSO-neutral
and different.
To examine the nature of the forced signals during these last 2 winters in more in
detail we turn to the ensemble means of the model simulations. The ensemble mean,
by averaging over the uncorrelated weather in the individual ensemble members,
closely isolates the common boundary-forced component. While many of the models
used did also impose the observed time history of sea ice, it is considered that it is the
SST that matters most (as will be seen). The ensemble sizes used here range from 12
members (GEOS-5) to 50 (ESRL GFSv2) members and are large enough to filter out
much of the weather noise within each model.
Therefore we computed the Empirical Orthogonal Functions (EOFs) of the en-
semble mean 200mb height field for winter half-years in each model. This was done
for the winters of 1979-80 to 2013-14 to match the time period that is covered by all
the model simulations. The Principal Component (PC) associated with each EOF
was then correlated with global winter SST anomalies to determine the pattern of
SST anomalies that forced the circulation anomaly described by the EOF mode. In all
models the first EOF, which we do not show here, is the El Niño-Southern Oscillation
(ENSO) mode. This typically explains more than half of the northern hemisphere
SST-forced variance of 200mb heights and is clearly, and not surprisingly, the domi-
nant mode of variability. The second EOF in all the models appears to be the decadal
ENSO, or Pacific Decadal Variability mode. Like the first mode (though orthogonal
to it), it has strong height expression in the tropics and a wave train extending across
the Pacific and North America. The second mode PC correlates to a meridionally
broad SST anomaly centered on the central and eastern equatorial Pacific Ocean with
opposite signed anomalies in most of the remainder of the world ocean. Given the
1979 to 2014 time frame of analysis, and decadal shifts in 1976-77 and 1997-98, the
PC also appears as a trend.
As shown in Figure 11 (page 20), in every model other than CCM3 (which seems
to have a more annular mode response) the third EOF mode was a wave train that
arched from the tropical west Pacific northeastward across the Pacific Ocean to North
America and (in the phase shown) had a ridge extending from the northwest over
the Bering Sea to the southeast over California at or just west of the North Ameri-
can coast. Also shown are the PCs which make clear that this is a mode of variability
without any obvious trend to a preferred state. In many models the PC value for
winter 2013/14 is strong and often the strongest in the record consistent with the
dominance of this pattern in nature this past winter.
Finally, the PCs were regressed with global SST to determine what ocean climate
variability was responsible for forcing this mode and the resulting maps are also
shown in Figure 11, with regression coefficients only shown where significant at the
95% level. All the models agree that the west coast ridge pattern of height variability
is forced by an intensified east-west SST gradient across the equatorial Pacific Ocean
with both cool in the east and warm in the west. However the correlation is strongestC A U S E S A N D P R E D I C TA B I L I T Y O F T H E 2 0 1 1 - 1 4 C A L I F O R N I A D R O U G H T
22
7. O N T H E R O L E O F S S T with the warm anomalies in the far western equatorial Pacific from where the wave
A N O M A L I E S I N C AU S I N G train that includes the west coast ridge appears to originate. This makes the forced
THE CALIFORNIA DROUGHT
response different from that associated with ENSO events which have maximum SST
OF THE LAST THREE YEARS
anomalies in the central and eastern Pacific Ocean and an atmospheric response that
originates from there (Trenberth et al. 1998; Seager et al. 2010). The SST correlations
also show anomalies in the north Pacific with warm anomalies extending northeast
from the tropical west Pacific and also appearing in the central north Pacific. As for
the observations in 2013-14, the warm anomaly in the central north Pacific can be
understood in terms of the atmosphere driving the SST anomalies within southeaster-
ly flow anomalies to the west of the west coast ridge.
FIGURE 12
Winter Precipitation
Regression on PC3 200 mb
Heights
The regression of ensemble mean
precipitation on PC3 from Figure 9.
Values are only shown where significant
at the 90% level. Units are meters for
height and K for SST. Units are mm/day
per standard deviation of the PC.C A U S E S A N D P R E D I C TA B I L I T Y O F T H E 2 0 1 1 - 1 4 C A L I F O R N I A D R O U G H T
23
7. O N T H E R O L E O F S S T In Figure 12 (below) we show the regression of the ensemble mean precipitation
A N O M A L I E S I N C AU S I N G to the PC of the third mode plotting values where significant at the 90% level (which
THE CALIFORNIA DROUGHT was chosen so as to better see the large scale pattern of precipitation teleconnection
OF THE LAST THREE YEARS than can be seen with a 95% threshold). As expected there is an increase in precipi-
tation over the warm SST anomaly in the western equatorial Pacific Ocean, and a de-
crease over the central to eastern equatorial Pacific Ocean. In all the models the third
mode also corresponds to dry anomalies at the west coast of North America though
the latitudinal reach of this varies and does not always incorporate California.
These results quite strongly indicate that the west coast ridge pattern of winter
2013/14 was to some extent forced by the anomalously warm west tropical Pacif-
ic SSTs of the past winter. These SST anomalies cause increased precipitation and,
hence, atmospheric heating above them which can force a Rossby wave that prop-
agates towards North America creating a ridge and depressed precipitation there.
However, returning to the analysis of the simulations of the past winters, it should
be noted that the height anomalies at the west coast are weaker than those observed.
Therefore, despite the importance of this third mode of SST-forced variability, inter-
nal atmospheric variability also likely played a role that worked constructively with
the SST-forced component to create the observed strength of anomaly.
8. How well can the The hopes raised in the previous two sections that there may be some opportuni-
ty to forecast, in general, California winter precipitation in terms of slowly evolving
history of California SSTs, is confirmed somewhat by examination of Figure 13 (page 24). Here we show a
winter precipitation comparison of observed and modeled time histories of all-California winter precipi-
be reproduced by tation. The comparison is shown for the entire time periods available for the models
SST-forced models? that overlap with observations and hence covers, for two models, 1895 to 2014. The
plot shows the ensemble mean, which closely isolates the SST-forced component
common to all ensemble members, and the plus- and minus-two standard devia-
tion spread of the model ensembles about their respective means. The correlation
coefficient between the ensemble mean and the observations is noted on the plots.
From these comparisons, both by visual inspection and the value of the correlation
coefficients, it is clear that the ability of models to simulate the past history of pre-
cipitation varies considerably. At the high end, the ESRL GFSv2 suggests almost a
third of the precipitation variance is SST-forced, though this is only for the post-
1979 period, while, at the low end, CCM3 suggests the value is only a few percent,
though that is for the entire post-1895 period. Despite the success of some models
in this regard, notably all of the models failed to simulate a drought in the late 1980s
to early 1990s, four of four failed to simulate the mid-1970s drought and two of two
failed to simulate the general dry period in the 1920s to early 1930s. These results are
consistent with the observational analyses (Section 5) that showed the typical cause
of California dry winters being internal atmospheric variability. Also consistent, the
models seem to have some success in simulating wet winters during El Niño events,
e.g. 1982-83 and 1941-42. The results are also consistent with the recent drought,
which is moderately reproducible in terms of SST forcing, being quite an unusual
event. The models also capture the decadal scale drop in precipitation since about
the late 1970s. Quantitatively this is shown in the box and whiskers plot in Figure 10
where observed and modeled 1979 to 2014 trends, expressed as a departure from theC A U S E S A N D P R E D I C TA B I L I T Y O F T H E 2 0 1 1 - 1 4 C A L I F O R N I A D R O U G H T
24
8. HOW WELL CAN THE 1979 to 2014 mean (i.e final minus first value of the linear trend divided by two), are
HISTORY OF CALIFORNIA shown as green crosses and stars. The two trends are almost identical. Also clear is
W I N T E R P R E C I P I TAT I O N that the decadal trend accounts for relatively little of the amplitude of the drought of
B E R E P R O D U C E D B Y S S T-
F O R C E D M O D E L S?
the last three year but much, and sometimes all, the modeled drought amplitude. The
post late 1970s drying trend is thought to be related to the 1997/98 decadal shift in
the Pacific Ocean to more La Nina-like conditions and previous studies have shown
how this generated a dry shift across southwestern North America (Huang et al. 2005,
Hoerling et al. 2010, Seager and Vecchi 2010, Seager and Naik 2012).
FIGURE 13
Observed Winter CA
(Solid), Model Mean
(Dashed), +/- 2 STD (Grey)
Time histories of observed and
modeled all-California winter
precipitation. The ensemble mean for
each model is shown together with the
plus and minus two standard deviation
spread of the model ensemble about
its ensemble mean. The results show no
general role of SST-forcing in explaining
the history of California precipitation.
Units are mm/day.C A U S E S A N D P R E D I C TA B I L I T Y O F T H E 2 0 1 1 - 1 4 C A L I F O R N I A D R O U G H T
25
9. Assessing human- Much coverage and discussion of the California drought has raised the question
of whether human-driven climate change is in any way responsible. This is a reason-
induced climate able question because models project that southwest North America as a whole will
change contribution become more arid as a result of rising greenhouse gases (Seager et al. 2007, 2013;
to the 2011-14 Maloney et al. 2014). Determining human-induced climate change from the observa-
California drought tional record is difficult. Across North America there is strong interannual to decadal
and multidecadal variability of precipitation which means that observed trends, even
over very long time periods, could arise from natural variability. For example, in the
case of southwestern North America as a whole, the last century exhibited a striking
pluvial in the first two decades (Cook et al. 2011), serious drought in the 1930s and
1950s, and another pluvial in its last two decades (Seager et al. 2005; Huang et al.
2005; Swetnam and Betancourt 1998), followed by drought since then (Weiss et al.
2009; Cayan et al. 2010). Precipitation trends computed amidst such a rich record are
most likely heavily influenced by natural variability (e.g. Hoerling et al. (2010); Seager
and Vecchi (2010)).
Climate model projections provide a different way of estimating human-induced
climate change. In the same way that averaging across an ensemble of SST-forced
models isolates the common, SST-forced, component, averaging across an ensemble
of radiatively-forced coupled climate models isolates the common component forced
by rising greenhouse gases, variations in ozone, solar variability, volcanism etc. Here
FIGURE 14
CMIP5, (2011-2020) -
(1979-2005), NDJFMA
The CMIP5 38 model mean of the
2011-2020 (top four panels) and
2021-2040 (bottom four panels) minus
1979-2005 change in precipitation, P
(left), and precipitation minus surface
evaporation/evapotranspiration, P − E
(right), where the double overbar
indicates the climatological monthly
mean as in Seager et al. (2014b).
Also shown in the left panels are the
changes in 200mb height. All results are
for the November through April winter
half year using the RCP85 emissions
scenario. Units are mm/day for P and
P − E and meters for heights.C A U S E S A N D P R E D I C TA B I L I T Y O F T H E 2 0 1 1 - 1 4 C A L I F O R N I A D R O U G H T
27
9. A S S E S S I N G L O N G - we used the latest CMIP5 archive. It has already been shown that human-induced
T E R M C L I M AT E C H A N G E precipitation changes to date across North America are small compared to natural in-
CO N T R I B U T I O N T O T H E
terannual variability (Seager and Hoerling 2014). Here to provide a different context
2011-14 C A L I F O R N I A
DROUGHT we show the 38 model mean projected changes in precipitation, P , and precipitation
minus evaporation, P −E, for the November through April half year for the years
of 2011-2020 and 2021-2040 minus 1961-2000 using the RCP85 emissions scenar-
io (Figure 14, above; model data are available at http://kage.ldeo.columbia.edu:81/
SOURCES/.LDEO/.ClimateGroup/.PROJECTS/.IPCC/.CMIP5/.MultiModelMeans/.
MMM-v2/.) For both the current decade and the next two-decade period, there is a
widespread area of subtropical drying as measured by a reduction of P and a stronger
reduction of P − E which dries Mexico and parts of Arizona, New Mexico and Texas.
This pattern is consistent with expectations of hydroclimate change due to rising
GHGs (Seager et al. 2014b). For the current decade this drying area includes Califor-
nia but is very weak. In contrast, for the future period, California north of San Diego
and Los Angeles is projected to have an increase in winter half-year P and a slightly
smaller increase in P − E (presumably because warming temperatures cause an in-
crease in winter E). The change in California is made up of an increase in mid-winter
P but a decrease in spring that connects with the interior southwest drying (Neelin
et al. 2013; Pierce et al. 2013, Gao et al. 2014). The slight drying in the current de-
cade arises because the spring drying proceeds faster than the mid-winter wetting.
Hence, for California, the models project an emerging shorter, sharper wet season.
Given that the recent California drought included precipitation drops in midwinter
as well as spring it is not consistent with the model-projected human-driven climate
change signal. Figure 14 also shows the change in 200mb heights. While the heights
increase everywhere due to the warming troposphere, the climate change signal also
includes a trough off the west coast with a southward shifted jet stream (Neelin et al.
2013; Simpson et al. 2014; Seager et al. 2014b). This is consistent with winter wetting
in central to northern California, as also seen in Intergovernmental Panel on Climate
Change (2013). The circulation anomalies during the recent California drought are
therefore also not consistent with model projections of human-driven circulation
anomalies. The radiatively-forced reduction in precipitation for the current decade is
less than 0.1 mm/day, an order of magnitude smaller than the anomalies that oc-
curred in California in the recent drought, and also smaller than the drying forced by
SST anomalies. The projected future winter half-year wetting in central to northern
California is similarly small, but made up of early half-year wetting and late winter
half-year drying changes that are on the order of a few mm/day.
10. Implications for During October 2014, the warm SST anomaly in the western tropical Pacific that
contributed to the drought of the past two winters disappeared. In November 2014
the upcoming winter
there is a warm SST anomaly that extends across most of the equatorial and sub-
of 2014/15 tropical North Pacific. Further, as shown at the International Research Institute for
Climate and Society’s website iridl.ldeo.columbia.edu/maproom/Global/Forecasts/,
forecasts predict SST anomalies to remain weak in the western Pacific Ocean and a
weak to modest El Niño pattern to develop. To go along with this models are predict-
ing a modestly increased probability of wetter than normal conditions for northern
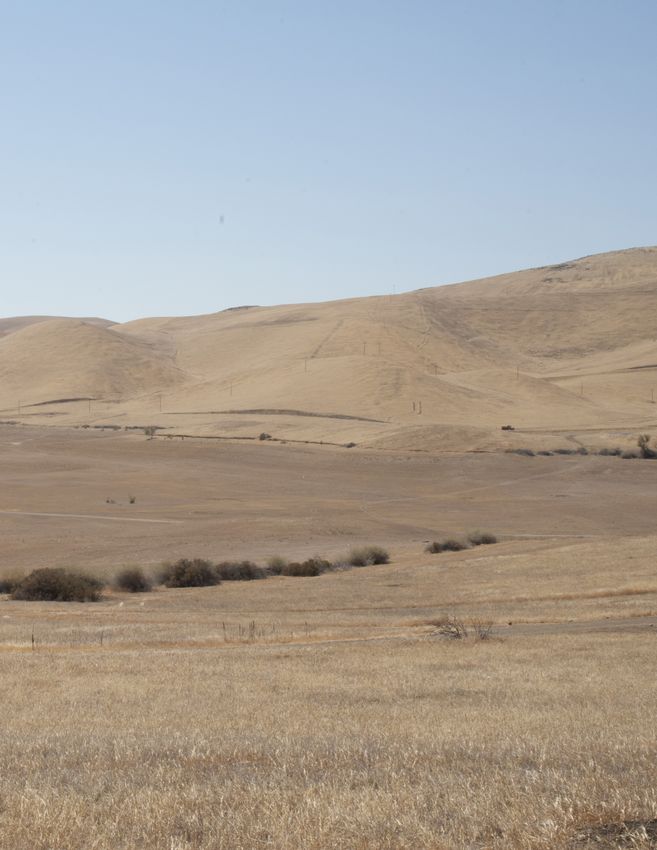
Photo at left:
Mexico and the southern U.S. The current (November) Climate Prediction Center
Near San Luis Reservoir, August 2014 forecast indicates an about 45% chance of central to southern California precipitationC A U S E S A N D P R E D I C TA B I L I T Y O F T H E 2 0 1 1 - 1 4 C A L I F O R N I A D R O U G H T
29
10. I M P L I C AT I O N S F O R T H E being in the upper tercile of the historical distribution. . However, if either current
U P CO M I N G W I N T E R O F conditions persists or if the SST forecasts are correct, the localized warm anomaly in
2014/15
the western Pacific that contributed to California drought the past two winters will
not be present this coming winter. It is therefore reasonable to assume that precipi-
tation amounts will very likely be greater than last winter, but not necessarily much
above the climatological normal. It should also be noted that even a reasonably strong
El Niño event, which seems highly unlikely, does not guarantee a wet California
winter. Notably two of the driest winters on record occurred during the 1976-77 and
1986-87 El Niño events!
11. Conclusions and The current depleted state of water supply available to municipalities and agricul-
ture in California arose from a major, if not record-breaking, meteorological drought.
discussion
Winter 2013-14 was the sixth driest winter since records began in 1895 and the
three-winter average precipitation from 2011-12 to 2013-14 was the second lowest
on record (behind 1974 to 1977). We have attempted to determine the causes of this
drought by examining the roles of atmospheric variability, forcing from SST anom-
alies, and possible human-induced climate change. We have also attempted to place
the recent drought in the context of what generally causes dry California winters and
the long-term record of California hydroclimate.
a. Conclusions
• The current drought, though extreme, is not outside the range of California
hydro-climate variability and similar events have occurred before. Although
there has been a drying trend in California since the late 1970s, when consid-
ering the full observational record since 1895, there is no appreciable trend to
either wetter or drier California winters.
• In general, dry California winters are caused by a ridge near and off the west
coast that appears as part of a mid-latitude wave train with no obvious forc-
ing from the ocean either in the mid-latitudes or the tropics. In contrast, wet
California winters tend to occur during El Niño events and with a trough over
the eastern North Pacific Ocean. However the association with El Niño is not
strong and not all wet California winters are during El Niños. Notably, the
serious California drought of 1976-77 occurred during a reasonably strong El
Niño event.
• Despite the general role of internal atmosphere variability in driving dry Cali-
fornia winters, the probability for occurrence of three consecutive dry winters
for statewide California precipitation during 2011-14 was significantly in-
creased by the influence of varying sea surface temperatures. This is evidenced
by the fact that all seven SST- forced models examined produced dry west
coast winters when forced with the observed SST anomalies. Winter 2011-12
appears to have been a case of forcing from a La Niña event. In contrast, the
winters of 2012-13 and 2013-14 appear to have been forced, significantly, by
a pattern of warm SST anomalies in the western tropical Pacific Ocean. In
response to this SST anomaly, the models produce a positive precipitation
Photo at left:
anomaly above that forces a wave train that arches northeastward to North
Folsom Lake, August 2014 America and has a ridge and reduced precipitation over the west coast, includ-You can also read