CDP Japan 500 Climate Change Report 2019 - On behalf of 525 investors with assets of US$96 trilllion
←
→
Page content transcription
If your browser does not render page correctly, please read the page content below

CDP Japan 500 Climate Change Report 2019
On behalf of 525 investors with assets of US$96 trilllion

CDP Report 2019 | January 2020                      Report writer
Contents

                                                                      CEO Foreword                                                                                                                           3

                                                                      Forewords from Report Writers                                                                                                          4

                                                                      The Climate A List 2019                                                                                                                6

                                                                      CDP Scoring                                                                                                                            9

                                                                      Stories of Change                                                                                                                    10
                                                                      - Kao Corporation
                                                                      - Japan Tobacco

                                                                      Investor Case Study                                                                                                                  14

                                                                      Japanese Company response to CDP 2019                                                                                                16

                                                                      Message from Non-State Actor                                                                                                         24

                                                                      Message from Ministries                                                                                                              25
                                                                      - SUZUKI Keisuke, State Minister for Foreign Affairs, Japan

                                                                      Appendix                                                                                                                             27
                                                                      CDP Climate Change 2019 - Japanese Company

     Important Notice

     The contents of this report may be used by anyone providing acknowledgment is given to CDP. This does not represent a license to repackage or resell any of the data reported to CDP or the contributing authors and presented
     in this report. If you intend to repackage or resell any of the contents of this report, you need to obtain express permission from CDP before doing so.

     CDP has prepared the data and analysis in this report based on responses to the CDP 2019 information request. No representation or warranty (express or implied) is given by CDP as to the accuracy or completeness of the
     information and opinions contained in this report. You should not act upon the information contained in this publication without
     obtaining specific professional advice. To the extent permitted by law, CDP does not accept or assume any liability, responsibility or duty of care for any consequences of you or anyone else acting, or refraining to act, in
     reliance on the information contained in this report or for any decision based on it. All information and views expressed herein by CDP are based on their judgment at the time of this report and are subject to change without
     notice due to economic, political, industry and firm-specific factors. Guest commentaries where included in this report reflect the views of their respective authors; their inclusion is not an endorsement of them.

     CDP, its affiliated member firms or companies, or its respective shareholders, members, partners, principals, directors, officers and/or employees, may have a position in the securities of the companies discussed herein. The
     securities of the companies mentioned in this document may not be eligible for sale in some states or countries, nor suitable for all types of investors; their value and the income they produce may fluctuate and/or be adversely
     affected by exchange rates.

     ‘CDP’ refers to CDP North America, Inc, a not–for-profit organization with 501(c)3 charitable status in the US and CDP Worldwide, a registered charity number 1122330 and a company limited by guarantee, registered in
     England number 05013650.

     © 2020 CDP. All rights reserved.
02
CDP CEO Foreword

                            Climate change is not a distant, potential   And we are already seeing great examples
                         threat. It is here right now, and already       of environmental leadership, with forward-
                         affecting millions of lives across the globe.   thinking companies proactively taking
                         The Australian bushfires, which started         action. The Science Based Targets initiative
                         raging in late 2019, have affected nearly 10    has snowballed into a global phenomenon,
                         million people, including at least 28 human     with more than 750 of the world’s biggest
                         lives that have been lost. This is just         companies setting emissions reduction
                         one example of recent extreme weather           targets that are grounded in climate
                         events made more likely by climate change.      science. Likewise, corporate demand for
                         The most devastating impact of climate          renewable power is rapidly growing with
                         change and extreme weather is always            220+ companies now working towards
                         going to be loss of human life, but its         100% renewable electricity.
                         impact on ecosystems, communities               T r an s p ar en c y i s t h e f o u n d at i o n f o r
                         and the global economy can be dire too.         meaningful climate action. In 2019,
                         In 2019, CDP analysis found that 215 of         more companies than ever before –
                         the biggest global companies estimate           8,400+ representing over 50% of global
                         the financial implications of climate risks     market capitalization – disclosed
 Those who act           to be close to US$1trillion , including         through CDP, enabling them to comply
 first on climate will   US$250 billion worth of ‘stranded               with the Task Force on Climate-related
 seize the benefits      assets’, at potential risk of being             Financial Disclosures (TCFD). Disclosure
                         made economically unviable.                     of quality data leads to smarter decisions
 of the transition.
                                                                         and informs investors, companies and
 CDP will play its       The cost of exceeding a temperature rise of
                                                                         governments of the actions they need
                         1.5 degrees Celsius – the proposed “guard
 part by continuing      rail” of safety by the Intergovernmental        to take. It’s encouraging to see more
 to set the standard,    Panel on Climate Change (IPCC) – could          companies setting longer-term targets;
 and providing the       be catastrophic. It would have grave            our data will be key to seeing how they are
                                                                         performing against these over time.
 tools to help us        implications on water and food security,
                         living standards, the economy and human
 achieve it together.    health for our generation, and generations
                                                                         But growing corporate action is not
                                                                         enough. Governments must urgently step
 2020 must be the        to come. In economic terms the difference       up their ambition to give business the
 year we all play our    between 1.5 and 2 degrees is estimated at       clarity and confidence they need to invest
 part to ramp up         $15 trillion in damage. We cannot afford        in the zero-carbon future. Those who act
                         to dither and delay substantive action any
 worldwide ambition      longer.
                                                                         first on climate will seize the benefits
                                                                         of the transition. CDP will play its part
  on climate without                                                     by continuing to set the standard, and
 delay.                  2020 is a critical year. Five years on from
                         the Paris Agreement, the time has come          providing the tools to help us achieve it
                         for national governments to upgrade their       together. 2020 must be the year we all play
                         ambition to reduce emissions through their      our part to ramp up worldwide ambition on
                         national plans. This year needs to herald       climate without delay.
                         the start of a super decade of climate
                         action, cutting emissions in half, to give
                         any chance of limiting global warming to        Paul Simpson
                         1.5°C.                                          CEO, CDP

                                                                                                                               03
Forewords from Report Writers
SGS Japan
In recent years, the words ‘ESG’, One of the crucial actions we must
‘sustainability’ and ‘climate change’ take in Japan is to up investment
have become ubiquitous, an in renewable energy. Although 30
unimaginable scenario in the year Japanese companies are currently
2000, when CDP was launched, and committed to the RE100, renewable
Japanese companies are increasingly energy generation in Japan currently
demonstrating an awareness of remains low, at just 15%, half that
their environmental impacts, and the of coals 30% energy share. Japan,
associated risks. being surrounded by the sea and
blessed with geothermal resources,
While a few years ago the response has good conditions for producing
rate of Japanese companies lagged far renewable energy. However, investing
behind their European counterparts, in in renewable energy is difficult on an
2019 we saw the response rate in Japan individual company basis, and so it’s
grow to 63%. For Japanese companies, critical investors and policymakers
reporting on ESG has become a take steps to encourage the funding of
Climate action fundamental practice, and those who technologies and make the choice of
fail to report are increasingly seeing switching to renewable energy an easy
represents a huge themselves at a major disadvantage. one for companies.
opportunity to
businesse, and At SGS Japan, we’ve watched these The role of non-state actors as a part
we hope to see changes play out over the past decade. of the climate solution has never
We’ve seen the number of companies been clearer than at COP25, where
Japanese seeking GHG emissions verification the number of delegates from US
companies making increase from just a few, to dozens, corporations and local governments
the most of it. and sustainability initiatives being outweighed the number of delegates
implemented from the top down, as from the federal government. It is clear,
C-suite managers demonstrate an then, that the companies reporting to
increasing awareness of environmental CDP have as much a role to play as
issues. As our ability to calculate policymakers in the climate fight.
scope 3 emissions grows, we’re seeing
companies engage with their suppliers UNEP analysis shows that achieving
to catalyze climate action across the the 1.5°C target requires a $1.6 to $3.8
value chain. trillion investment annually from 2020
to 2050. Climate action represents a
That said, we still have a long way to huge opportunity to businesses, and
go – companies and policymakers and we hope to see Japanese companies
still failing to take the drastic measures making the most of it.
necessary to tackle the climate crisis
and hold warming at 1.5°C. According
to the United Nations Environment Yuji Takeuchi
Programme (UNEP)’s annual report, CBE Director, SGS Japan Inc.
global GHG emissions must be reduced
by 7.6% annually by 2030 to hold global
average temperature rise at 1.5°C. The
report also states that even if emissions
reduction measures announced by
countries under the Paris Agreement
are implemented, global average
temperatures may still rise by 3.2°C.
04Forewords from Report Writers
SOCOTEC Certification Japan
On September 22, 2019, The World These cases also posed significant
Meteorological Organization (WMO) social risks, seriously impacting the
issued a report for the United Nations lives of citizens experiencing them,
Climate Action Summit, stating that while at the same time representing a
the gap between climate targets and significant business threat.
the reality of actions being taken is
widening. Japan now becomes the country with
the largest number of companies in the
According to this report, 1) The average world that have stated their support for
global temperature for 2015–2019 the TCFD recommendations. Japanese
is on track to be the warmest of any companies must respond to climate
equivalent period on record, and is change by taking sustainable mitigation
currently estimated to be approximately & adaptation actions in response
1.1°Celsius above pre-industrial times; to identified risks & opportunities,
2) Impacts of climate change appear alongside setting and monitoring long-
more severe and are happening earlier term goals.
Japanese than predicted 10 years ago; 3) In 2018,
companies can Carbon dioxide emissions grew 2% CDP provides a platform by which
positively respond compared to the previous year and companies can systematically report
reached a record high of 37 billion and assess their climate impacts, risks
to climate change tonnes; 4) Global GHG emissions are and opportunities in line with the TCFD
by taking not estimated to peak by 2030 if current recommendations.
sustainable climate policies are maintained; 5) To
mitigation & reduce global warming to 2°C, countries We at SOCOTEC Certification Japan
need to triple their GHG reductions have been participating as a Climate
adaptation actions in their NDCs (Nationally Determined Change Scoring Partner since 2018,
in response to Contributions)To hold warming at and sincerely thank CDP for giving us
identified risks to 1.5 °C, they need to increase their the opportunity to score, analyze and
& opportunities, reductions by about 5 times; and 6) GHG create reports again this year. I would
reductions are essential in all sectors, like to take this opportunity to express
alongside setting
including energy, food production and mygratitude on behalf of the SOCOTEC
and monitoring land use. Group.
long-term goals.
In 2019, large typhoons hit the Kanto SOCOTEC Certification Japan hopes
region in Japan, and caused heavy to continue to encourage and assist
damage such as river flooding due to Japanese companies in their journey
heavy rain. Countries around the world to transparency, as we work towards a
were also experiencing climate-related climate-secure future.
weather phenomena and natural
disasters Venice, known as the city of Seigo Futaba
water, was 85% flooded by storm surges Managing Director,
– it’s Basilica of San Marco experienced SOCOTEC Certification Japan
experiencing flooding for the sixth time
in 1,200 years, and the fourth time in
the last 20 years. Venetian floods are
becoming more severe each year, and
are said to be caused by rising sea
levels associated with warmer climates,
excessive pumping of groundwater, and
subsidence due to subduction of plates.
05The Climate A List 2019
{ 182 companies have made the Climate Change A List in 2019
{ Japan becomes the country with the most A List companies (38 companies)
{ CDP scored over 8,000 companies from A to D-; only the top 2% made the A List
{ Companies on the climate A List outperform their peers on the stock market by 5.5% per annum according to STOXX
Number of the A list companies by country (Top 11 countries) Number of the A list companies by region
2 1
40
40 38
35
35 4
30
30
37
25 22
20
20 87 Europe
15 Asia
11 North America
9 9 51
10
10 7 7 6 Oceania
5 5
5 Latin America
00 Africa
Japan
US
France
UK
Germany
Republic
of Korea
Spain
Switzerland
Norway
Finland
Netherlands
Company Country Company Country
Apparel Imperial Brands UK
Kering France Nestlé Switzerland
Pernod Ricard France
Biotech, Health Care & Pharma
Eisai Co., Ltd. Japan Philip Morris International USA
Ono Pharmaceutical Co., Ltd. Japan REMA1000 Norway
AstraZeneca UK Fossil Fuels
Baxter International Inc. USA ENAGAS Spain
Bayer AG Germany
Hospitality
Johnson & Johnson USA
Caesars Entertainment USA
Koninklijke Philips NV Netherlands
Hilton Worldwide, Inc. USA
Lundbeck A/S Denmark
Las Vegas Sands Corporation USA
Novo Nordisk A/S Denmark
Infrastructure
Food, Beverage & Agriculture Daito Trust Construction Co., Ltd. Japan
Asahi Group Holdings, Ltd. Japan
Daiwa House Industry Co., Ltd. Japan
Japan Tobacco Inc. Japan
Sekisui Chemical Co., Ltd. Japan
Kirin Holdings Co Ltd Japan
Sekisui House, Ltd. Japan
Sumitomo Forestry Co., Ltd. Japan
Toda Corporation Japan
Suntory Beverage & Food Japan
ACCIONA S.A. Spain
British American Tobacco UK
City Developments Limited Singapore
Coca-Cola European Partners UK
FERROVIAL Spain
Coca-Cola HBC AG Switzerland
Grupo CCR Brazil
Danone France
National Grid PLC UK
General Mills Inc. USA
Republic Services, Inc. USA
Grieg Seafood Norway
Royal BAM Group nv Netherlands
06Company Country Company Country
Samsung Engineering Republic of Korea Borregaard ASA Norway
Suez France CEMEX Mexico
Veidekke ASA Norway FIRMENICH SA Switzerland
Waste Management, Inc. USA Givaudan SA Switzerland
HeidelbergCement AG Germany
Manufacturing
Fuji Electric Co., Ltd. Japan International Flavors & Fragrances Inc. USA
FUJIFILM Holdings Corporation Japan Kingspan Group PLC Ireland
Komatsu Ltd. Japan LANXESS AG Germany
Nabtesco Corporation Japan L'Oréal France
Nikon Corporation Japan Owens Corning USA
Nissan Motor Co., Ltd. Japan Saint-Gobain France
Panasonic Corporation Japan Sibanye Stillwater South Africa
Sony Corporation Japan Stora Enso Oyj Finland
Toyota Industries Corporation Japan Symrise AG Germany
Toyota Motor Corporation Japan Unilever plc UK
Yokohama Rubber Company, Limited Japan UPM-Kymmene Corporation Finland
Apple Inc. USA Vallourec France
Brembo SpA Italy Power generation
Constantia Flexibles Austria Centrica UK
Ford Motor Company USA EDF France
Groupe PSA France ENEL SpA Italy
HP Inc USA ENGIE France
Hyundai Motor Co Republic of Korea Ørsted Denmark
INDUS Holding AG Germany Pinnacle West Capital Corporation USA
Kia Motors Corp Republic of Korea Vattenfall Group Sweden
Klabin S/A Brazil
Retail
Kone Oyj Finland Aeon Co., Ltd. Japan
Lego Group Denmark Askul Japan
LG Display Republic of Korea Marui Group Co., Ltd. Japan
LG Electronics Republic of Korea Ricoh Leasing Co., Ltd. Japan
LG Innotek Republic of Korea Best Buy Co., Inc. USA
Lite-On Technology Corporation Taiwan Carrefour France
Metsä Board Corporation Finland Cellnex Telecom SA Spain
PACCAR Inc USA Grupo Logista Spain
Pirelli Italy H&M Hennes & Mauritz AB Sweden
Schneider Electric France J Sainsbury Plc UK
Signify NV Netherlands LG Republic of Korea
Stanley Black & Decker, Inc. USA Rexel France
Tessy Plastics USA The Home Depot, Inc. USA
TETRA PAK Sweden Walmart, Inc. USA
Valmet Finland
Services
Materials Benesse Holdings, Inc. Japan
KAO Corporation Japan Fujitsu Limited Japan
Sumitomo Chemical Co., Ltd. Japan MS&AD Insurance Group Holdings, Inc. Japan
Tokyo Steel Manufacturing Co., Ltd. Japan NEC Corporation Japan
Air Liquide France Nomura Research Institute, Ltd. Japan
07Company Country Company Country
Sompo Holdings, Inc Japan Koninklijke KPN NV (Royal KPN) Netherlands
Tokio Marine Holdings, Inc. Japan Landsec UK
Accenture Ireland LG Uplus Republic of Korea
Adobe, Inc. USA Lloyds Banking Group UK
AENA SME SA Spain Macerich Co. USA
Alphabet, Inc. USA Mercialys France
American Express USA Microsoft Corporation USA
ASE Technology Holding Co., Ltd. Taiwan Morgan Stanley USA
Atos SE France Orange France
Bank of America USA salesforce.com USA
Berner Kantonalbank AG BEKB Switzerland SGS SA Switzerland
BNY Mellon USA Shinhan Financial Group South Korea
BT Group UK Sopra Steria Group France
Cap Gemini France Stockland Australia
Cisco Systems, Inc. USA Taiwan Mobile Co. Ltd. Taiwan
Citigroup Inc. USA Telefónica Spain
CVS Health USA Telstra Corporation Australia
Deutsche Telekom AG Germany thyssenkrupp AG Germany
Dexus Property Group Australia TUI Group Germany
DNB ASA Norway Unibail-Rodamco-Westfield France
EVRY ASA Norway Vicinity Centres Australia
Gecina France
Transportation Services
Hewlett Packard Enterprise Company USA Kawasaki Kisen Kaisha, Ltd. Japan
Host Hotels & Resorts, Inc. USA Deutsche Bahn AG Germany
IGM Financial Inc. Canada Österreichische Post AG Austria
ING Group Netherlands Panalpina Welttransport Holding AG Switzerland
Intesa Sanpaolo S.p.A Italy La Poste France
JCDecaux SA. France
08CDP Scoring:
A measure of a company’s environmental performance
Scoring at CDP is mission-driven, focusing on In order to better focus on key data points and
CDP’s principles and values for a sustainable provide a more detailed breakdown of a company’s
economy and as such scores are a tool to score, each question falls into a scoring category.
communicate the progress companies have Different weightings will be applied amongst
made in addressing environmental issues, and sector scoring categories, and the number of
highlighting where risks may be unmanaged. CDP points achieved per scoring category are used
has developed an intuitive approach to presenting to calculate the final score for Management and
scores that highlight a company’s progress Leadership levels, according the scoring category
towards leadership using a 4 step approach: weighting.
Disclosure which measures the completeness of
the company’s response; Awareness which intends A minimum score and/or the presence of a
to measure the extent to which the company has minimum number of indicators on one level will be
assessed environmental issues, risks and impacts required in order to be assessed on the next level.
in relation to its business; Management which is If the minimum score threshold is not achieved,
a measure of the extent to which the company the company will not be scored on the next level.
has implemented actions, policies and strategies The final letter grade is awarded based on the
to address environmental issues; and Leadership score obtained in the highest achieved level. For
which looks for particular steps a company has example, Company X achieved 88% in Disclosure
taken which represent best practice in the field of level, 82% in Awareness and 65% in Management
environmental management. will receive a B. If a company obtains less
than 44% in its highest achieved level (with the
Since 2018, CDP’s questionnaires have taken exception of Leadership), its letter score will have
a sector focused approach, under this new a minus. For example, Company Y achieved 81%
approach, each of CDP’s questionnaires has in Disclosure level and 42% in Awareness level
general questions alongside sectorspecific resulting in a C-.
question aimed at high impact sectors.
Public scores are available in CDP reports, through
Bloomberg terminals, QUICK teminals, Google
The scoring methodology clearly outlines how
Finance and Deutsche Boerse’s website. CDP
many points are allocated for each question and
operates a strict conflict of interest policy with
at the end of scoring, the number of points a
regards to scoring and this can be viewed at
company has been awarded per level is divided
https://www.cdp.net/scoring-confictof-interest.
by the maximum number that could have been
awarded. The fraction is then converted to a
percentage by multiplying by 100.
Threshold
A 65-100%
Leadership A- 0-64%
B 45-74%
Management B- 0-44%
C 45-79%
Awareness C- 0-44%
D 45-79%
Disclosure D- 0-44%
F = Failure to provide sufficient information to CDP to be evaluated for this purpose 1
1 Not all companies requested to respond to CDP do
so. Companies who are requested to disclose their
data and fail to do so, or fail to provide sufficient
information to CDP to be evaluated will receive an
F. An F does not indicate a failure in environmental
stewardship
09Kao Corporation
Chemicals and Cosmetics, Japan
We’re facing the greatest threats in history,
global challenges like climate change,
resource scarcity and plastic pollution
are leading consumers around the world
to seek a more sustainable way of living.
Through our products and presence in
everyday life, we know that we have an
increasingly important role to play in
delivering more sustainable products
and empowering consumers to live more
sustainable lifestyles.
10Tips for success The world is changing fast, so the way we work needs to change even faster. We’re facing
the greatest threats in history: global challenges like climate change, resource scarcity and
{ Committing to a consumer-centric plastic pollution are leading consumers around the world to seek a more sustainable way
ESG strategy (The Kirei Lifestyle of living. Through our products and presence in everyday life, we know that we have an
Plan) that focuses on both the increasingly important role to play in delivering more sustainable products and empowering
individual and society as a whole consumers to live more sustainable lifestyles.
{ Set ambitious long-term Since we were founded in 1887, Kao has been committed to serving people, their families,
commitments that are focused on their communities and our planet, while helping them live more sustainably – we call this
your material issues and aligned philosophy the Kao Way. It’s why we have developed and committed ourselves to a new
with your corporate purpose. ESG (Environmental, Social, and Governance) strategy called the Kirei Lifestyle Plan. ‘Kirei’
means beautiful and clean, both on the outside and on the inside.
{ Collaborate with key partners
to share goals and develop joint
As part of achieving this, we’ve developed a highly concentrated liquid detergent with high
initiatives to reduce your emissions
washing power which means only one rinse cycle is needed, reducing water and cutting
and accelerate progress on other
targets. energy use. Similarly, we make our dishwashing detergents with foams that lather and rinse
quicker, helping our consumers reduce the amount of water they use by 20%.
{ Support your sustainability strategy
with clear targets for each division Working within the beauty and personal care industry, we’re also acutely aware of the
in your organization, and activities serious impact of plastics on our natural environment and the need for urgent action to
that outline how your employees reduce their level of use and ensure that those we do use are always re-used or recycled.
can contribute towards these That’s why we have launched refill packaging for almost 300 of our products, resulting in a
73% decrease in plastic packaging use in personal care and household in 2018, compared
{ Commit to research and to a ‘do nothing’ scenario.
development to meet the increasing
demand for sustainable living. To decrease our environmental impact and reduce our carbon emissions even further, we’re
now using 100% renewable electricity in our manufacturing sites across Europe and the US,
as well as in Ehime in Japan, and have committed to purchasing 100% renewable electricity
supplies across all our sites by 2030. Through such measures, renewable energy now
accounts for 20% of our global power consumption. This has resulted in an approximate
65,000-ton annual reduction in our CO2 emissions (2018).
Another key issue we are dedicated to addressing through the Kirei Lifestyle Plan is
deforestation. We have already achieved 100% in traceable paper and pulp use in Kao
consumer products and packaging. And by 2020, we aim to purchase only recycled or
sustainably sourced paper for use in our products, our packaging materials and our offices.
Additionally, we use questions from the CDP programme to assess our suppliers, evaluate
the sustainability of their practices and provide consultation to help them improve their
management of these commodities. We are now in our second year of this CDP SC Forest
assessment process and believe it provides suppliers with concrete ideas for building
change.
Moving forward, we will continue improving our operations and reducing our environmental
impacts by:
{ building innovative partnerships to improve traceability of commodities that are used across
our product line, such as palm oil;
{ working more closely with the smallholder farmers who supply us to ensure their
practices are environmentally responsible and sustainable;
{ and driving further innovation in water and materials efficiency through our products,
operations and supply chain.
We dedicate all our operations to enabling our consumers to live more sustainably and
make a positive contribution to the world, as envisioned by the United Nations Sustainable
Development Goals. Through our Kirei Lifestyle Plan, we will continue to realise our
commitment to making every day more beautiful, making thoughtful choices for society,
and making the world healthier and cleaner.
Dave Muenz, Executive Officer, ESG Global, Kao Corporation
11Japan Tobacco Inc.
Food, Beverage & Agriculture, Japan
To create a sustainable
and inclusive future, we
consider the respective
interests of consumers,
shareholders, employees,
and wider society.
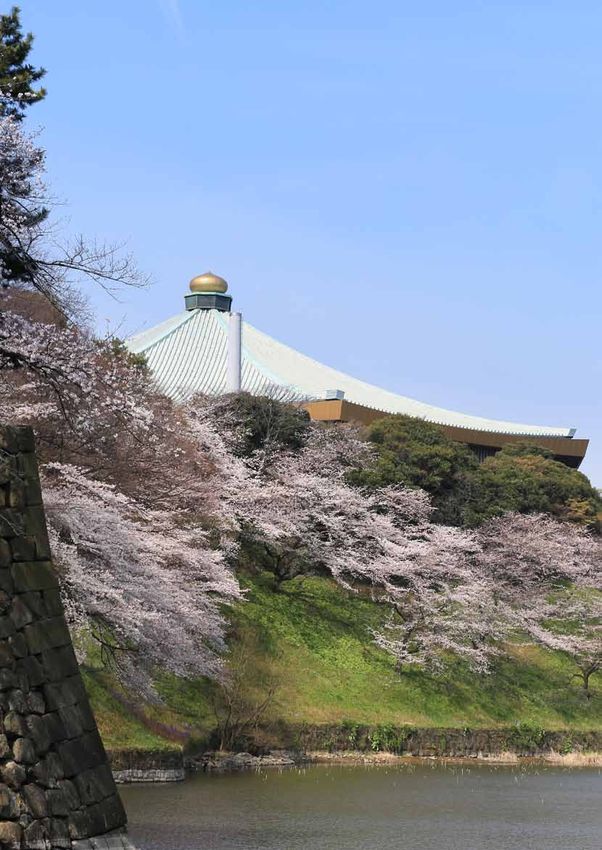
Live barn in Malawi
12Tips for success JT Group has offices and factories in more than 70 countries and regions and we sell our
products in more than 130. In addition to our tobacco business, we have pharmaceutical
{ Consider various stakeholders: and processed food businesses.
our 4S model places the
expectations of our stakeholder Our management principles and our approach to sustainability are governed by our 4S model.
groups (consumers, shareholders, Through this, we strive to fulfill our responsibilities to our valued consumers, shareholders,
employees, society) at the heart of employees, and the wider society. We carefully consider the respective interests of these
everything we do. four key stakeholder groups, and exceed their expectations wherever we can. JT Group’s
CEO, Masamichi Terabatake explains: “Sustainability calls for our management to have a
{ Focus on the important topics: broad long-term perspective, and to ensure the business continues to create value, thus
we have identified and prioritized ensuring the sustainability of our business and of society, over the long term.”
sustainability issues material to our
business and our stakeholders.
With sustainability at the heart of our management approach, we reviewed our organizational
structure in early 2019. We created a Sustainability Management Division at the JT Group
{ Establish a sustainability strategy head office in Tokyo and appointed a dedicated Senior Vice President for Sustainability. This
with long-term targets: we look
beyond our usual planning cycle followed the launch of our Sustainability Strategy in 2018.
to consider the longevity of our
business as well as the future of our Our strategy is underpinned by three ‘absolute requirements’ for sustainability which apply
planet. to the whole Group: Respect for Human Rights, An Improved Social and Environmental
Impact, and Good Governance and Business Standards. We then identified key focus areas
{ Develop clear plans and metrics through materiality assessments and engagement with stakeholders. Our core business,
to achieve your strategy: we tobacco, has already set out its four focus areas and specific targets, which provide a solid
implemented the JT Group basis for measuring and benchmarking our sustainability performance, and support the
Environment Plan 2030 to further sustainability of the JT Group. As of December 2019, our pharmaceutical division and
reduce the environmental impacts processed food business are currently defining their respective approaches.
of our business.
In addition, we have determined how our approach to sustainability is aligned with the United
{ Promote initiatives by forming Nations Sustainable Development Goals (SDGs), which form the blueprint for the world
cross-functional teams: to achieve a more sustainable future. We mapped the activities of our tobacco business
crossfunctional approaches against all 17 SDGs and concluded that the business contributes most significantly to nine
provide us with different of them. We intend to undertake the same process for the other two businesses in the
perspectives to address risks and Group.
realize opportunities.
To translate into action the absolute requirement for ‘Improved environmental impact’,
we have published a new Group Environmental Policy. This outlines our overall intention
and direction in relation to how we manage our environmental impact. In turn, the Policy is
supported by our new ‘JT Group Environment Plan 2030’ which we launched in mid-2019.
To develop the plan, we identified our key environmental risks and opportunities. From
these, we established the focus areas, namely “Energy and Emissions”, “Natural Resources”
(water and forestry) and “Waste”. Our Plan contains longer-term objectives for energy and
emissions, along with quantified targets to be achieved by 2030 for all focus areas. It also
sets out a commitment to transition our operations to net zero carbon energy supply. To
help track our performance, we have also set a long-term Greenhouse Gas emissions
reduction target, in line with the Paris Agreement and which was validated by the Science
Based Targets initiative (SBTi) in February 2019. Going forward, we will be conducting
climate scenario analysis to provide a longer-term perspective on risks from climate change
and how we need to manage those risks.
Within an organization of the scale and complexity of the JT Group, no single function can
implement our Sustainability Strategy and Group Environment Plan alone. We promote
cross-functional working in terms of geographies, businesses and departments. By doing
this, we better identify our risks and opportunities, implement robust action plans to address
these, and share learnings and good practices. These are all essential to deliver on our
sustainability commitments.
13Investor Case Study
SMBC - Amundi Climate ActionTM expected to generate economic value through efforts to
take action against climate change.
Amundi Japan
The objective of SMBC・Amundi Climate ActionTM is
World’s first use1 of CDP climate change scoring for to provide opportunities for Japanese retail investors
the selection of investment candidates to participate in action against climate change through
Launched an investment trust that takes action against investment, and thereby enable them to support the
climate change achievement of sustainable growth by the investee
companies and by society.
CPR AM, a pioneer of responsible investing and a
subsidiary of Amundi, Europe’s largest asset manager TM = Trademark registration pending
1 Source: CDP press release issued January 31, 2019
by assets under management,2 on December 7, 2018, (https://www.cdp.net/en/articles/investor/cpr-am-and-cdp-launch-climate-fund)
launched CPR Invest – Climate Action (Luxembourg) 2 Source: Investment & Pensions Europe; “Top 400 Asset Managers” (June 2019 edition; ranked by
global assets under management on December 31, 2018).
as a fund that for the first time1 in the world used CDP
climate change scoring for the selection of investment
candidates.
Amundi Japan considers that it is highly significant
that through the investment to make societal and
environmental impacts and provide Japanese retail
investors the opportunity to contribute to the achievement
of a sustainable society and the United Nations
Sustainable Development Goals (SDGs). Accordingly,
on June 14, 2019, it launched SMBC・Amundi Climate
ActionTM as a publicly offered domestic fund for which
CPR Invest – Climate Action is its primary investment.
CPR Invest – Climate Action focuses on companies
that have a high CDP climate change scoring and are
Mizuho Eco Finance to reducing greenhouse gas emissions from our own
business activities.
Mizuho Financial Group
The "Mizuho Eco Finance" is a loan program provided
In June 2019, Mizuho Bank, Ltd. and Mizuho Information by Mizuho Bank to clients whose initiatives meet
& Research Institute, Inc. (“MHIR”) launched a service a certain level on a scoring system based on an
entitled Mizuho Environmentally Conscious Finance environmental assessment model developed by MHIR
(“Mizuho Eco Finance”) through which we will take action which incorporates globally reliable environmental
alongside our clients to advance the shift to a low-carbon verification and evaluation program, such as SBT
society. (Science Based Target) and S&P/JPX Carbon Efficient
Index. Through dialogue under this service as a start, we
As efforts on mitigation and adaptation against climate deliver supports in the forms of advices and funds to our
change have progressed around the world, and given that client companies on the one hand, including evaluation
climate change has the potential to have a significant on whether their GHG reduction targets would be in
impact on the business activities of borrowers, we line with the Paris Agreement goals, as well as to their
recognize the need for the , as a financial supply chain, both upstream and downstream, aiming to
institution, to evaluate the efforts of our clients to deal promote decarbonization of an entire society.
with climate change and, in particular, support their
further efforts through financing and advice, in addition
14Efforts to create a sustainable through engagement, and strengthen efforts for loans in
which the use of funds is closely linked to ESG elements,
society at banks and loans that support customers’ ESG measures and
information disclosure.
- Promotion of ESG linked loans –
Sumitomo Mitsui Banking Corporation Sumitomo Mitsui Banking Corporation has been
providing corporate loan products to support customers’
In 2019, we continued to see frequent occurrences sustainability management. In 2018, we commenced
of floods and droughts around the world that were with the arrangement of syndicated loans that come
suspected to be linked to climate change, and Japan with ESG evaluation reports. The syndicated loans were
suffered record damage due to large typhoons and offered to customers in a wide range of sectors, and we
heavy rain. The importance of countermeasures against think that ESG linked loans have spread to participating
climate change risk and information disclosure is domestic financial institutions. Since December 2019,
increasing even more for all companies amid growing we have started handling sustainability linked loans that
concerns over the impact of increasing natural disasters link the status of ESG initiatives and lending conditions
on business activities. In the Japanese financial market, using CDP’s disclosed information on climate change
ESG linked loans have started to spread full scale and data on ESG assessment agencies in cooperation
following the expansion of ESG investment in stocks and with the Japan Research Institute, our group company
bonds, in response to the will of investors and financial with abundant ESG knowledge. We will continue to
institutions who want to fulfill the responsibilities contribute to the improvement of customer corporate
necessary to form a sustainable society. values and the sustainable development of society.
In ESG linked loans, which are indirect financing, I
believe it is important for banks that are responsible
for ESG linked loans to share issues and goals for the
advancement of customers’ sustainability management
15Japanese Company response to CDP 2019
63%
2019 marks CDP’s 17th global climate survey, and The results of Japan 500 selected companies
is the 14th time Japanese companies have been show that 36 companies2 (12%) scored an A and 58
asked to respond. Between 2006-2008 responses companies (19%) ranked A- in 2019. The majority
were sought from 150 Japanese companies, this of companies (112 companies, representing 37%)
Japan 500 response rate number grew in 2009, when 500 companies were scored a B (Figure 1). Encouragingly the number of
(316/500) selected based on the FTSE Japan Index (hereafter companies scoring A and A- has increased, while
referred to as Japan 500). the number scoring C and D has to decreased.
Although there are differences between the
This report mainly analyses the status of industries, companies that manage their response
356
respondent companies in Japan 500. Since the to climate change in their own business are
number of voluntary respondents is increasing gradually beginning to lead the market, and there
year by year, it also includes the response status of is a tendency to be polarized with C and D rank
firms other than Japan 500. This report focuses on companies in terms of disclosure information.
Number of total response to some of the most notable questions.
The response rates of Manufacturing and
responding companies From 2018, the contents of the recommendations Materials sectors were very high, at 83% and 80%,
of the Task Force on Climate-related Financial respectively. Meanwhile the Services and Retail
Information Disclosure (TCFD) were reflected sectors lagged behind, with the lowest response
38
in CDP's Climate Change Questionnaire. The rates (46% and 40% respectively).
responses analyzed within this report represent
the second round of disclosures since this major Sectors leading the scores are Food, Beverage
revision to the question structure was made.In and Agriculture (A/A- 35% of the 74% response
A list companies 2019, 97% of the questions remained unchanged rate), Infrastructure (A/A- 57% of 57%) , and
from 2018, with only minor changes. Sector- Manufacturing (A/A- 33% of 83%). Their relatively
specific questionnaires were sent for sectors high response rates indicate that the sectors as a
related to "Agriculture," "Energy," "Materials," whole are taking a strong stance of climate change
and "Transportation," whereas the request for issues. In the retail sector, the response rate is low
responding to a Finance-sector questionnaire was at 40%, but 43% of the responding companies are
deferred. ranked A or A-, suggesting that companies in the
sector are polarized in their response to climate
Response status change. Meanwhile, the response rate of the power
This year the number of respondents out of the 500 generation sector, which has historically had a low
companies questionnaires were sent to - including response rate, exceeded 50% in 2018, rising to 70%
responses by group companies (SA) - grew to 316, this year, and it can be said that it is a sector that
19 more than in 2018. As such, the response rate actively engages in information disclosure (Figure
of the Japan 500 in 2019 was 63%, increasing 2).
from last years 59%. Despite the introduction
of a fee-based response in 2018, we’re seeing a Governance
growth in the number of Japanese companies With the introduction of the Corporate Governance
actively disclosing their efforts on climate change, Code in Japan and the emphasis on TCFD
highlighting the increasing global awareness of recommendations, climate governance is a hot-
the topic.In this report, the analysis is based on a button topic.
total of 343 companies excluding SA and including
Japanese companies other than Japan 500. 92% (a 1% percentage point increase from 2018)
report that their Board of Directors have oversight
Scoring on climate change issues (C1.1) (Figure 3), with
The CDP scoring uses a band system of 25% of companies reporting that these issues
information disclosure, recognition, management, are covered in all their meetings(Figure 4). 55% of
and leadership. The scores are from A to D from the companies responded that they had "some planned
2 In addition to 36 companies, two companies
other than Japan 500 have been selected as A-list top to the bottom (A- to D- also exist if each does meetings", 8% more than last year. Including this,
companies. not reach the reference point). After a quantitative 80% of companies said that they regularly discuss
3 CDP has developed and adopted a unique sector scoring based on a scoring methodology is climate change issues with the board of directors.
classification, CDP-ACS (Activity Classification
System). Details of the sector classification can be
performed, the final score is determined by a In some Japanese companies, issues related to
found on the website. threshold. climate change are being discussed at the board
level as a factor of risks and opportunities.
16Figure 1. Score distribution of Japan 5002 Figure 2. Score by industrial sector, Japan 5002
100%
100
40% 04
53 80%
Biotech, Health Care and Pharma
80
Food, Beverage, and Agriculture
30% 03
60%
60
52
Transportation Services
20% 02
40%
Power generation
40
51
Manufacturing
Infrastructure
10%
Fossil Fuel
Hospitality
01
20%
Materials
20
Services
Apparel
5
Retail
0% 0 0%
0
D- D C- C B- B A- A Response 0% 71% 74% 100% 14% 57% 83% 80% 70% 40% 46% 52%
rate
# of target 1 31 31 5 7 37 122 60 10 57 112 27
2019 2018 companies
■ A ■ A- ■ B ■ B- ■ C ■ D ■ D-
■ SA (See another) ■ Not scored
Figure 3. Board-level oversight of Climate Figure 4. Board's oversight of climate- Figure 5. Does your organization use
related issues related issues - Frequency climate-related scenario analysis to
inform your business strategy?Figure 6. Use of climate-related Strategy and scenario analysis Future risk is the most highly considered risk
scenario The climate change scenario analysis is a new amongst companies (C2.2a), with 72% of
question added in 2018 based on the TCFD respondents answered that they considered risks
recommendations. In Japanscenario analysis has beyond a 6 year period, up from 61% last year.
attracted the interest of companies. When asked if 17% of companies do not consider risks beyond a
21% they use climate change-related scenario analysis six year period, down by 10% in 2018 and by 37%
in their business strategies, more than half of all from 2017. This also seems to be linked to the
48% respondents (53%) reported using qualitative and increasing number of companies that incorporate
/or quantitative measures, up 6% from 47% last scenario analysis and strategy development
year. Additionally, 34% of respondents who have from a long-term perspective accompanying the
31%
not done so yet report that they will do so within TCFD recommendations into their organizational
two years, and 87% of companies believe that structures (Figure 9).
analyzing climate change scenarios is a necessary
Multiple scenarios business strategy (Figure 5). As for risk recognition, more than 80% of
Single scenarios companies said all these physical and transition
Not using scenarios As for the types of scenarios used in the scenario risks were relevant. In terms of the breakdown of
analysis, RCP2.6 was the most used by companies, risk recognition, 75% of companies say that they
followed by 2DS and NDCs. Furthermore, some always include acute risks and 67% of them include
21% of companies are conducting analysis using chronic risks as relevant in their assessments.
multiple scenarios.(Figure 6). Figure 7 explores the Organizations are most aware of current regulation
different scenarios companies are analyzing. as a transitional risk, followed by market, emerging
Figure 7. Climate-related regulation, and technology (Figure 10).
scenarios and models applied Risks and opportunities
(Top 10) From 2018, risk and opportunity responses are This data shows that acute physical risks are highly
consistent with TCFD recommendations, by recognized, as typified by the damage caused by
10
20
30
40
50
60
70
80
0
detailing their classifications and financial impacts, recent large typhoons and river flooding. More
RCP 2.6 Risks are classified by physical risks (acute and than 70% of companies say that any transition
63 chronic) and transition risks (regulations, markets, risks are always included in the risk assessment
technologies, reputations, etc.) in detail, and five as related risks. As mentioned,it appears that the
2DS categories have been introduced for opportunities, organizational structure that assesses risks related
including resource efficiency, energy sources, to climate change from a long-term perspective is
53
products and services, markets, and resilience. becoming more pervasive in companies and has
Regarding the frequency of assessing these led to the practice of scenario analysis.
Nationally determined contributions
climate change risks, 19% of companies said that
42 they evaluate it once a year, and 69% of companies As for the opportunities related to climate change
evaluate it once every six months or more (C2.4a), companies with over 600 employees
RCP 8.5 frequently. The percentage of firms that responded overwhelmingly view products and services
33 with an evaluation frequency of at least once a as the greatest opportunity About half of them
year is 88%, almost the same as last year's 87%, (311 in 2019 and 297 in 2018) are expanding the
IEA 450 but the number of companies that evaluate more development of low carbon products and services
24 frequently than half a year or more has increased (Figure 11).
from 63% last year (Figure 8).
IEA Sustainable development scenario
20
IEA NPS)
13
RCP 4.5
10
IEA B2DS
7
RCP 6
5
0 20 40 60 80
18Figure 8. Identifying and assessing climate-related risks - Figure 9. Identifying and assessing climate-related risks - How
Frequency far into the future
1%
2% 1%
10% 7%
10%
10% 14%
Up to 1 year
19% Six-monthly or more frequently 1 to 3 years
Annually 3 to 6 years
Other >6 years
69%
N/A 72% Unknown
N/A
Figure 10. Climate-related risk types considered in risk Figure 11. Climate-related opportunity driver
assessments
80
80%
Current
regulation 70
61%
60
60%
Emerging
regulation 50
Technology 40
40%
Goods and Services
Resource efficiency
Energy efficiency
30
Legal
20
20%
Resilience
11% 11% 12%
Markets
Market 10
5%
0%0
Reputation
Acute physical
Chronic physical Figure 12. Climate-related opportunity driver (Goods and Services)
60%60
Upstream
51%
50
Ability to diversify business activities
Development of new products or services
Downstream
Development of climate adaptation and
0% 20% 100 40%150 60% 350 40%40
80% 300 100%
Shift in consumer preferences
0 50 200 250
Development and/or expansion of
low emission goods and services
through R&D and innovation
Relevant, always included Relevant, Not relevant, explanation provided 30
insurance risk solutions
sometimes included Not evaluated
Relevant, not included No response 20%20 17% 15%
Not relevant, included N/A
10%
10
4% 3%
Other
0% 0
19GHG emissions reduction target companies in 2018). 51 companies set the target
Regarding the Scope 1 and 2 emissions reduction year of 2050 (38 companies in 2018) (Figure 14).
targets, 40% of companies that set absolute The number of companies that set medium-term
emissions targets stated that they are science- targets for 2030 is 60% higher than last year.
based targets (SBT), which is up from 38% in 2018,
and has increased 2.5 times from 16% in 2019. In Disclosure of Scope 2 & 3 emissions
the same manner as last year, 85% of companies The calculation method of Scope 2 emissions
responded in the same positively to SBT’s, and (location-based, market-based) following the
either intend to incorporate and SBT into their revision of the GHG protocol has been adopted for
current target, or set one within two years (Figure four years. Until now, the number of companies
13). reporting on a market basis has gradually
increased, and in 2019, about 80% of companies
14% of companies that set emissions intensity reported emissions on a market basis, a further
targets have an SBT. The total ratio of the increase of about 10% from 70% in 2018. The
companies is 74% if those which have another number of companies reporting on location basis
target that is science based and those which plan is 81%, up from 76% last year. (Figure 15).
to set within 2 years are added. Although the ratio
is slightly lower than the absolute emissions target For the calculation status of Scope 3, 157
companies, more than 70% responded positively to companies selected any of “Relevant, calculated,”
SBT’s (Figure 13). “Not relevant, calculated,” and “Not relevant,
explanation provided” (66 companies in 2015, 101
Another important point is the target year in the companies in 2016, 109 companies in 2017, and
reduction target, in which medium- to long-term 157 companies in 2018). Approximately half of
target setting is expected. In this regard, 131 the respondents performed anevaluation for all
companies have relatively short-term target year of 15 categories. It’s clear companies are beginning
2020 (99 companies in 2018) and 132 companies to calculate not only their own emissions, but the
have medium-term target year of 2030 (83 emissions of their supply chain.
Figure 13. Science Based Target (Outer; Figure 14. Target year (Scope 1, 2 emissions) Figure 15. Scope 2 reporting (Outer:
Absolute target, Inner: Intensity target) Location based, Inner: Market based)Trend for third-party verification (assurance) however response rates were low, indicating that
Proportion of companies with third-party verifi- only a small number of conscious companies are
cation responding.
The number of companies that undertook third-
party verification has been increasing, as shown Verification standards
in Figure 17. Of the responding companies, the The adopted verification standard was 44%4 for
proportion of companies that undertook third- ISO 14064-3, 19%4 for ISAE 3000, 18%4 for ISAE
party verification is 65% for Scope 1 and Scope 2, 3410. These proportions are large, accounting for
and 52% for Scope 3. The growth rates from the 80% of the whole (Figure 19).
previous year were 14% for Scope 1 (203 -> 231),
14% for Scope 2 (203 -> 232), and 19% for Scope Figure 20 shows the global situation. As in Japan,
3 (154 -> 184). The proportion of companies with verification standards were centered around ISO
third-party verification worldwide is 63.4% for 14064-3, ISAE 3000, and ISAE 3410, accounting
Scope 1, 62% for Scope 2, and 47% for Scope 3, for 73% in total. We can see that Tokyo Metropoli-
so there is no major difference in comparison to tan and Saitama emissions trading scheme, which
Japan. account for about 10%, differ from the worldwide
average.
Figure 18 shows the status of third-party
verification in the top 15 countries’ GHG emissions. The number of companies that undertook third-
The ratios for China and the United States, which party verification for 70% or more of their gross
rank first and second in GHG emissions, were emissions was 191 (83%) for Scope 1 and 189
lower than the global average. On the other hand, (82%) for Scope 2. Here Japanese companies are
in Germany, France and Italy, we’re seeing a high lagging slightly behind the rest of the world, where
number of companies reporting seeking third-party the global average 87% for Scope 1 and 85% for
verification. Scope 2.
In terms of response rates, Japanese companies As mentioned above, in Japan nearly 10% selected
had the highest response rate, and also Tokyo and Saitama prefectural verification stan-
demonstrated a higher than average rate of third- dards. This is one of the reasons why there is a
party verification, confirming that awareness in higher number of companies with third-party veri-
Japan is improving overall. South Korea, Mexico fication scope under 70% compared to the rest of
4 Weighted average of Scope 1 and 2 responses and Brazil have high ratios of third-party verification, the world.
Figure 16. Evaluated scope 3 categories Figure 17. The number of companies with third-party
verification or assurance
1. Purchased goods and services 80% 146
2015 148
2. Capital goods 78%
87
3. Fuel- and energy-related activities
(not included in scope 1, 2) 82%
4. Upstream transportation 150
79%
and distribution 2016 152
5. Waste generated in operations 80% 98
6. Business travel 82%
168
7. Employee commuting 82% 2017 170
8. Upstream leased assets 123
80%
9. Downstream transportation 74%
and distribution 203
10. Processing of sold products 71% 2018 203
154
11. Use of sold products 72%
12. End-of-life treatment of 72% 231
sold products
2019 232
13. Downstream leased assets 80%
184
14. Franchises 88% 0 50 100 150 200 250
0 50 100 150 200 250
15. Investments 75%
0%
0 20 40 50%
60 80 100%
100 Scope 1 Scope 2 Scope 3
21Figure 18. Ration of companies with third-party verification or assurance in descending order of emissions by country
100 100%
80 80%
60 60%
40 40%
20 20%
0
0%
China US India Russia Japan Germany South Canada
Korea
Indo-
nesia
Mexico Brasil Australia UK Italy France Other Over
all
Scope 1 Scope 2 Scope 3 Response rate
Figure 19. Proportion of used verification standard (Japan) Figure 20. Proportion of used verification standard (Global)
3%
2%
6%
16%
9%
3%
3% 37%
44%
5%
18%
8%
19%
28%
ISO14064-3 ISO14064-3
ISAE3000 ISAE3000
ISAE3410 ISAE3410
Tokyo and Saitama verification standards A1000AS
A1000AS ASAE3000
ASAE3000 EU ETS
Other Other
22Climate change information disclosure recommendations, formulating strategies based
An increasing number of companies are considering on scenario analysis.
the financial impact of climate change, and
including climate related risks and opportunities In 2019, 38 Japanese companies were on the A
in other reports, including their financial reporting. list, up 18 (1.9 times) from last year. Leadership
points can be scored only when management
190 companies are releasing information in their issues on climate change are actively monitored
voluntary sustainability reports (169 in 2018), by the board level; risks and opportunities are
fwhile 148 companies publish it in mainstream appropriately identified and evaluated, and
reports, which is a significant increase from 108 they are reflected in the organization’s strategy
companies last year. In the meantime, 114 firms including scenario analysis; and certain criteria
report in voluntary communications (118 in 2018). are met, such as setting ambitious targets and
indicators, measuring outcomes, and having
For mainstream reports, 27 companies (7 emissions verified by a third party.With the rise in
companies in 2018) disclosed based on TCFD A List companies in mind, it’s positive to see the
recommendations, and 7 companies (14 number of organizations submitting high-quality
companies in 2018) replied that the disclosure disclosures and addressing climate change issues
was based on the CDSB (Figure 21). showing steadily increasing year on year.
the increasing number of companies that have
indicated support for the TCFD recommendations. Considering the increase in the number of
Japanese companies that have expressed support
Conclusion and future prospects for the TCFD recommendations, it is expected
In 2019 the response rate of the Japan 500 was that the number of companies disclosing to CDP
the highest it has ever been, exceeding 60% for the and working to address their climate impact will
first time. However, the rate differs significantly continue to increase.
between sectors, and is under 40% in some
sectors. It’s clear then that, while the response rate As discussions of climate change issues continue
is gradually increasing, we’re seeing a polarized to make their way onto Japanese companies’
response from sectors, and must continue to board agendas, and the rate of scenario analysis
target non-responders.. continues to grow, we can expect to see the
management strategies of Japanese companies
In sectors where the response rate to CDP is high change dramatically as they become more strongly
and the disclosure rate is increasing, we can see aware of climate change.
that climate actions such as responses to TCFD
recommendations, strategies, and efforts to As companies increasingly come under pressure
reduce CO2 has been converging at a faster speed. from investors, employees and citizens to address
their climate impact, and ESG reporting continues
With ESG investment receiving more attention, it is to move further into the mainstream for Japanese
becoming increasingly important for companies to companies, we expect to see Japanese companies
disclose ESG information to investors, and some step up their efforts, and work to build a sustainable
companies are demonstrating in their response business model that benefits both society, and
an increased awareness of the importance of their businesses.
taking actions such as disclosing via TCFD
Figure 21. Published information
200
In mainstream reports, in accordance with
In mainstream reports, in accordance with
200
150
190
In voluntary sustainability report
182
In voluntary communications
150
In other regulatory filings
100
TCFD recommendations
In mainstream reports
100 114
CDSB framework
50
50
48
Other
7 27 21
0 0
23You can also read