CENTRAL PARK - WILTON B RECONDUCTORING - LISTED PROJECT APPLICATION - Commerce Commission
←
→
Page content transcription
If your browser does not render page correctly, please read the page content below
CENTRAL PARK – WILTON B
RECONDUCTORING
LISTED PROJECT APPLICATION

Transpower New Zealand Limited
February 2017

    CENTRAL PARK – WILTON B RECONDUCTORING © Transpower New Zealand Limited 2007. All rights reserved.   i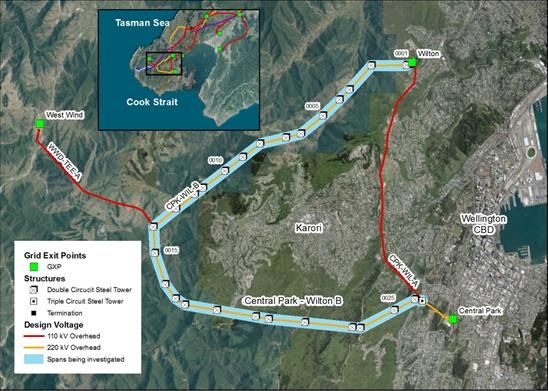
Table of Contents

Executive Summary ...................................................................................................4
1        The proposal....................................................................................................5
2        The Need.........................................................................................................6
2.1         Asset condition .............................................................................................7
2.1.1              ACSR conductor failure .........................................................................8
3        Options, costs and benefits............................................................................10
3.1         The options ................................................................................................10
3.1.1              Long list of options ..............................................................................10
3.1.2              Short list of options..............................................................................10
3.2         The costs and benefits ...............................................................................12
3.2.1              Key assumptions, constraints, risks ....................................................12
3.2.2              The Costs ...........................................................................................12
3.2.3              The Benefits ........................................................................................13
4        Selecting the proposal ...................................................................................13
4.1         Selection of the proposal ............................................................................13
4.1.1              Economic assessment ........................................................................13
4.1.2              Unquantified benefits ..........................................................................14
4.2         Robustness of the preferred option ............................................................15
4.2.1              EDGS scenarios .................................................................................17
5        Timing............................................................................................................17
6        Good electricity industry practice ...................................................................17
7        Stakeholder engagement ...............................................................................18
8        Listed Project Capex Allowance.....................................................................18
8.1         The difference between Base capex and a listed project ............................18
8.2         Our approach for this project ......................................................................19
8.3         Deriving the LPCA for this project ..............................................................20
9        CommunityCare Fund....................................................................................21
10       Effect on transmission charges ......................................................................22
A.1      Capex IM requirements .................................................................................23
A.2      Changes in costs from prior estimates ...........................................................24
A.3      Demand and generation assumptions ...........................................................25
1.1         Demand .....................................................................................................26

2     CENTRAL PARK – WILTON B RECONDUCTORING © Transpower New Zealand Limited. All rights reserved.
A.4    Peak demand forecasts .................................................................................27
A.5    Attachments ..................................................................................................28

CENTRAL PARK – WILTON B RECONDUCTORING © Transpower New Zealand Limited. All rights reserved.                        3
Executive Summary
This document is our application to the Commerce Commission seeking approval to
increase our Base Capex Allowance for the costs of our proposal to reconductor the
Central Park – Wilton B line.

The Central Park–Wilton B line is a 12.5 km 110 kV double circuit line between our
Central Park and Wilton substations. Conductor condition assessment has determined
that the conductor requires replacement in the near future.

Our Central Park substation has the largest grid offtake in the Wellington region and is
essential for supply to the southern and eastern suburbs and much of central
Wellington.

Meridian’s West Wind windfarm is also connected to the grid via a double tee onto the
Central Park–Wilton B line.

In assessing our RCP2 proposal the Commerce Commission determined that
additional information was required for some projects and introduced a new category
of “Listed Projects” which are Base Capex projects required to follow a commensurate
Major Capex Proposal process for approval.

This is our first Listed Project application.

         Proposal at a Glance
         What:               Replace the existing conductors on the Central Park to Wilton B
                             line with AAAC Sulphur rated to operate at 70°C.
         When:               Commence work in Q1 2019 and complete by Q2 2019
         How much:           Our cost estimate for this project is $11.3 million. Uncertainties
                             mean it may cost up to $12.4 million.

This investment is in the interests of our customers and electricity consumers because
it will deliver a resilient, cost effective transmission service. Security of supply to
Wellington Electricity and energy output from West Wind is contingent on the Central
Park – Wilton B line being maintained and fit for service.

The work will be completed by winter 2019.

4    CENTRAL PARK – WILTON B RECONDUCTORING © Transpower New Zealand Limited. All rights reserved.
1 The proposal
This proposal concerns the Central Park – Wilton B line, a 12.5 km 110 kV double-
circuit line between our Central Park and Wilton substations. Conductor condition
assessment has determined the conductor requires replacement in the near future.
The line was first commissioned in 1978. It is presently strung with duplex Zebra
ACSR/GZ conductor between Wilton and tower 26 (11.7 km), with the last five spans
to Central Park being strung with simplex Chukar ACSR/GZ conductor. The five
Chukar spans into Central Park have been reconductored previously and the latest
condition assessment data indicates that it has 10+ years' service remaining. This
proposal concerns reconductoring the line (which is a part of the core grid) between
Wilton and tower 26 only.
The components in the box below are the grid outputs to be delivered by the project.
Grid Outputs
Decommissioning and removing the existing duplex conductor on the Central
Park – Wilton B line between Wilton and tower 26
Procuring, installing and commissioning conductor with like-for-like capacity
Expenditure outgoings up to, $000:
Year Amount
2016/17 280
2017/18 307
2018/19 1,089
2019/20 10,749
Total 12,425
with commissioning occurring in 2019/20 year.
Reconductoring of the entire Central Park – Wilton B line was put forward in our RCP2
proposal with a provisional estimate of $24m (inclusive of the Chukar section and a
temporary bypass). The Commerce Commission (Commission) determined that
additional information was required and introduced a new category of “Listed Projects”
which are Base Capex projects required to follow a commensurate Major Capex
Proposal process for approval.
Largely because we are not reconductoring the Chukar section now, the expected cost
of the project (including contingencies, inflation and interest) has reduced to $11.3
million once commissioned. We are seeking approval to increase our Base Capex
Allowance by an amount we are calling the Listed Project Capex Allowance (LPCA).
The LPCA includes a contingency to allow for uncertainties in the project costs that are
CENTRAL PARK – WILTON B RECONDUCTORING © Transpower New Zealand Limited. All rights reserved. 5outside of our control, and also includes interest during construction (IDC). The LPCA
for this project is $12.4 million.
We plan to complete this work by winter 2019.
2 The Need
The Central Park – Wilton B line is a 12.5 km 110 kV double-circuit line between our
Central Park and Wilton substations.
Central Park, Wilton and the lines between the two are shown diagrammatically in
Figure 1 and photographically in Figure 2.
Haywards & Takapu Road
Bunnythorpe & Haywards
220kV CIRCUIT
Kaiwharawhara 110kV CIRCUIT
SUBSTATION BUS
TRANSFORMER
Wilton 11 kV
UNDERGROUND CABLE
LOAD
220 kV
TEE POINT
33 kV 110 kV MULTI-CIRCUIT TOWER
11 kV
Central Park
West Wind
33 kV
Central Park –
Wilton B
Figure 1 – Network diagram of Central Park and Wilton
Figure 2 – Aerial photograph showing Central Park - Wilton B line
6 CENTRAL PARK – WILTON B RECONDUCTORING © Transpower New Zealand Limited. All rights reserved.Central Park substation is an essential part of Wellington’s electricity infrastructure. It
feeds Wellington Electricity’s distribution network and supplies the southern and
eastern suburbs and much of central Wellington.
The Central Park – Wilton B line also connects the 143 MW West Wind wind farm to
the grid via a double tee connection approximately 5.8 km from Wilton.
Our electricity demand forecast for the Central Park substation (see Figure 3) shows it
will be used long term, with only modest demand growth expected out to 2042.
Figure 3 – Central Park electricity demand forecast
2.1 Asset condition
The Central Park–Wilton B line is presently strung with duplex Zebra conductor for all
but the final five spans into the Central Park substation which is strung with a simplex
Chukar conductor. Zebra and Chukar are both types of aluminium conductor with steel
reinforcing (ACSR). The line is in a highly corrosive environment through the presence
of airborne salts as the coast is nearby.
Conductor condition assessment has shown that the Zebra section of the line has
reached replacement criteria and requires replacement in the near future, in
accordance with Transpower's Fleet Strategy: TP.FL 01.00 conductors and insulators.
Conductor condition assessment has been undertaken using several different
methods:
Cormon Testing (using “Eddy Current” technology to estimate the remaining
thickness of zinc or aluminium coating)
Close Aerial Surveys to identify evidence of bulges/defects or areas requiring
further monitoring known as “markers”
CENTRAL PARK – WILTON B RECONDUCTORING © Transpower New Zealand Limited. All rights reserved. 7 Destructive metallurgical testing to investigate the effects of dog bone spacer
damage
The Cormon test results indicate the overall condition of the conductor on this line is
very poor with approximately 44% of the spans showing signs of complete galvanising
loss on the steel core wire. These spans can all be expected to show visible signs of
bulging and loss of aluminium cross section in the next few years.
The visual inspection identified 20 defects and 110 markers, while the two metallurgical
testing samples from 2009 exceeded the 15% aluminium loss criteria. The number of
defects found, and more importantly markers, clearly demonstrates that the conductor
on this line is reaching end of life.1
For comparison, the Central Park–Wilton A line conductor is not due for replacement
until after 2040.
2.1.1 ACSR conductor failure
Aluminium conductor steel-reinforced cable (ACSR) is a specific type of high-capacity,
high-strength stranded conductor. The outer strands are aluminium, and the centre
strand is steel. Extensive study has now found that ACSR/GZ conductors are prone to
accelerated corrosion in salt laden areas as the galvanic cells are formed due to the
dissimilar metals (steel, zinc and aluminium). The addition of grease between the zinc
and aluminium creates a protective barrier against this.
Once the galvanised coating of the steel core has galvanically corroded it is found that
the steel core wire does not corrode appreciably because the aluminium strands
“sacrifice” themselves to protect the steel. Loss of strength therefore occurs from loss
of aluminium section – noted by visible aluminium oxide build up, and in the worst
case, bulging of the conductor.
The Central Park–Wilton B conductor has been found to have widespread corrosion of
the steel core wire and aluminium strands due to ‘grease holidays’; (sections that did
not receive grease during manufacture) and dog bone spacer damage due to the
design of some original conductor spacers.
1
Refer to Attachment A for a full asset condition report.
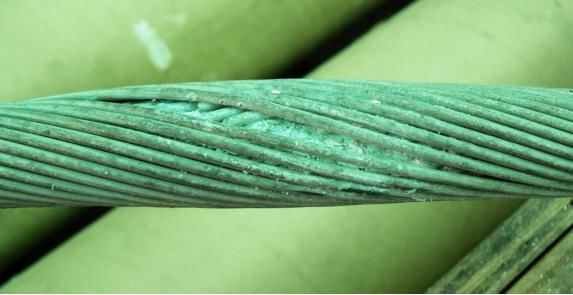
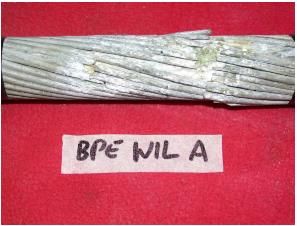
8 CENTRAL PARK – WILTON B RECONDUCTORING © Transpower New Zealand Limited. All rights reserved.Figure 4 - Conductor bulge due to grease holidays (CPK-WIL B Span 14-15) Figure 5- Example of dog done spacer damage as seen on the BPE-WIL A line Experience from previous testing and inspections has established that a galvanised core Zebra conductor of this era has an estimated life of 40 years in a highly corrosive environment. The Central Park–Wilton B line was commissioned in 1978 so the conductor has performed as expected. Until the Zebra conductor is completely replaced, on-going repairs and inspections will be required to ensure the risk of a conductor failure is appropriately managed. This is likely to be in the form of isolated conductor defect removal and close aerial inspections. The four Chukar spans into Central Park have been reconductored previously and the latest condition assessment data indicates that it has 10+ years' service remaining. This section of line will be difficult to reconductor as it is a triple circuit with the same towers and it is necessary to keep at least one circuit in service.2 Limited outage 2We are trialling new catenary reconductoring systems on another project shortly which would make it possible to reconductor the Chukar section with at least one circuit in service. CENTRAL PARK – WILTON B RECONDUCTORING © Transpower New Zealand Limited. All rights reserved. 9
windows restrict the ability to reconductor both Chukar and Zebra sections at one time.
The triple circuit configuration and difficulty getting outages mean that they are
effectively two separate work packages. Consequently, given this and the remaining
10 years of life, the Chukar section has been deferred and is now not included in scope
of this project.
3 Options, costs and benefits
3.1 The options
3.1.1 Long list of options
We initially compiled a long-list of options which fell into four broad categories:
dismantling and not replacing
do nothing
piecemeal replacement
non-transmission solutions
o new generation
o demand side alternatives
transmission solutions
o “like for like” conductor replacement
o different capacity conductors (ranging from 165MVA to 313MVA)
o dismantling and enhancing the A line
o a new line and/or duplexing
o underground cable instead of overhead lines
A public long list consultation and non-transmission solution request was issued in
April 2015 and received one response, from Wellington Electricity, which was generally
supportive of reconductoring. Their short term load forecast projections were lower
than ours, but they noted that a conservative approach to future demand would be
prudent over the asset lifespan.
3.1.2 Short list of options
A shortlist of options was then derived by applying screening criteria.
We have included our assessment of the long-list to short-list process, in preparing
this application, as Attachment B, and have summarised the key points below.
Dismantling the line was considered in the full long list to demonstrate the
benefit of keeping the line. The limited capacity of the existing A line as an
alternative supply to Central Park would result in lost load which is valued well
in excess of the reconductoring cost3. We have estimated the value of this lost
load to be between $30m and $60m (depending on the demand scenario).
Customers would also be exposed to N security conditions which is not
consistent with the Grid Reliability Standards. This option was not taken
forward to the short list.
3
10 CENTRAL PARK – WILTON B RECONDUCTORING © Transpower New Zealand Limited. All rights reserved. Do nothing is not a viable option. Our asset condition assessment has
determined that the Zebra section of the line has reached replacement criteria
so it cannot be left as-is.
Piecemeal replacement where the existing line is maintained with the worst
sections progressively replaced ie a piecemeal replacement over a longer
period of time. This was carried forward to the short list as our Base Case.
Non-transmission solutions are not plausible. We are not aware of any new
(large scale) generation planned in the area nor of any large enough demand
side options (our consultation process raised no alternative options).
Transmission solutions considered reconductoring options. We evaluated a
range of potential conductors for the B line as well as enhancing the A line (and
dismantling the B line).
The A line could be upgraded, however this would require a lengthy
implementation timeframe (more than 5 years) to acquire property
rights, and the costs of upgrading would likely be in excess of $40m, so
this option was not taken forward to the short list.
Full replacement of the Zebra sections of the B line.
Reconductoring options
The B line is currently duplex Zebra with excess transfer capacity for the foreseeable
future (using our latest demand forecasts).
A range of conductors were evaluated during the long-list evaluation which is described
in Attachment B. A concept design study was undertaken for a range of simplex
conductor types, considering the loads on structures, modelling the clearances and
swing distances, but not foundation strengths or construction access requirements.
Some of the smaller conductors have higher levels of conductor swing, which may
incur injurious affection as an additional project cost. Also, as there are forestry areas
under this line, higher swing would require increased clearances which will have
measurable implications. For these reasons, the smaller conductors including
Selenium, Phosphorous and Nobelium were not included on the short list.
Goat was removed because it doesn’t meet future load growth scenarios, and has a
greater swing range than Zebra.
Chukar was excluded because it has a greater tower load requiring foundation
strengthening.
Sulphur and Zebra conductors met all requirements and so along with the Base Case
formed our short list.
Simplex Sulphur AAAC @ 70oC has a rating of 238 MVA, so use of this conductor in
simplex configuration will not reduce the overall line rating and this conductor could
also be thermally upgraded at some later stage, if required.
Simplex Zebra ACSR @ 90oC has a rating of 217 MVA and would also meet our
prudent demand forecast to 2040, although this conductor has no flexibility to be further
thermally upgraded.
CENTRAL PARK – WILTON B RECONDUCTORING © Transpower New Zealand Limited. All rights reserved. 11As demand will be adequately supplied by a simplex configuration we have only
considered simplex options further. An advantage of replacing duplex conductor with
simplex is that tower loadings will lower and so no tower strengthening is required for
these options.
Table 3-1: Summary of long list and shortlist options
Long list option Selected for shortlist?
Piecemeal replacement
Chukar (@75°C)
Zebra (@90°C)
Goat (@75°C)
Sulphur (@70°C)
Selenium (@90°C)
Phosphorous (@90°C)
Nobelium (@90°C)
3.2 The costs and benefits
3.2.1 Key assumptions, constraints, risks
The following main assumptions have been made in developing this business case:
Generation from the West Wind wind farm will not increase substantially for the
foreseeable future.
Winter demand forecasts for Central Park are shown in Figure 3 above. Growth
above a 250 MW peak is considered unlikely before 2040.
Construction outages during summer, (lower loading) period will be available
to carry out the work.
3.2.2 The Costs
The expected “P504” costs (in current (2016) dollars) of the short-listed options are
shown below in Table 3-2.
The last row shows the expected cost of each option expressed as a Present Value
(PV) to account for phasing of the work over the next few years. Since the Base case
option involves expediture over a longer time period, the PV results in a larger cost
discount.
4The P50 cost represents the central point of our forecast range. There is a 50% probability
of the costs being less than this (and 50% probability they will be higher).
12 CENTRAL PARK – WILTON B RECONDUCTORING © Transpower New Zealand Limited. All rights reserved.Table 3-2: P50 Project costs, excluding inflation and IDC
P50 costs $m Base case Sulphur 70°C Zebra 90°C
Line capacity, MVA 235 238 217
Surveys and testing 1.2
Investigation 0.6 0.6
Design & prep work 0.6 1.4 1.4
Construction - labour 12.7 5.2 5.3
Construction - Material & 2.4 1.9 1.7
plant
Other construction costs5 0.4 1.5 1.5
Total Cost 17.2 10.5 10.4
Present Value $11.9 $9.1 $9.0
3.2.3 The Benefits
The only benefit considered in this analysis are the expected difference in the value of
transmission losses over the analysis period with the different conductors, compared
to the Base case. We have expressed transmission losses as another cost.
These were assessed using a power flow model and are shown as their present value
in Table 3-3. This shows that the Base Case has the highest benefit (lowest loss PV).
Table 3-3: Benefit comparison
PV of P50 costs $m Base case Sulphur 70°C Zebra 90°C
Losses 1.5 1.7 2.1
4 Selecting the proposal
This section covers:
selection of the proposal
the robustness of the proposal against changes in assumptions
4.1 Selection of the proposal
4.1.1 Economic assessment
5These are the “Category Two” costs described in Section 9. The costs shown in this table
are the mid-point of the (minimum to maximum) range.
CENTRAL PARK – WILTON B RECONDUCTORING © Transpower New Zealand Limited. All rights reserved. 13Details of the economic assessment can be found in Attachment G. The key results
are summarised below.
We have expressed all elements of the economic analysis as costs and have shown
the economic result as a whole-of-life cost. The option which minimises whole-of-life
cost is our preferred economic option. Minimising whole-of-life cost is equivalent to
maximising net benefit. These results are shown in Table 4-1 which contains the
Present Value (PV) of the P50 costs.
Table 4-1 –Expected net market benefits
PV of P50 costs $m Base case Sulphur 70°C Zebra 90°C
Reconductoring cost 11.9 9.1 9.0
Transmission losses 1.5 1.7 2.1
Present Value of whole-of-life costs 13.4 10.8 11.1
Difference from Base case 0.0 -2.6 -2.3
Net benefit ranking 3 1 2
Sulphur 70°C, is our preferred economic option, with the lowest whole-of-life PV cost.
Zebra 90°C is only $300,000 more, so in a manner consistent with the Investment
Test, these are similar. We have considered a range of unquantified benefits to help
differentiate between the options.
4.1.2 Unquantified benefits
Our assessment shows the relativity between the options and in general, considers
the short to medium term. Our qualitative assessment is described in Table 4-2 below.
The benefit for each option has been qualitatively ranked between and , where
means more benefit than . Of the full list of unquantified benefits we consider,
the following are relevant to this analysis:
Optionality to further upgrade – how easy will it be to further increase capacity
if required? This benefit recognises the inherent optionality in some options from
being able to increase capacity if our demand and/or generation assumptions
prove to be inaccurate.
Minimises disruption – to what extent will the local community be disrupted by
the implementation of an alternative? Replacing conductor and working on
towers creates disruption and often inconvenience to the local community. Over
time, lower capacity or incremental upgrades are more disruptive to communities
because we will have to undertake our upgrading activities more often.
Aligns long term grid development – to what extent is the option consistent
with our longer term vision for the grid. Our longer term vision requires us to
make the best utilisation possible of existing transmission corridors.
Asset life – to what extent will the options differ in expected life? Sulphur AAAC
conductor will be expected to last longer than Zebra ACSR in this relatively harsh
environment, which is not recognised in our analysis.
14 CENTRAL PARK – WILTON B RECONDUCTORING © Transpower New Zealand Limited. All rights reserved.Table 4-2: Qualitative assessment – unquantified benefits (UQB) and overall preferred option
Sulphur 70°C
Zebra 90°C
Base case
Item
Ranking based on quantified benefits (QB) 3 1 2
Unquantified differences (UQB):
Optionality to further upgrade
Minimises disruption
Aligns long term grid development
Asset life
Total 5 12 9
Ranking based on unquantified benefits (UQB) 3 1 2
Overall ranking QB + UQB 3 1 2
The Sulphur 70°C option minimises whole-of-life cost and also has an advantage over
Zebra 90°C as it is AAAC and is likely to perform better in this corrosive environment.
Being strung at 70°C it also has the potential to be thermally upgraded in the future
should this be necessary.
Based on evaluation of the short list options, reconductoring with Sulphur 70°C is our
preferred option.
4.2 Robustness of the preferred option
Our preferred option has been tested against a range of sensitivities. The future is
uncertain and so it is important it is “stress tested”. By adjusting key variables we see
how robust the preferred option is to changes in assumptions.
For this project we have considered the results of our analysis with:
high and low demand (P97.5 and P2.5)
changes in capital costs (+/- 10%)
changes in discount rates (+/- 3%)
The results of the sensitivity analysis are in Figure 6, which shows the range in the
expected project costs. The costs are the Present Value (PV) in $2016 (December).
CENTRAL PARK – WILTON B RECONDUCTORING © Transpower New Zealand Limited. All rights reserved. 15The project is most sensitive to demand and the labour capital costs. All options have
similar PV ranges, although the base case option is more sensitive to labour costs
while the Zebra 90°C and Sulphur 70°C options are most sensitive to demand. The
discount rate has an amplified effect on the Base case option, since this has costs out
to 2027.
Figure 6 Sensitivity of project costs (PV $2016)
Capex - materials
Base case…
Zebra 90°C
Sulphur 70°C
$mill 8 10 12 14 16 18
Capex - labour & other
Base case…
Zebra 90°C
Sulphur 70°C
$mill 8 10 12 14 16 18
Discount rate
Base case…
Zebra 90°C
Sulphur 70°C
$mill 8 10 12 14 16 18
Demand
Base case…
Zebra 90°C
Sulphur 70°C
$mill 8 10 12 14 16 18
There is uncertainty with all short-listed options but our sensitivity analysis indicates
that our preferred option remains preferred more often than other options.
We have further stress tested our preferred option by considering the uncertainty
surrounding our cost estimates for each option. Sulphur and Zebra costs are based on
the “Solution Study Report Plus” (SSR+) study and are estimated to have an accuracy
range of +/- 10%. However, the Base case option was a desktop estimate, hence a
wider range of +/- 20%. The following chart shows the resulting PV range (taking the
minimum and maximum costs for each option).
The Base case PV range does overlap our preferred option at the extreme ends of
each distribution. However, a high cost for Sulphur combined with an extreme low cost
for Base case is a more unlikely outcome, considering that each option has similar cost
16 CENTRAL PARK – WILTON B RECONDUCTORING © Transpower New Zealand Limited. All rights reserved.drivers (for example if the re-conductoring work is more difficult than expected then
labour costs will be higher for all options).
Figure 7 Cost risk range (PV $2016)
Min to max cost range
Base case
(piecemeal…
Zebra 90°C
Sulphur 70°C
PV, $mill 8 10 12 14 16 18
In our view these sensitivities demonstrate that Sulphur 70°C is sufficiently robust
under sensitivity analysis and it therefore becomes our proposal.
4.2.1 EDGS scenarios
We have not considered EDGS scenarios, since there is no new generation planned
for this region. However, we have considered the effect of solar PV and electric
vehicles on demand at Central Park. This is discussed in more detail in Appendix A.3.
The uncertainty around the uptake of solar PV and other technologies such as electric
vehicles will be implicit in our range of demand forecasts. We have a 2042 peak
demand forecast range of between 120MW and 250MW, which includes this
uncertainty.
5 Timing
Due to the length of the lines (together about 11.7 km), we are planning a 4-month
delivery programme to replace the conductor, starting in February 2019. This time of
year is likely to provide the most settled weather patterns that are required for
construction.
6 Good electricity industry practice
The proposed replacement of the conductor on the Central Park - Wilton B line
removes safety risk and better utilises existing assets. Overall the proposal reflects
good electricity industry practice by being consistent with good international practice,
demonstrating economic management, and improving safety.
CENTRAL PARK – WILTON B RECONDUCTORING © Transpower New Zealand Limited. All rights reserved. 177 Stakeholder engagement
We have engaged with both community and industry stakeholders during our
investigation.
Table 7-1: Stakeholder engagement to date
Date Activity
April 2015 Request for Information and Long List of Options
January 2016 Wellington Electricity (WE) submission
September 2016 Transpower response to WE submission
December 2016 Consultation on our draft Listed Project Application
February 2017 Two responses received
In April 2015 we published a Request for Information (RFI) and Long List of Options
for this project.
We received one submission from Wellington Electricity, which was generally
supportive of reconductoring. Their short term load forecast projections are lower than
those of our APR for CPK, but they note that a conservative approach is prudent over
the asset lifespan.
In December 2016 we published our draft Listed Project Application which can be
found at https://www.transpower.co.nz/central-park-wilton-investigation-consultation.
This comprised of five documents:
The main document which described our short list of options and the Listed
Project Capital Allowance being requested
Attachment A Condition Assessment
Attachment B Options and Costing report
Attachment C Wellington Electricity submission Jan 2016
Attachment D Transpower reply to WE submission Jan 2016
Attachment E Annual costs and assumptions
We received two responses – one from Wellington Electricity and one from Meridian.
Both supported our proposal and asked that we liaise with them as the project
progresses in order to minimise the effect on their own operations, which we will do.
8 Listed Project Capex Allowance
8.1 The difference between Base capex and a listed project
If this project is approved by the Commission, an amount will be added to our RCP2
Base capex allowance. We have called this the Listed Project Capex Allowance
(LPCA).
18 CENTRAL PARK – WILTON B RECONDUCTORING © Transpower New Zealand Limited. All rights reserved.We have derived our proposed LPCA in a manner consistent with it being a standalone
project, on the basis that our existing Base capex allowance was approved for other
works, not including this project.
The Listed Project category was developed because although reconductoring projects
are Base capex, they have characteristics which do not make them suitable for the
Commission’s approach to other Base capex. The Commission approves Base capex
assuming that the work is predictable and routine. They approve a pool of money with
full substitutability (we can substitute other projects to those included in our RCP
submission) and they approve the estimated P50 cost for that pool of projects.
Reconductoring jobs are large projects, containing works which are unpredictable in
terms of both timing and cost. In many instances, we do not confirm the actual scope
of a reconductoring project until it actually starts, being when we physically visit and
inspect every tower site. It is not until then that we understand the more uncertain
requirements (such as access tracks, tower footings, etc) and can finalise the works
required.
8.2 Our approach for this project
This reconductoring project is unusual in that we have determined that no tower or
foundation strengthening will be required, since we are replacing a duplex conductor
configuration with a lighter weight simplex conductor. This reduces the scope
uncertainties considerably.
We have broken our cost estimate into two categories.
1. The first category (“SSR+” costs) contains the bulk of the work and contains
those elements whose cost can be estimated reasonably well. There is still
some scope uncertainty and for those elements where work is tendered out,
uncertainty around the cost. A new approach was used for this project, to refine
this cost as much as possible without undertaking detailed design. For this
project, we believe the cost accuracy of these elements is +/-10%. It is unlikely
we will be able to achieve this for most reconductoring projects. The expected
P50 cost of this category is $9 million and $9.9 million is the maximum expected
cost, before financing costs, inflation and exchange rate uncertainty are added.
2. The second category (“other construction costs”) contains cost items which are
uncertain in that, apart from some minimum amount of expenditure, the cost
could be anywhere between the minimum and maximum cost we have
determined. The cost for these items does not conform to a regular distribution.
Some are binary ie we will either spend $0 or the maximum amount and some
are not binary, but we do not know where the cost will end up within each range.
These costs are not easily predictable, nor easily controlled by ourselves and
the final level of cost is not dependent on being efficient or otherwise. The
minimum expected cost of this category is $1.0 million and $1.9 million is the
maximum expected cost, before financing costs, inflation and exchange rate
uncertainty are added.
CENTRAL PARK – WILTON B RECONDUCTORING © Transpower New Zealand Limited. All rights reserved. 19An overall minimum and maximum cost summary for each category is shown in Table 8-1. The biggest uncertainty for the category two costs relates to weather conditions when the reconductoring occurs. Wind speeds of greater than 80 km/hour will curtail work, and analysis of local wind data suggests these wind conditions will prevail around 12% of the time, although this is variable year to year. We would expect to lose at least 13 work days due to wind speed, with a likely range between 9 and 17 days (based on historical meteorological data from NIWA). We would also expect some down time due to heavy rainfall and have assumed a further 5 days for this. We have allowed a total of 22 days for these weather related uncertainties in our LPCA. Table 8-1 –Cost range estimates $thousand Minimum Maximum Category One (2016$): SSR+ costs 8165 9858 Category Two (2016$): Weather delays 560 880 Wiring site access 131 184 Access - Track overlay (General) 68 137 Culverts - General 12 18 Security - General 62 187 Trail management - General 87 144 Property 0 100 Conductor treatment to mitigate noise risk 20 100 Existing conductor repair before using as pull wire 25 50 Replacement of attachment points 0 135 Category Two subtotal (2016$): 966 1935 Category One + Two (2016$) 9131 11793 Inflation 391 532 Exchange rates -156 156 IDC 357 426 Total cost estimate (2019$) 9723 12906 8.3 Deriving the LPCA for this project To determine the LPCA for this project we have taken a different approach for the two cost categories. For the first category we consider it would be reasonable to include an uncertainty allowance which is at a P90 level for the estimated cost range. We have undertaken a significant amount of work to refine the cost as accurately as possible, which means a 20 CENTRAL PARK – WILTON B RECONDUCTORING © Transpower New Zealand Limited. All rights reserved.
P90 estimate only reflects an uplift of only $0.5 million (6%) on our expected cost
estimate. This is a small margin for a project of this size and we believe is an
appropriate balance between providing perverse incentives to take shortcuts (in terms
of project management) and having an allowance which discourages efficiency.

As already mentioned, this is an unusual project (in terms of the relative scope
certainty) so we would not consider approval for this uncertainty allowance to set a
precedent for other listed projects.

For the second category we consider it would be reasonable to include a P100
(maximum) uncertainty allowance. These are costs which are unpredictable, and some
costs, such as weather-related costs, are out of our control. If they all occur at the
maximum level, we should not be penalised.

In all circumstances, we can only recover the actual cost of the project from our
customers.

A summary of our LPCA calculation, including financing costs, inflation and exchange
rate uncertainty is shown in Table 8-2.

As shown, the total LPCA we are applying for is $12.4 million. This reflects an uplift
of 10% ($1.1 million) over our expected cost.

Table 8-2 –Deriving the LPCA

                                  Cost          Range of          Point         Cost applied
                               distribution    distribution     selected         for ($000)
                                   type       (% or $000)         within
                                                               distribution
                                                              (probability)
 SSR+ costs (2016$)             Triangle         +/-10%           P90               9479
 Other construction costs      Undefined          $969            Max               1935
 (2016$)
 Inflation                                                                          511
 Exchange rates                                                                      86
 IDC                                                                                414
 Total LPCA (2019$)                                                                12425

9      CommunityCare Fund
Also included in the expected cost is an amount for our CommunityCare Fund
programme. Transpower acknowledges that while there are clear benefits from
electricity transmission, our work will impact on local communities and the use of
recreational facilities that will be disrupted by the work.

CENTRAL PARK – WILTON B RECONDUCTORING © Transpower New Zealand Limited. All rights reserved.   21
10 Effect on transmission charges
If the Commerce Commission approves this investment proposal and we complete the
conductor replacement as outlined, transmission charges will increase. Table 10-1
shows indicative increases, for information purposes. These transmission charge
increases would be expected to reduce from 2021 on, as the asset is depreciated.
Table 10-1: Impact on transmission charges
Year Consumers bill
c/kWh
2018/19 0.002
2019/20 0.003
2020/21 0.003
2021/22 0.003
2022/23 0.003
2023/24 0.003
2024/25 0.003
22 CENTRAL PARK – WILTON B RECONDUCTORING © Transpower New Zealand Limited. All rights reserved.A.1 Capex IM requirements
In the below table we outline how this application meets the requirements to be
approved by the Commerce Commission under the Capex IM.
Table A.1-1 – Capex IM checklist
Capex IM section Report cross reference
2.2.3 Listed Project
(2) Listed project definition A.2 Changes in costs from prior
(a) (i) capex > $20 million estimates
(ii) to be commissioned in the regulatory period Although the cost estimates are under
(b) replacement/ refurbishment $20m, at the time of applying for this to
(c) commencement date within the regulatory period be a listed project there was an
(d) not already in base capex expectation cost would be greater than
$20m.
3.2.4 Approval of base capex in addition to the base capex allowance
(1) Due by June twenty-two months before the end of a regulatory Submission expected in February 2017
period (due beforeJune 2018)
(2)(a) reason for project, technical evidence 2 The Need
Attachment A
(2)(b) options considered 3.1 The options
Attachment B
(2)(c) scope & grid outputs 1 The proposal
(2)(d) technical & costing info & risks 3.2.2 The Costs
Attachments B & G
(2)(e) costs by year & assumptions Attachment G
(2)(f) cost-benefit & sensitivity 3.2 The costs and benefits
4.2 Robustness of the preferred option
(2)(g) consultation 7 Stakeholder engagement
(2)(h) Board & CEO sign-off Attachment H
(4)(a) consultation process as per base capex Attachments C, D, E, F and section 7
(4)(b) evaluated as per base capex criteria, incl Sched A where 2 The Need
relevant: Attachment A
- follow Transpower policies & planning standards for grid / base https://www.transpower.co.nz/sites/defau
capex; lt/files/plain-
- cost-effective; page/attachments/Transpower%20Natio
- reasonable assumptions (method); nal-
- risk-based good asset management, Regional%20Peak%20Demand%20Fore
- grid output dependencies casts%20Feb-
- deliverability; 2015%20Information%20Document.pdf
- reasonable asset replacement models (inputs & method);
- reasonable demand forecasts (inputs & method);
- scope for efficiency gains
(5)(a) forecast CPI used for base capex in reg period; Attachment G
(b) forecast FX rates used for base capex for reg period;
(c) percentage of foreign capex
CENTRAL PARK – WILTON B RECONDUCTORING © Transpower New Zealand Limited. All rights reserved. 23A.2 Changes in costs from prior estimates
In our RCP2 submission we provided an indicative cost of $24m, around $13m
higher than our current $11m estimate (P50). There are a number of drivers of this
cost reduction:
The scope of the project has been reduced substantially
o Reconductoring of the last 0.8km section of the Central Park – Wilton
B line is not included in this project.
o By-pass cabling is not now required, which was needed for
reconductoring the difficult last 0.8 km section
o Simplex conductors are being installed (we previously assumed
duplex)
Underlying costs estimates for all re-conductoring projects have been revised
down
o Since the initial estimates were made, a number of re-conductoring
projects have been undertaken, including Bunnythorpe to Haywards,
which has enabled us to obtain a clearer view of “typical” costs
The below table shows the impact of each of these cost drivers.
Table A.2-1 – Cost changes between April 2015 and November 2016
$ million Materials All other costs & risk Total cost
contingency
0.8km last section of Chukar
-0.35 -2.12 -2.47
(excl cabling)
By-pass cabling -2.06 -3.63 -5.70
Installation of duplex vs simplex -0.67 -2.23 -2.91
Other revisions (eg. more accurate
-0.19 -1.93 -2.12
costs)
Total revisions -3.27 -9.92 -13.20
24 CENTRAL PARK – WILTON B RECONDUCTORING © Transpower New Zealand Limited. All rights reserved.A.3 Demand and generation assumptions
The Capex IM requires we consider demand and generation scenarios (potential future
demand and generation configurations) in our analysis. This is relevant in a general
sense because, if new generation were to be built in the right location, at the right time,
the need for investment in transmission could be reduced or even eliminated.
We are required to base our scenarios on the Electricity Demand and Generation
Scenarios (EDGS) from the Ministry of Business Innovation and Employment (MBIE).
However, no new generation is planned for this area and we assume that Meridian’s
West Wind generation continues operating at current capacity levels.
It is likely that any potential new generation will be small-scale embedded generation,
such as roof-top solar PV on residential and commercial premises.
In the tables below we show the solar PV MW capacities and Electric Vehicle demand
based on the EDGS scenarios. It shows the national total, and also the amount we
could expect to see in Central Park (pro-rated assuming 3% of the national load). The
range between the highest and lowest forecasts of Solar in Central Park by 2050 is
37.9MW, whilst for EV’s it is 11.7MW. Unless there was widespread adoption of
batteries, we would not expect the Solar PV capacity to materially influence the
residential winter peak loads, which typically occur when the sun is not shining.
Table A.3-1 2016 final EDGS Solar Power Assumptions – installed capacity (MW)
Implied in Central Park
National
area
2025 2050 2025 2050
Minimum 196.4 526.7 5.8 15.5
Average 228.9 954.3 6.7 28.1
Maximum 261.3 1813.7 7.7 53.3
Range (Max-Min) 64.9 1287.0 1.9 37.9
Table A.3-2 2016 final EDGS Electric Vehicle Assumptions – average MW demand
Implied in Central Park
National
area
2025 2050 2025 2050
Minimum 16.5 122.5 0.5 3.6
Average 34.4 218.6 1.0 6.4
Maximum 54.2 521.2 1.6 15.3
Range (Max-Min) 37.7 398.7 1.1 11.7
CENTRAL PARK – WILTON B RECONDUCTORING © Transpower New Zealand Limited. All rights reserved. 25The uncertainty around the take-up of solar and other technologies such as electric vehicles will be implicit in our range of demand forecasts. In the following section we have a 2042 peak demand range of between 120MW and 250MW, which includes the uncertainty from uptake of solar PV and electric vehicles. Given that the EDGS demand forecasts do not drill down to the regional level, and that the new generation build scenarios are of little relevance for this project, we have not directly used the EDGS scenarios in this analysis. 1.1 Demand The peak demand forecast assumptions used are from our 2016 Transmission Planning Report. They were developed using MBIE energy growth forecasts, combined with input from our customers. Prudent peak forecasts are developed using our estimate of the P90 (90th percentile) of our demand forecast growth rates for the first 5 years, but then the forecast reverts to grow at the P50 (50th percentile, or expected) rate. Our expected forecast is the P50 of our demand forecast range. Central Park demand peaks in winter. Winter demand forecasts for Central Park are shown below. The prudent and expected forecasts are our official forecasts. The plausible range is approximate. In particular, the upper range is speculative and Wellington Electricity may opt for other solutions (eg a new grid exit point) if the load did grow in this manner. Figure 8: APR 2015 Winter Peak Forecasts for Central Park 26 CENTRAL PARK – WILTON B RECONDUCTORING © Transpower New Zealand Limited. All rights reserved.
A.4 Peak demand forecasts
This table shows the forecast expected and prudent peak demand for the Central Park
GXP in MW from our 2015 forecast. The prudent peak is taken as the P90 (such that
there is a 10% of the probability of exceeding this level) peak in the first 5 years with
subsequent growth assumed to be at the same rate as the expected forecast.

        Table A.4-1: Central Park expected and prudent demand forecasts, MW

                                         Central Park      Central Park
                                          Expected -      W
                                                          -
                                                             Prudent
                                            (MW)              (MW)
                            2016              172               184
                            2017              172               185
                            2018              173               186
                            2019              174               187
                            2020              175               188
                            2021              176               189
                            2022              177               190
                            2023              178               190
                            2024              179               191
                            2025              179               192
                            2026              180               193
                            2027              181               194
                            2028              182               195
                            2029              183               196
                            2030              184               197
                            2031              185               198
                            2032              186               199
                            2033              187               200
                            2034              188               201
                            2035              189               202
                            2036              190               203
                            2037              191               204
                            2038              192               205
                            2039              192               206
                            2040              193               207
                            2041              194               208
                            2042              195               209

CENTRAL PARK – WILTON B RECONDUCTORING © Transpower New Zealand Limited. All rights reserved.   27
A.5 Attachments Further information supporting this application is included in the following attachments: Attachment A – Condition assessment of the Central Park - Wilton B lines This document provides some background as to why the conductors on the Central Park - Wilton B lines need to be replaced. Attachment B –Options and Costing report This document describes how the long list of options was reduced to a short list of options. It also provides detail of how the short list options were costed. Attachment C – Wellington Electricity submission Jan 2016 Attachment D – Transpower reply to WE submission Sep 2016 Attachment E – Wellington Electricity submission Jan 2017 Attachment F – Meridian submission Jan 2017 Attachment G – Annual costs and assumptions Attachment H – Board approval and CEO certification 28 CENTRAL PARK – WILTON B RECONDUCTORING © Transpower New Zealand Limited. All rights reserved.
You can also read