Centre for Social Development in Africa - Factors Determining Voter Choice Between 2017 and 2020
←
→
Page content transcription
If your browser does not render page correctly, please read the page content below
PX Media/shutterstock.com

                            Centre for Social
                            Development in Africa
                            Factors Determining
                            Voter Choice Between
                            2017 and 2020
Copyright the authors and the Centre for Social Development in Africa, University of Johannesburg, P.O. Box 524,
                Auckland Park, 2006, Csdainfo@uj.ac.za, www.uj.ac.za/faculties/humanities/csda

This research is supported with funding from the Department of Science and Technology (DST) and the National
 Research Foundation (NRF) South African Research Chair in Welfare and Social Development, Centre for Social
Development in Africa, University of Johannesburg. The views expressed are those of the authors and not of the
          DST and the NRF. Read more about the SARCHI Chair in Welfare and Social Development at
                          https://www.uj.ac.za/faculties/humanities/sarchi-welsocdev

About the authors: Leila Patel is professor of Social Development Studies and the DST/NRF Chair in Welfare and
 Social Development, CSDA, University of Johannesburg; Yolanda Sadie professor Emeritus in Politics, University
of Johannesburg; Megan Bryer is a researcher associated with the CSDA and Jaclyn de Klerk is with the Statistical
                               Consultation Service, University of Johannesburg.

   Suggested citation: Patel, L., Sadie, Y., Bryer, M. and de Klerk, J. (2021). Factors Determining Voter Choice
  between 2017 and 2021. Johannesburg: Centre for Social Development in Africa, University of Johannesburg.
 SARChi website https://www.uj.ac.za/faculties/humanities/sarchi-welsocdev/Pages/Meet-Professor-Leila-Patel-
                    South-African-Research-Chair-in-Welfare-and-Social-Development.aspx

                                       Date of publication: 21 June 2021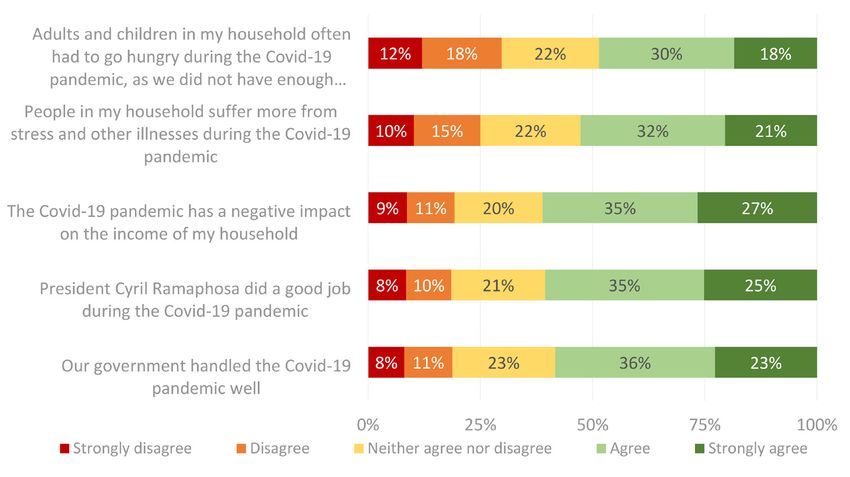
Introduction
Across four separate waves, we analyse the factors that influence the party choice of South African
voters. We are concerned with whether socio-economic well-being shapes party choice, in a country
where nearly three decades of democracy have not yet ensured the universal realisation of the socio-
economic rights affirmed by the Constitution. This research brief presents the findings from the fourth
wave of data collected on voter preferences in 2020, amid the Covid-19 pandemic and in the run- up to the
2021 municipal elections, held every five years. The results from this study are compared to the findings
of the previous waves.

About the study
Four national cross-sectional surveys were conducted in the period October 2017 to October 2020.
The first wave of data was collected in October 2017 (Wave 11). The second wave of data (Wave 22) was
collected between 25 October and 24 December 2018. The third wave of data (Wave 3) was collected
between October and November 2019. The final wave of data (Wave 4) was collected between 19
November and 30 December 20203; it is this wave’s findings that are discussed in this research brief. The
findings are drawn from a random and nationally representative sample. Face-to-face (CAPI) interviews
were conducted in the respondents’ preferred home languages. Ipsos Public Affairs, a marketing
research company, collected the data on behalf of the CSDA. The sample of the 2020 survey consisted of
metropolitan and rural areas stratified in terms of age, gender and race. Six survey questions supplied by
the CSDA were included in Ipsos’s Khayabus survey, which is annually conducted between October and
November. A description of the questions is contained in the end notes (see endnote 1).

The data was analysed by Jaclyn de Klerk from the Statistical Consultation Service at the University of
Johannesburg.

Publications emanating from this research are contained in the reference list (see Patel et al., 2020; Sadie
and Patel 2020; Patel, Sadie, Bryer and de Klerk 2019; Patel, Sadie and Bryer 2018; Sadie, Patel and Baldry
2016; Graham, Sadie and Patel 2016; Patel et al. 2014).

Results: Wave 4, 2020

Profile of participants
The sample included 3469 respondents. Of the total sample, 70% reside in urban areas and 30% in rural
areas. This corresponds with the national urban–rural split.4 Gender representation was split almost
equally, with 52% female and 48% male. Most respondents were aged between 18 and 34 years (48%),
with 44% aged between 35 and 59 years, while 8% were older than 60 years. This is consistent with
previous waves. The racial composition of the sample closely resembles the country’s racial profile – 78%
respondents were black, 9% coloured, 10% white and 3% Indian/Asian. Most respondents were working
(47%) as opposed to not working (22%) or unemployed5 (31%).

Respondents in the sample were largely poor and fell into the lower middle-income bands. Of all the
respondents, 58% earned less than R8 000 as their total monthly income. About 13% of respondents
earned more than R10 000 per month. A quarter (25%) of the respondents refused to reveal their income.

1
    https://www.uj.ac.za/faculties/humanities/csda/Documents/Voter%20Preference%20Report%20A4%2002.10.%202018%20PDF.pdf
2
    https://www.uj.ac.za/faculties/humanities/csda/Documents/Voter%20Report%20A4%20Mar%202019%20Web.pdf
3
  See IPSOS press release of findings from 2020 survey data https://www.ipsos.com/en-za/almost-half-south-african-households-go-hungry-due-
covid-19
4
  StatsSA, 2015. Findings of the Living Conditions Survey 2014/15. [Online] Available at http://www.statssa.gov.za/publications/Re-
port-03-10-02%20/Report-03-10-02%202015.pdf
5
    Includes unemployed looking for work and unemployed not looking for work.

                                                     FACTORS DETERMINING VOTER CHOICE BETWEEN 2017 AND 2020                                   3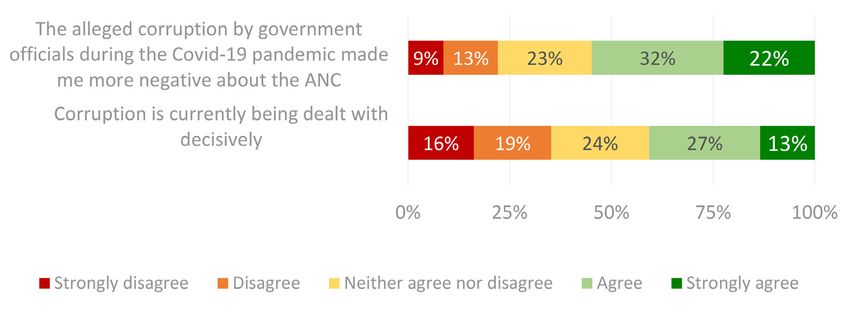
Regarding education, 47% of respondents have Grade 12 as the highest level of education; 24% have
secondary school as the highest level, 3% have primary school, while 5% of respondents have an artisan’s
certificate; 10% have a technikon diploma and only 7% have a university degree.

                              Table 1: Highest level of education received

                                                                               Percent
1 - No schooling                                                                 1,4
2 - Some primary school                                                          2,6
3 - Primary school completed                                                     3,1
4 - Some high school                                                             24,2
5 - Matric / Grade 12                                                            47,0
6 - Artisan’s certificate obtained                                               4,7
7 - Technikon diploma/degree completed                                           10,1
8 - University degree completed                                                  6,7
9 – Honours degree                                                               0,0
Total                                                                           100,0

Reasons for voter preferences
When asked which party they would vote for if there were national elections tomorrow, most respondents
said the African National Congress (ANC) (52%, down from 58% in wave 3, 56% in wave 2 and 52% in wave
1), followed by the Democratic Alliance (DA) (10%, down from 13% in wave 3 and wave 2, and 22% in wave
1) and the Economic Freedom Fighters (EFF) (10%, up from 7% in wave 3, 9% in wave 2 and 6% in wave
1), while 25% refused to answer, did not know or would not vote and this increased in wave 4 from 19%
in wave 3.

The figure below shows the change in party choice for national elections across the four waves. While
support for the ANC had been increasing in waves two and three, it appears to have declined in the fourth
wave. The major opposition party, the DA, also suffered a further decline in support, again after support
fell in the previous wave. Meanwhile the EFF gained support in the most recent wave. There has been a
consistent rise in respondents refusing to answer or responding that they did not know who they would
vote for or saying they would not vote at all over the four waves.

                             Figure 1: Party choice across waves 2017-2020

 4      FACTORS DETERMINING VOTER CHOICE BETWEEN 2017 AND 2020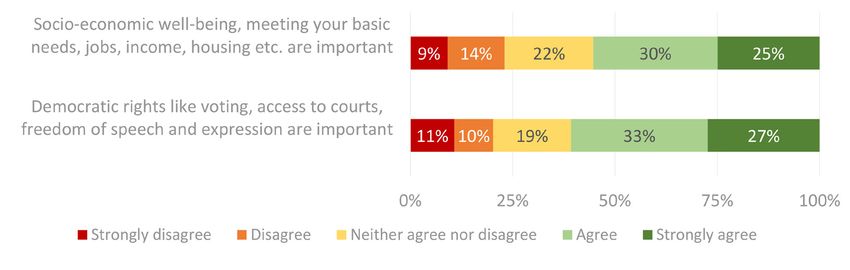
In addition, we asked respondents in this wave who they would vote for if there was a municipal election
tomorrow: 51% said they would vote for the ANC, 11% said the EFF and 10% said the DA, while 25%
refused to answer, did not know or would not vote. Comparing the responses for national and municipal
election party choice, we found that 67% of respondents made the same choice for national and municipal
elections; only 6% differed in their national and local party choice. About 27% of respondents did not
know, refused to answer or said they would not vote in either or both of the elections. This suggests that
most people do not choose differently in national and municipal elections.

Respondents were asked the reason for their party choice, with the option to select up to five reasons.
The most common reason that respondents gave for supporting a party was that they believed the party
would bring a better life (43%, down from 58% in wave 3 and 65% in wave 2), followed by it is a party for
everybody/all South Africans (42%) and trust the party (42% down from 54% in wave 3 and 62% in wave
2). The fourth most common reason cited was this party is doing a good job in handling the Covid-19 crisis
(37%), a reason not included in previous waves. The response this party brought freedom and democracy
to South Africa fell to the fifth most cited reason for party choice (36%) from the fourth most in the
previous wave. Across all the waves, the most cited reasons remained the same, with the addition of the
Covid-19-specific response in wave 4. That said, there has been a measurable decline in the proportion of
people offering these reasons for party choice over time, which we have previously suggested means that
though people are still ticking the ANC box they are appreciably more disillusioned. The decline in ANC
support in the most recent wave appears to affirm this.

Asked whether they receive any grant from the government, 36% said “Yes”, up 6 percentage points from
wave 3, perhaps because of the Covid-19 special relief of distress grant introduced by government in the
wake of the pandemic. Whereas in wave 3, 43% of all respondents said that one of the reasons they voted
for a particular party was “because it pays social grants and I am afraid that another party will stop social
grants”, which declined to 32% in wave 4. Of the respondents who receive a grant from government, 33%
gave this as their reason for their party choice (compared to 51% in wave 3 and 60% in wave 2).

Reasons for local election political party choice
In this wave we ask respondents separately to give the main reason for their choice of party in the
upcoming local elections, again with the option to select up to five reasons for their choice from a list of
possible options. Trust in the party is the most common reason cited (38%), followed by the view that this
party will stimulate job creation in communities (33%), that the party will fix roads, potholes, street lights,
water leaks, fix burst pipes and storm water drainage (28%), that the party will prioritise the delivery of
good quality and reliable services such as clean water, electricity, sewage, rubbish removal (27%) and then
that the party will make land available for housing and upgrade services in informal settlements (26%).
The sixth most cited reason is that the party brought freedom and democracy to the country (26%).

For both national and local election party choice, trust in the party ranks as highly important; but at the
municipal election more importance is assigned to job creation and service delivery. It must be noted,
however, that the list of options differed in the response to national level party choice compared to
municipal level party choice. That being said, only 19% of respondents said that The party will offer me
money, a house, a job, food parcels or something in return for my vote, was a major reason for their choice
of political party in the national elections.

Democratic rights and socio-economic well-being as factors
shaping voter choice
When asked whether they agree or disagree with the statement Democratic rights like voting, access to
courts, freedom of speech and expression are important, among those who answered, 61% said they agree
or strongly agree (down from 67% previously) compared to 20% who disagree or strongly disagree (up
from 13% previously). When asked whether they agree or disagree with the statement Socio-economic
well-being, meeting your basic needs, jobs, income, housing etc. are important, among those who answered
55% said they agree or strongly agree (down from 59% previously) compared to 23% who disagree or
strongly disagree (up from 18% in the previous wave).6

6
    Prior to wave 3 respondents were asked which they thought to be more important: democratic rights or socio-economic well-being.

                                                     FACTORS DETERMINING VOTER CHOICE BETWEEN 2017 AND 2020                           5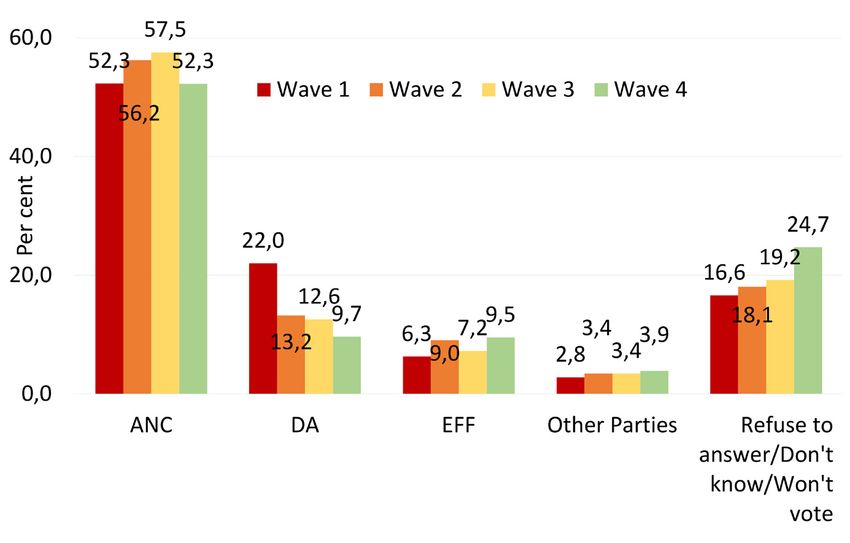
Figure 2: Are democratic rights and socio-economic well-being important to you?
Does trust in institutions influence voter choice?
As in previous waves, trust in institutions is mostly favourable, with the majority of respondents saying
that they are very likely or extremely likely to trust all institutions. But there is a general trend of decline
in trust across all institutions except in the President. Trust in President Cyril Ramaphosa increased by 4%
from the previous report with 60% saying they were very likely or extremely likely to trust the presidency
under President Cyril Ramaphosa. Under President Jacob Zuma, only 26% of respondents said they were
very likely or extremely likely to trust the presidency.
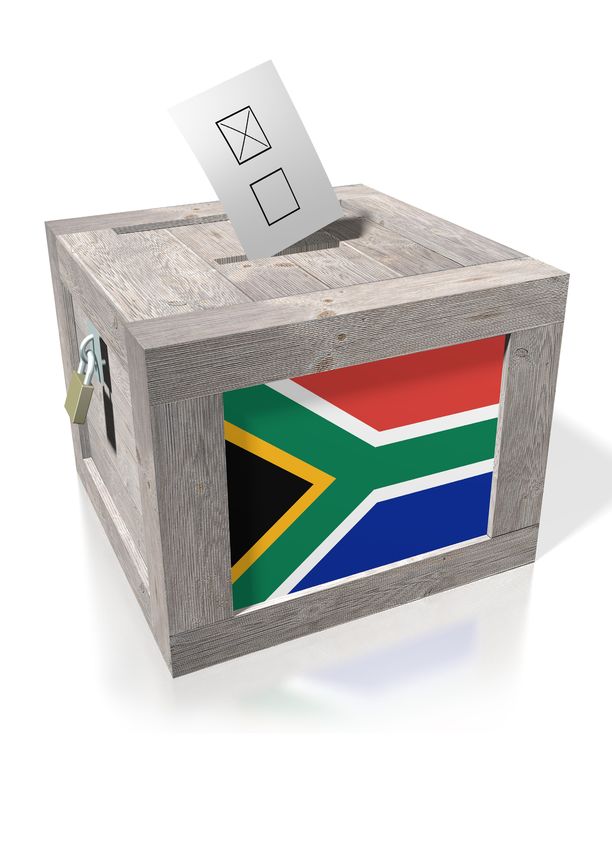
Figure 3: How likely are you to have trust in the following institutions?
Comparing these findings to the previous report, trust in the South African Social Security Agency (SASSA)
has decreased further from 60% to 59% with respondents saying they are very likely or extremely likely
to trust the institution; similarly, trust in the media declined from the previous report, down from 46% to
43% selecting ‘very likely’ or ‘extremely likely’; trust in the South African Police (those that are ‘very likely’
6 FACTORS DETERMINING VOTER CHOICE BETWEEN 2017 AND 2020
or ‘extremely likely’ to trust the SAP) declined further from 44% to 40%; trust in Parliament declined
to 47% from 51% (those that are ‘very likely’ or ‘extremely likely’ to trust the institution); trust in the
Department of Social Development decreased from 53% to 51%; and the high likelihood of trust in the
courts declined from 50% to 45%. Apart from Parliament and the media, all institutions were already
losing the trust of respondents in the previous wave. In this wave, the decline in trust was broad-based,
affecting all institutions except the President.

Wave 4 included an additional question asking respondents whether they have trust in their current local
councillor: 33% of respondents said they are ‘very likely’ or ‘extremely likely’ to trust their councillor.
Relative to all other institutions, trust levels appear the lowest for local councillors.

The perception of corruption and voter choice
When asked whether they agree with the statement Corruption is being dealt with decisively, 41% of
respondents ‘agree/strongly agree’ as opposed to 35% ‘disagreeing/strongly disagreeing’.7 In the previous
wave respondents were asked whether they thought enough was being done to root out corruption. With
39% agreeing/strongly agreeing and 37% disagreeing/strongly disagreeing the sentiment was close to
being equally divided. There appears to have been a slight shift in wave 4 towards agreement that the
government is addressing corruption.

In this wave, perceptions of corruption specific to the Covid-19 pandemic were also probed. Respondents
were asked whether they agreed with the statement: the alleged corruption by government officials during
the Covid-19 pandemic made me more negative about the ANC. The majority of those who responded (55%)
said they ‘agree/strongly agree’ as opposed to 22% ‘disagreeing/strongly disagreeing’. Despite more
respondents agreeing that corruption is being dealt with decisively than disagreeing, it appears that the
ANC is perceived negatively for the corruption that came to light during the Covid-19 pandemic.

                              Figure 4: Is enough being done to root out corruption in SA?

Perception on provision of social grants
In wave 3 we introduced a question to test whether voters understand that political party choice does
not threaten receipt of a social grant. While 44% of the respondents said they ‘agree/strongly agree’
with the statement I am afraid that if another party comes to power social grants will stop in the previous
wave, compared to 30% of respondents who ‘disagreed/strongly disagreed’. In wave 4, the percentage of
respondents that said they ‘agree/strongly agree’ with this statement declined to 40%, and 36% (up 6%)
‘disagreed/strongly disagreed’. This is encouraging as it suggests a decline in unfounded fears about the loss
of a social grant if a respondent voted for an opposition party, which may influence political party choice.

7
  In the previous report respondents were asked whether they agreed that Enough is being done to root out corruption. In wave 2 respondents were
instead asked whether people thought corruption had increased in South Africa in the previous year.

                                                   FACTORS DETERMINING VOTER CHOICE BETWEEN 2017 AND 2020                                     7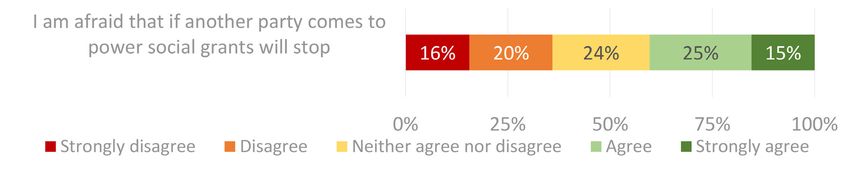
Figure 5: Do you fear losing your social grant if another party comes to power?

Impact of Covid-19
The questions specific to Covid-19 posed to respondents in wave 4 reveal two main findings. Firstly, the
majority of respondents have been negatively impacted by Covid-19 in terms of food, mental well-being,
illness and income. However, despite this impact, the second finding of interest is that the majority of
respondents feel the crisis was well-managed by the government and specifically by President Ramaphosa.

When asked whether they agree with the statement Adults and children in my household often had to
go hungry during the Covid-19 pandemic, as we did not have enough money for food, 49% of respondents
‘agree/strongly agree’ as opposed to 30% ‘disagreeing/strongly disagreeing’, while 53% of respondents
agree/strongly agree with the statement that People in my household suffer more from stress and other
illnesses during the Covid-19 pandemic, as opposed to 25% ‘disagreeing/strongly disagreeing’. Worryingly,
61% of respondents agree/strongly agree with the statement that The Covid-19 pandemic has a negative
impact on the income of my household, whereas only 19% ‘disagree/strongly disagree’.

That being said, 61% of respondents agree/strongly agree that President Cyril Ramaphosa did a good
job during the Covid-19 pandemic, compared to 19% who disagree/strongly disagree. And similarly, 58%
agree/strongly agree that Our government handled the Covid-19 pandemic well, compared to 19% who
disagree/strongly disagree.

                           Figure 6: Has Covid-19 impacted you negatively?

Does social grant receipt matter in voter preferences?
A comparison was drawn between respondents who received a grant from the government and those
who did not. We tested whether the receipt of a grant impacted the respondents’ choice of party – voting
for the ANC or an opposition party. Of the respondents who received a grant from the government, 74%
said that they voted ANC (down from 75% in wave 3 and up from 73% in wave 2), while 26% said that they

 8    FACTORS DETERMINING VOTER CHOICE BETWEEN 2017 AND 2020
voted for an opposition party. Of the respondents who did not receive any government grant, 67% said
they voted for the ANC (down from 70% in wave 2 and up from 66% in wave 2), while 33% said that they
voted for an opposition party. Both recipients and non-recipients were more likely to vote for the ANC
than for an opposition party, but a greater proportion of grant recipients said they had voted for the ANC,
compared with non-recipients of grants. A statistically significant difference was found between grant
recipients and non-recipients, in terms of voting preference.
Figure 7: Comparison of grant recipients vs. non-recipients in voting choice
The same test was done when comparing male and female respondents, disaggregated into grant
recipients and non-recipients, in terms of voting preference. As in wave 2, a statistically significant
difference in terms of voting choice is found between female grant recipients and female non-recipients
only (wave 3 found no statistical significance between grant- and non-recipients for either males or
females). Of all respondents, 343 males receive a grant, up from 220 in the previous wave; 940 males
do not receive a grant. Among females, 634 females receive a grant, up from 555 previously, and 695
females are non-recipients. For males, 66% of non-recipients vote ANC (down from 69%), and a slightly
higher 69% of male grant recipients vote ANC (down from 74% prior). For females, 69% of non-recipients
vote ANC (down from 71% prior) compared to 77% of grant recipients (up from 76%). Our results show
that among women, grant recipients are more likely to vote for the ANC than non-recipients in wave 4.
Figure 8: Comparison of male vs. female grant recipients and non-recipients, in terms of voter choice
FACTORS DETERMINING VOTER CHOICE BETWEEN 2017 AND 2020 9Does age matter in voter preferences?
We also established whether there was a statistically significant difference in how the respondents of
different age groups voted. We compared three age groups: 18-34 years, 35-60 years and older than 60 years.
As previously seen, in wave 4 we found no statistically significant difference across the three age groups in
terms of voting for the ANC or an opposition party. In all three age categories, about 70% of respondents
vote for the ANC as opposed to voting for an opposition party. It should be noted that there is slightly more
support for the opposition in the 18-34 year old age group compared to middle and older respondents.
Figure 9: Comparison of young, middle-aged and old respondents in voter choice
The predictive value of our model
A logistic regression was used as a predictive analysis to test the impact of four constructed independent
variables – perception of the importance of democratic rights, perception of the importance of socio-
economic well-being, perception of governance, and perception of corruption – on the likelihood that a
respondent would vote for the ANC or an opposition party. In other words, we tested whether these four
independent variables are significant predictors of political party choice.
The independent variables are constructed as follows:
Perception of governance: To measure perception of governance (trust in institutions) among the
respondents, we constructed a variable by calculating the average score across all seven questions that
measure a respondent’s trust in institutions. We assigned an average score to each respondent such that
scores range from 1 to 5 (Not at all likely to Extremely likely to trust in institutions), for the question “…
how much [do] you trust each institution, would you say that you are 1 – Not at all likely to, 2 – Not very likely
to, 3 – Neither likely nor unlikely to, 4 – Very likely to, or 5 – Extremely likely to …
Trust the Presidency (President Cyril Ramaphosa)
Trust the courts
Trust the Department of Social Development
Trust Parliament
Trust the South African Police
Trust the media
Trust SASSA (SA Social Security Agency)?”
10 FACTORS DETERMINING VOTER CHOICE BETWEEN 2017 AND 2020The importance of democratic rights: We used the question “On a scale from 1 to 5 where 1 is ‘strongly
disagree’ and 5 is ‘strongly agree’, please tell me your views on the following: Democratic rights like voting,
access to courts, freedom of speech and expression are important”. The variable ranges from 1 to 5 in value,
as answered by the respondent, with each unit increase representing a higher degree of importance.
The importance of socio-economic well-being: We used the question “On a scale from 1 to 5 where 1 is
‘strongly disagree’ and 5 is ‘strongly agree’, please tell me your views on the following: Socio-economic well-
being, meeting your basic needs, jobs, income, housing etc. are important”. The variable ranges from 1 to 5 in
value, as answered by the respondent, with each unit increase representing a higher degree of importance.
Perception of corruption: We used the question “On a scale from 1 to 5 where 1 is ‘strongly disagree’
and 5 is ‘strongly agree’, please tell me your views on the following: Corruption is currently being dealt with
decisively e.g. people are being arrested, charged, sentenced, monies are being recovered, and politicians and
officials are held accountable”.8 The variable ranges from 1 to 5 in value, as answered by the respondent,
with each unit increase representing a higher degree of perceived corruption.
The dependent variable was set as 1 if respondents said that they would vote for the ANC if a national
election were held tomorrow, and 0 if they said that they would vote for an opposition party. Those who
refused to answer, said they did not know or indicated that they would not vote were excluded.
In addition to being asked who they would vote for in a national election if held tomorrow, respondents
were also asked their party choice if municipal elections were held tomorrow. We considered running the
model separately with the dependent variable set to party choice in a local election, be it the ANC or an
opposition party. However, only 6% of the respondents choose differently in a national and local election
when choosing between either the ANC or any opposition party. Using a marginal homogeneity test we
found that this difference is statistically significant (see end notes).
We included variables to control for: age, race, income level, urban versus rural, gender, work status,
education level, grant recipient versus non-recipient and whether recipients agreed with the statement “I
am afraid that if another party comes to power social grants will stop”. The latter is a scale variable ranging
from 1 ‘strongly disagree’ to 5 ‘strongly agree’, with each unit increase representing a higher degree of
agreement with the statement.
We conducted statistical tests and found the model to be satisfactory for collinearity and good fit.
Findings of the logistic regression model
The results from the logistic regression are shown below in Table 2: Variables in the equation. Of the
sample of 3460, we excluded 1691 cases from our analysis due to missing data.9 The analysis was therefore
conducted on 1769 cases.
The importance of democratic rights and the perception of governance are shown to be significant in
determining whether a respondent voted for the ANC or an opposition party. However, the importance of
socio-economic rights and perception of corruption are not significant. In the previous wave perception of
corruption was a significant predictor of political party choice. As with previous waves, race and the fear
of loss of social grants if another party comes to power are statistically significant. But in this wave age
and level of education are also significant, which was not the case in wave 3 (though age was a significant
predictor of party choice in wave 2). Grant receipt is once again not a significant predictor of party choice.
The significance of control variables has varied across the waves, but race and the fear of loss of social
grants have been found to be consistently significant.
8
In previous waves the statement respondents were asked to rank their views on was: Enough is being done to root out corruption.
9
The analysis excludes respondents who refused to answer or said they did not know in response to any of the variables/questions included in the
model, for instance, we excluded all respondents who did not provide their income.
FACTORS DETERMINING VOTER CHOICE BETWEEN 2017 AND 2020 11Table 2: Variables in the equation
95% C.I.for EXP(B)
B S.E. Wald df Sig. Exp(B)
Lower Upper
Step 1a Governance 0,651 0,074 78,058 1 0,000 1,918 1,660 2,216
SocEcRights 0,040 0,061 0,424 1 0,515 1,041 0,923 1,173
DemocRights -0,193 0,060 10,323 1 0,001 0,824 0,733 0,927
Corruption 0,067 0,049 1,876 1 0,171 1,070 0,971 1,178
Age 0,255 0,110 5,397 1 0,020 1,290 1,041 1,600
White -2,220 0,244 82,830 1 0,000 0,109 0,067 0,175
IndAsian -1,726 0,342 25,424 1 0,000 0,178 0,091 0,348
Coloured -1,927 0,205 88,422 1 0,000 0,146 0,097 0,218
Income 0,013 0,008 2,365 1 0,124 1,013 0,997 1,029
Area 0,223 0,148 2,280 1 0,131 1,250 0,936 1,671
NotWorking -0,178 0,187 0,909 1 0,341 0,837 0,580 1,207
Unemployed -0,137 0,177 0,598 1 0,439 0,872 0,616 1,234
Education -0,105 0,052 4,117 1 0,042 0,901 0,814 0,996
Gender 0,231 0,122 3,544 1 0,060 1,259 0,991 1,601
Grant -0,073 0,144 0,259 1 0,611 0,930 0,702 1,232
Fear of Loss of Grant 0,222 0,047 22,174 1 0,000 1,249 1,139 1,370
Constant -1,327 0,457 8,418 1 0,004 0,265
a. Variable(s) entered on step 1: Governance, SocEcRights, DemocRights, Corruption, Age, White, IndAsian, Coloured, Income, Area,
NotWorking, Unemployed, Education, Gender, Grant, Fear of Loss of Grant.
Findings of model one are summarised as follows: The higher the perception of good governance (i.e. the
higher the level of trust a respondent had in institutions) the more likely the respondent would vote for the
ANC. The odds of a respondent voting for the ANC increased by a factor of 1,918 for each additional unit
of trust in institutions the respondent held, all other factors being equal (“ceteris paribus”). In other words,
for each additional unit of trust, a respondent is 92% more likely to vote ANC over an opposition party
compared to someone exhibiting one unit less of trust, on the scale from 1 (very unlikely to have trust in an
institution) to 5 (very likely to trust in institution). It is unsurprising that the more trust a respondent has in
institutions presently, the more likely they are to vote for the ANC over an opposition party, since the ANC is
the incumbent party overseeing many of the present operations of these institutions. In the previous wave
the odds of voting ANC increased by 1,676 (down from 1,840 in wave 2 and up from 1,398 in Wave 1) for each
additional unit of Governance/Trust in institutions. In Model 2 below we unpack trust in institutions further.
As in the third wave, the importance of democratic rights is significant, though the importance of socio-
economic well-being is not. The model shows that the higher the importance of democratic rights is rated
(measured on a scale of 1 to 5), the less likely the respondent would be to support the ANC. The odds of a
respondent voting for the ANC decreased by a factor of 0,824 (previously 0,849) for each additional unit of
agreement in the importance of democratic rights (“ceteris paribus”). It is easier to conceive of the likelihood
if we flip the odds ratio here which reveals that each additional unit of disagreement results in a 21% increase
in the likelihood of supporting the ANC. This has a cumulative effect, so someone who strongly disagreed
with the importance of democratic rights is twice (2.17 times) as likely to support the ANC, than someone
who strongly agreed to the importance of democratic rights.
Our age variable is constructed in three categories: 18-34 years, 35-60 years and older than 60 years. The
odds of a respondent voting for the ANC increased by a factor of 1,290 for each advance in age category,
all other factors being equal (“ceteris paribus”). In other words, someone in the 35-60-year age group is 29%
more likely to vote ANC over an opposition party, when compared to someone in the 18-34 age group.
In terms of race, black is taken as the reference category. Therefore, each other race is contrasted to the
likelihood of a black respondent supporting the ANC. We find that black respondents are 6 times as likely
as Indian/Asian respondents (previously 7 times), 7 times as likely as coloured respondents (previously 14
times) and 9 times as likely as white respondents (previously 20 times) to support the ANC over an opposition
party (“ceteris paribus”).
12 FACTORS DETERMINING VOTER CHOICE BETWEEN 2017 AND 2020Education is coded on a nine point scale from ‘no schooling’ equal to 1 through to an ‘honours/post
graduate degree’ equal to 9. We find that for each level advanced, a respondent is 11% more likely to vote
for an opposition party over the ANC. This means that someone with an honours/post graduate degree is
two and a half times as likely to vote for an opposition party over the ANC compared to someone with no
schooling, ceteris paribus.
In all waves whether respondents actually received a grant or not is not significant. But the fear of losing
grants matters by contrast. On a scale of 1 “strongly disagree” to 5 “strongly agree”, a unit increase in
agreement with the statement “I am afraid that if another party comes to power social grants will stop”
means a respondent is 25% more likely to support the ANC over an opposition party (up from 13%
previously). So, someone who strongly agrees with the statement is nearly two and a half times (2,4 times)
more likely to support the ANC than someone who strongly disagrees with the statement. This is in line
with our findings in previous waves.
Alternative scenario
In addition to the basic model, we ran a second model to better understand the effect of trust in
government on political party choice of voters.
The second model includes an additional variable to indicate whether recipients answered that their
reason for party choice was that they believed the party “brought freedom and democracy”. Furthermore,
trust in the Presidency under President Ramaphosa is added to the model as a separate variable, and the
governance index is amended to exclude this variable. This follows a similar approach to the previous waves.
We included 1758 cases in the analysis, excluding 1702 cases due to missing data. As before, the additional
model is satisfactory for collinearity and good fit.
Table 2: Variables in the equation, Model 2 Trust in Ramaphosa as a separate variable
95% C.I.for EXP(B)
B S.E. Wald df Sig. Exp(B)
Lower Upper
Step 1a Governance 0,338 0,078 18,886 1 0,000 1,402 1,204 1,632
SocEcRights 0,020 0,063 0,097 1 0,755 1,020 0,902 1,153
DemocRights -0,236 0,062 14,585 1 0,000 0,789 0,699 0,891
Corruption 0,070 0,051 1,884 1 0,170 1,072 0,971 1,185
Age 0,248 0,112 4,881 1 0,027 1,282 1,028 1,598
White -2,196 0,248 78,547 1 0,000 0,111 0,068 0,181
IndAsian -1,665 0,360 21,366 1 0,000 0,189 0,093 0,383
Coloured -1,891 0,210 81,480 1 0,000 0,151 0,100 0,227
Income 0,012 0,008 1,961 1 0,161 1,012 0,995 1,029
Area 0,234 0,151 2,393 1 0,122 1,264 0,939 1,701
NotWorking -0,198 0,191 1,078 1 0,299 0,820 0,565 1,192
Unemployed -0,099 0,182 0,294 1 0,588 0,906 0,634 1,294
Education -0,098 0,053 3,407 1 0,065 0,907 0,817 1,006
Gender 0,170 0,126 1,832 1 0,176 1,186 0,927 1,517
Grant -0,060 0,147 0,168 1 0,682 0,942 0,706 1,256
Fear of Loss of Grant 0,227 0,049 21,967 1 0,000 1,255 1,141 1,381
Freedom and
0,819 0,136 36,555 1 0,000 2,269 1,740 2,959
Democracy to SA
Trust in Ramaphosa 0,867 0,139 38,717 1 0,000 2,381 1,812 3,129
Constant -0,872 0,472 3,420 1 0,064 0,418
a. Variable(s) entered on step 1: Governance*, SocEcRights, DemocRights, Corruption, Age, White, IndAsian, Coloured, Income, Area,
NotWorking, Unemployed, Education, Gender, Grant, Fear of Loss of Grant, Freedom and Democracy to SA, Trust in Ramaphosa.
*Governance excludes trust in President Ramaphosa
FACTORS DETERMINING VOTER CHOICE BETWEEN 2017 AND 2020 13In this model, governance – amended to exclude trust in the Presidency – and the importance of democratic rights to respondents are again found to be significant, whereas importance of socioeconomic rights and perception of corruption are not significant. Age, race and the fear of loss of social grant are once again significant predictors of party choice. Education and the constant value are not significant at the 5% significance level but remain significant at the 10% significance level. The two additional variables included in this model – citing as a reason for party choice that the party brought freedom and democracy to South Africa, and trust in the Presidency under President Ramaphosa – are both significant, as was found in previous waves. The magnitude of effect of perception of importance of democratic rights, age, race and fear of loss of social grant, all significant in determining the likelihood of voting for the ANC, is similar in this model to that of the first, explained above. With regard to the perception of good governance (i.e. level of trust a respondent had in institutions), amended in this model to exclude trust in the President, the odds of a respondent voting for the ANC increased by a factor of 1,402, declining from 1,918 in the first model. This means that in the first model, for each additional unit of trust, a respondent is 92% more likely to vote ANC over an opposition party compared to someone exhibiting one unit less of trust, on the scale from 1 (very unlikely to trust in an institution) to 5 (very likely to trust in an institution). But in the second model this likelihood declines to 40%. This suggests that the reason a respondent with high levels of trust in government and institutions is more likely to vote for the ANC over an opposition party has largely to do with their trust in President Ramaphosa. It is unsurprising, then, that when we separated trust in President Ramaphosa, included in this model as a distinct variable, it is found to be a significant predictor of voting choice. Trust in the Presidency is measured on a scale of 1 “very unlikely to trust the institution” to 5 “very likely to trust the institution”. We recoded this variable as a binary variable in the model, such that trust in the Presidency = 0 if respondents said they were ‘unlikely’ or ‘very unlikely’ or ‘neither likely or unlikely’ to trust in the presidency and 1 if respondents said they were ‘likely’ or ‘very likely’ to trust in the presidency. The odds of a respondent voting for the ANC increase by a factor of 2,381 (more than twice as likely) for those who have trust in the Presidency compared to those who expressed distrust in the presidency or felt neutral about the presidency. In the previous report, those who trusted in the presidency under Ramaphosa were five times more likely to support the ANC over an opposition party than those who did not have trust in the presidency. It is not surprising that respondents with higher levels of trust in President Ramaphosa are more likely to vote for the ANC over an opposition party. The second additional variable in model 2 is also found to be a significant predictor of party choice. Respondents who answered that their reason for party choice was that they believed the party “brought freedom and democracy”, were more than twice as likely to vote ANC over an opposition party compared to those who did not provide this reason, as was found in the previous report. This suggests party loyalty is still important to voters. Comparison across the four waves of the regression model: which factors matter most? The regression model provides a sound indication of the factors that influenced voter choice in national and provincial elections and at local government level. Firstly, we find that across all four waves of this study, the following were significant predictors of people’s choices, although these may vary in magnitude between the different periods when the surveys were conducted. These factors are trust in institutions (governance), race as a predictor of voter choice, and the perceived fear of loss of a social grant if a person voted for an opposition party. Secondly, age is significant in all waves except wave 3. Thirdly, perception of corruption is significant across the first three waves but not in wave 4; this is elaborated on in the concluding section. Fourthly, the perceived importance of democratic rights was also a significant predictor in waves 3 and 4. Fifthly, trust in President Ramaphosa was significant when introduced to the model in wave 2 and in all subsequent waves. Finally, socio-economic rights implementation and gender were predictors in the first wave but not in subsequent waves, while having democratic rights such as voting, freedom of expression and access to courts were considered important in waves 3 and 4. 14 FACTORS DETERMINING VOTER CHOICE BETWEEN 2017 AND 2020
A separate regression model was run for local government using the same variables but also including
additional factors such as employment creation and service delivery issues. There were no discernible
differences between the factors that drive prospective voter choice at local level compared to national
and provincial elections. However, in both national and local government elections, trust in one’s party of
choice were ranked highly while job creation and service delivery were major reasons for party choice at
municipal level.

Discussion and conclusions
This four-year study set out to understand whether and to what extent socio-economic well-being is
an important influencer of voter choice in contemporary South Africa. This is important because the
legitimacy of South Africa’s constitutional democracy depends largely on whether it relates to peoples’
social experiences and serves their needs. There is considerable evidence to support this proposition,
although it is more nuanced. Concerns about socio-economic well-being (support for the statement that
the party will bring a better life) was the main reason respondents gave for their choice of a political party
across all four waves. It was also a statistically significant predictor of voter choice in our model in 2017,
but this factor became less important after the leadership changes in the governing party. It is likely that
socio-economic well-being may be moderated by other factors such as trust in the presidency of Cyril
Ramaphosa and party loyalty. Further exploratory statistical analyses will be needed.

Fear of loss of a social grant if a respondent supported an opposition party was a consistent predictor of
party choice across all waves. The expansion of social assistance through the introduction of the Social
Relief of Distress Grant during the Covid-19 pandemic seemed to allay these concerns to some extent,
although four out of ten respondents continued to express this fear. This suggests that potential voters
do make rational choices based on their needs and fears. Contrary to popularly held views that social grant
receipt is a form of vote buying, we found that it is not a predictor of party preference. This is despite
the fact that grant beneficiaries are more likely to vote for the ANC than non-beneficiaries, although
support is spread across both groups. The reason for the former has to do more with the sheer size of the
grants system, accompanying entitlements, and widespread support for the government’s social grants
policy, rather than an indication of vote buying or clientelism (Van de Walle, 2003). The latter model
contends that politicians use their power to provide economic privileges or material support in exchange
for political support.

The above is in keeping with the rational choice model of voting behaviour which suggests that voters
make their choices based on rational considerations motivated by self-interests (Chandler, 1988; Brooks,
Nieuwbeerta and Manza, 2006; Patel et al., 2014). Closely related factors that are pertinent and that were
assessed included perceptions of governance such as trust in institutions, government performance and
progress in addressing corruption. The party choice of a respondent depends largely on whether they
perceive the government positively or negatively on these measures. This changed significantly after the
appointment of Cyril Ramaphosa as leader of the governing party and the government. Perceptions of
corruption were highly significant across the first three waves. In wave 4, the question was changed to
gauge perceptions about whether government was addressing corruption decisively through different
measures such as arresting people, sentencing them, recovering monies and holding politicians and
officials accountable. It appears that the current actions are viewed positively and, in wave 4, corruption
was not a factor in voter preference. However, perceptions of corruption during the pandemic had a
negative effect on how respondents viewed the ANC. This factor was not a predictor in our model, but it
could not have helped the ANC’s popularity, which declined in wave 4 to 52% – its lowest level and similar
to wave 1 (52%).

In this study we also tested several other explanatory models of voting behaviour besides rational choice
and clientelistic models. The sociological model also informed our analysis and was based on social
determinants such as race, class, gender and education. We found that race continued to be consistently
a predictor of voter preference over all the waves. In regard to gender, women shifted their support away
from the ANC towards the opposition in 2017 during the presidency of Jacob Zuma. In wave 4, a greater
proportion of women grant beneficiaries and non-beneficiaries support the governing party compared

                                       FACTORS DETERMINING VOTER CHOICE BETWEEN 2017 AND 2020              15
to the proportion of male grant beneficiaries and non-beneficiaries. Age also remained a consistent predictor of voter choice with younger people being less likely than older persons to support the ANC than opposition parties. Lastly, the party identification model which has been used to explain voting preferences in South Africa (Habib and Naidu, 2006) also informed our analysis; namely, the extent to which party choice is guided by support for the party that brought freedom and democracy. We do not find evidence for this in wave 1 during the presidency of Jacob Zuma. However, trust in the presidency of Cyril Ramaphosa emerged as a significant predictor across the subsequent three waves (2018-2020) (Sadie and Patel, 2020). While trust in institutions declined over this same period, trust in the President did not. In fact, it increased from 54% in wave 3 to 60% in Wave 4, which may be attributed to the view that he and the government did a good job in managing the coronavirus pandemic. This does confirm the importance of political leadership as a predictor of voting behaviour in the current South African scenario. Contextual factors such as leadership changes in the governing party and the management of the pandemic are other factors that appear to hold sway. We do not find that people are likely to vote very differently in national and local elections although concerns about job creation, government performance in service delivery and the poor quality of service delivery remain significant challenges for prospective voters in the run-up to the 2021 local government elections. Approximately 6% of respondents indicated that they could vote differently in the national and the local elections. Supporters of a specific party may therefore vote for an efficient councillor of a different party in their ward. This may also be important for party control of some municipalities and metros. In conclusion, we found that a range of intersecting factors explain voting preferences in South Africa over the past four years. While existing models of voting behaviour are helpful in understanding voter choices, specific factors that have emerged from our research that influence party choice include the importance of democratic rights, perceptions of good governance, in particular the prevalence of corruption and the performance of the president, which results in trust in the president and the fear of loss of social grants if the party in power changes. Furthermore, it is evident that party loyalty is not fixed, and it can rise and wane in significance as voters become disillusioned with the status quo. Voters are therefore driven by rational considerations in their choice of a party in elections. 16 FACTORS DETERMINING VOTER CHOICE BETWEEN 2017 AND 2020
Notes
Endnote 1: Research questions

Question UJ1.1
ASK IF RESPONDENT SELECTED POLITICAL PARTY IN QD31A OPTION 1-14
MMP UP TO 5 SELECTIONS
ROTATE STATEMENTS
READ OUT
SHOW THE RESPONDENT THE SCREEN AND POINT OUT THE POSSIBLE ANSWERS TO THE QUESTION
Why did you choose the party you did for the National Election? What motivates you to vote for this party to
form a national government in South Africa?
Please select your top FIVE reasons
  1    It pays social grants, and I am afraid that another party will stop social grants                       -1
  2    This party brought freedom and democracy to South Africa                                                -2
  3    This party promises a better life/ A better life for all                                                -3
  4    You trust this party                                                                                    -4
  5    You have always supported this party/our family has always supported this party                         -5
  6    Because of the leader of the party you voted for/I support the party leader                             -6
  7    It is a party for mainly black people                                                                   -7
  8    It is a party for mainly white people                                                                   -8
  9    It is a party for everybody/all South Africans                                                          -9
 11    The party will offer me money, a house, a job, food parcels or something in return for my vote          -11
 12    The party is not corrupt                                                                                -12
 13    The party is now actively committed to root out corruption                                              -13
 14    This party is doing a good job in handling the COVID-19 pandemic                                        -14
 15    Don’t know (ANCHOR)                                                                                     -15
 16    Refused (ANCHOR)                                                                                        -16

Question UJ1.2
ASK IF RESPONDENT SELECTED POLITICAL PARTY IN QD31B OPTION 1-14
MMP UP TO 5 SELECTIONS
ROTATE STATEMENTS
READ OUT
SHOW THE RESPONDENT THE SCREEN AND POINT OUT THE POSSIBLE ANSWERS TO THE QUESTION
And why did you choose the party you did on the Local Government Election ballot paper? Why do you intend to
vote for this party in your local area?
Select the top FIVE reasons only.
  1    The party brought freedom and democracy to the country                                                  -1
  2    The party is not corrupt                                                                                -2
  3    The party is addressing corruption                                                                      -3
  4    This party will prioritise the delivery of good quality and reliable services such as clean water,      -4
       electricity, sewage, rubbish removal
  5    The party will deliver free water, electricity and sanitation for people who cannot afford it           -5
  6    The party will deliver more efficient municipal transport                                               -6
  7    This party will stimulate job creation in communities                                                   -7

                                          FACTORS DETERMINING VOTER CHOICE BETWEEN 2017 AND 2020                 17
8 This party will make land available for housing and upgrade services in informal settlements -8
9 The party will enforce municipal by-laws such as building regulations, trading, health, safety and -9
security, noise, outdoor advertising
10 The party will fix roads, potholes, street lights, water leaks, fix burst pipes and storm water drainage -10
11 The party will deliver more efficient municipal and emergency services such as firefighting, -11
ambulances, licensing, childcare, and fix billing problems
12 This party will employ competent people who can do the job -12
13 I trust this party -13
14 I like the leader of this party -14
15 Don’t know (ANCHOR) -15
16 Refused (ANCHOR) -16
Question UJ3.1
ASK IF 17 YEARS OLD AND OLDER
OMO
READ OUT
SHOW THE RESPONDENT THE SCREEN AND POINT OUT THE POSSIBLE ANSWERS TO THE QUESTION
How likely are you to consider voting for a councillor who is not from your party of choice?
1 Very likely to consider -1
2 Somewhat likely to consider -2
3 Neither likely nor unlikely to consider -3
4 Somewhat unlikely to consider -4
5 Very unlikely to consider -5
6 Don’t know if I will consider this -6
7 It is too early to say -7
8 Refused to answer (DNRO) -8
Question UJ3.2
ASK IF OPTION 1 (VERY LIKELY TO CONSIDER) OR OPTION 2 (SOMEWHAT LIKELY TO CONSIDER) IN
QUESTION UJ3.1
RANK MAXIMUM 6 RESPONSES
READ OUT
SHOW THE RESPONDENT THE SCREEN AND POINT OUT THE POSSIBLE ANSWERS TO THE QUESTION
What would your reasons be for doing so? Would you please rank the following 6 reasons in order of importance
for you?
1 I want to choose a person who is efficient to be my councillor -1
2 I want to choose someone who listens to residents in my community -2
3 I want my ward councillor because he/she does more for our community than the councillor from -3
my political party of choice.
4 I want to trust my councillor -4
5 I want a councillor who is not corrupt -5
6 I want to vote for a councillor who communicates with me and reacts to problems in my area -6
7 Don’t know (DNRO) -7
8 Refused to answer (DNRO) -8
18 FACTORS DETERMINING VOTER CHOICE BETWEEN 2017 AND 2020Question UJ10
ASK ALL
OMO PER STATEMENT
READ OUT
SHOW THE RESPONDENT THE SCREEN AND POINT OUT THE POSSIBLE ANSWERS TO THE QUESTION
On a scale from 1 to 5 where 1 is “strongly disagree” and 5 is “strongly agree”, please tell me your views on the
following:
Neither Don’t Know
Strongly Strongly
Statement Disagree agree nor Agree / Refused
Disagree Agree
disagree (DNRO)
1 Democratic rights like
voting, access to courts,
-1 -2 -3 -4 -5 -99
freedom of speech and
expression are important
2 Socio-economic well-
being, meeting your basic
-1 -2 -3 -4 -5 -99
needs, jobs, income,
housing etc. are important
3 Corruption is currently
being dealt with decisively
e.g. people are being
arrested, charged,
-1 -2 -3 -4 -5 -99
sentenced, monies are
being recovered, and
politicians and officials are
held accountable
4 I am afraid that if another
party comes to power -1 -2 -3 -4 -5 -99
social grants will stop
5 Our government handled
the Covid-19 pandemic -1 -2 -3 -4 -5 -99
well
6 Pres Cyril Ramaphosa
did a good job during the -1 -2 -3 -4 -5 -99
Covid-19 pandemic
7 The alleged corruption
by government officials
during the Covid-19 -1 -2 -3 -4 -5 -99
pandemic made me more
negative about the ANC
8 The Covid-19 pandemic
has a negative impact
-1 -2 -3 -4 -5 -99
on the income of my
household
9 People in my household
suffer more from stress
-1 -2 -3 -4 -5 -99
and other illnesses during
the Covid-19 pandemic
10 Adults and children in
my household often had
to go hungry during the
-1 -2 -3 -4 -5 -99
Covid-19 pandemic, as
we did not have enough
money for food
FACTORS DETERMINING VOTER CHOICE BETWEEN 2017 AND 2020 19Question UJ1.2.4
ASK ALL
OMO PER STATEMENT
RANDOMISE STATEMENTS
READ OUT
SHOW THE RESPONDENT THE SCREEN AND POINT OUT THE POSSIBLE ANSWERS TO THE QUESTION
REPEAT SCALE WHERE NECESSARY
I am going to name a few institutions. For each one I read out to you, could you tell me how much you trust each
institution, would you say that you are 1 – Not at all likely to, 2 – Not very likely to, 3 - Neither likely nor unlikely
to, 4 – Very likely to, or 5 - Extremely likely to…
Neither Don’t Know
Not at all Not very Very Extremely
Institution likely nor / Refused
likely to likely to likely to likely to
unlikely to (DNRO)
1 Trust the Presidency
-1 -2 -3 -4 -5 -99
(President Cyril Ramaphosa)
2 Trust the Courts -1 -2 -3 -4 -5 -99
3 Trust the Department of
-1 -2 -3 -4 -5 -99
Social Development
4 Trust Parliament -1 -2 -3 -4 -5 -99
5 Trust the South African
-1 -2 -3 -4 -5 -99
Police
6 Trust the Media -1 -2 -3 -4 -5 -99
7 Trust SASSA SA Social
-1 -2 -3 -4 -5 -99
Security Agency
8 Trust my current local
-1 -2 -3 -4 -5 -99
councillor
QUJ10 ASK ALL
OMO
SHOWCARD QUJ10
READ OUT
On a scale from 1 to 5 where 1 is “strongly disagree” and 5 is “strongly agree”, please tell me your
views on the following:
1 2 3 4 5 99
STRONGLY DISAGREE NEITHER AGREE STRONGLY DON’T
DISAGREE AGREE NOR AGREE KNOW /
DISAGREE REFUSED
(DNRO)
Democratic rights like
voting, access to courts,
1 -1 -2 -3 -4 -5 -99
freedom of speech and
expression are important
Socio-economic well-
being, meeting your basic
2 -1 -2 -3 -4 -5 -99
needs, jobs, income,
housing etc. are important
Corruption is currently
being dealt with decisively
e.g. people are being
arrested, charged,
3 -1 -2 -3 -4 -5 -99
sentenced, monies are
being recovered, and
politicians and officials
are held accountable
20 FACTORS DETERMINING VOTER CHOICE BETWEEN 2017 AND 2020I am afraid that if another
4 party comes to power -1 -2 -3 -4 -5 -99
social grants will stop
Our government handled
5 the Covid-19 pandemic
well
Pres Cyril Ramaphosa
6 did a good job during the
Covid-19 pandemic
The alleged corruption
by government officials
7 during the Covid-19
pandemic made me more
negative about the ANC
The Covid-19 pandemic
has a negative impact
8
on the income of my
household
People in my household
suffer more from stress
9
and other illnesses during
the Covid-19 pandemic
Adults and children in
my household often had
to go hungry during the
10
Covid-19 pandemic, as
we did not have enough
money for food
Endnote 2: Test for reliabilities
The Governance variable is constructed as a composite indication of level of trust in institutions, by
calculating the average score of a respondent for seven questions gauging level of trust in various
institutions in South Africa.
We tested the reliability of the items of the Governance factor in measuring trust in institutions using
Cronbach’s Alpha, which measured 0,88. According to Pavot, Diener, Colvin and Sandvik (1991) there is
good internal consistency with a Cronbach alpha coefficient reported of at least 0,85. Values above 0.7
are considered to be acceptable (Pallant, 2007). This factor is therefore a reliable measure of trust in
institutions (which we term here “governance”).
We amended the Governance index to exclude the question on whether respondents trust in the
Presidency in the second model, as this question was used as a separate predictor in the model. When
the Governance index is amended to exclude Trust in the Presidency under President Ramaphosa the
measure for Cronbach’s Alpha is 0,87. This suggests there is still good internal consistency reliability for
the index.
Endnote 3: Fischer’s test of statistical significance
i. Comparison of grant recipients vs. non-recipients in voting choice
Using Fisher’s Exact Test, we show that there is a statistically significant association between grant
recipients and non-recipients in terms of voter choice. The Fisher’s Exact Test p-value is 0,000. A higher
proportion of grant recipients voted for the ANC, than non-recipients. The magnitude of the effect,
however, is small. The phi coefficient value is 0,057. This is considered small using Cohen’s (1988) criteria
of 0,10 for small effect; 0,30 for medium effect; and 0,50 for large effect.
FACTORS DETERMINING VOTER CHOICE BETWEEN 2017 AND 2020 21You can also read