CES 2018 - Driving the Future of Mobility - Strategy Presentation Bitte decken Sie die schraffierte Fläche mit einem Bild ab - The site can't ...
←
→
Page content transcription
If your browser does not render page correctly, please read the page content below

Bitte decken Sie die schraffierte Fläche mit einem Bild ab.
                   Please cover the shaded area with a picture.
                                 (24,4 x 11,0 cm)

CES 2018 – Driving the Future of Mobility
Strategy Presentation

                                                       Dr. Elmar Degenhart – CEO
AGENDA

1 Automotive Trends                                                                      3
2 Key Enabler: Digitalization                                                            5
3 Electrification                                                                        9
4 Automated Driving                                                                    12
5 Holistic Connectivity                                                                17
6 Tires: No Disruption but Evolution                                                   20
7 ContiTech – Smart Solutions beyond Rubber                                            23
8 Continental Strategy – Outlook 2020 and Beyond                                       25

                                               Capital Markets Day at CES - January 9, 2018
                                               EDMR – Equity and Debt Markets Relations       2
1) Automotive Trends
   New Business Opportunities Arise
 › Revenue pool for suppliers reached more                                               Global Supplier Revenue Pool (bn €)
   than €1 trn in 2017
 › Business related to “established” business
   will grow by ~1% p.a. and reach ~€1.1 trn in
   2025                                                                                                       30% p.a.

 › Revenues share of Electrification1,
   Automated Driving and Holistic Connectivity
   represented in total €200 bn in 2025
 › It will account for ~15% of the overall
   supplier revenue market by 2025

                                                                                                New Business Opportunities
                                                                                                Established Business
Sources: Roland Berger and Continental estimates. FX rate assumption 1.13 EUR/USD.
1) Not including market for electric vehicle batteries but including hybrid solutions.

                                                                                                   Capital Markets Day at CES - January 9, 2018
                                                                                                   EDMR – Equity and Debt Markets Relations       3
1) Automotive Trends
   Four ACES1: We Shape the Future of Our Industry
      Automated Driving                                         Holistic Connectivity                                                Electrification

               TAM2 in bn €                                                  TAM2 in bn €4                                              TAM2 in bn €3

                                                                       Shared Mobility
Sources: McKinsey and Continental estimates

                                  1) Four ACES: autonomous, connected, electrified and shared mobility
                                  2) Total Addressable Market                                                           Capital Markets Day at CES - January 9, 2018
                                  3) Not including market for batteries but hybrid solutions                            EDMR – Equity and Debt Markets Relations       4
                                  4) McKinsey estimates a market for digital services of US70$ - 110 billion in 2025;

                                    FX rate assumption of 1.13 EUR/USD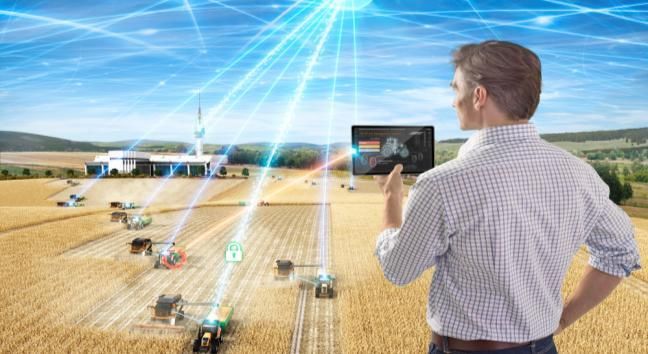
2) Key Enabler: Digitalization
   The Most Digitalized Portfolio in The Supplier Sector 1

Source: Company filings and Continental estimates   1   Suppliers >€3 bn sales

                                                                                 Capital Markets Day at CES - January 9, 2018
                                                                                 EDMR – Equity and Debt Markets Relations       5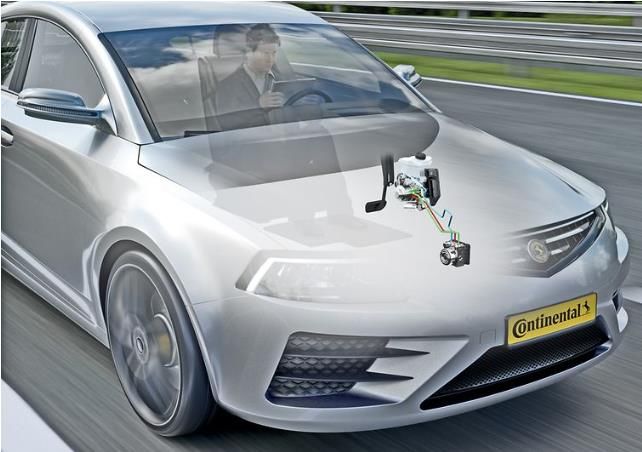
2) Key Enabler: Digitalization
   Strong Order Intake Drives Sustainable Growth…
                     Automotive Group: Strong Order Intake (bn €)

                                                                     1

1
    Lifetime Sales

                                                           Capital Markets Day at CES - January 9, 2018
                                                           EDMR – Equity and Debt Markets Relations       6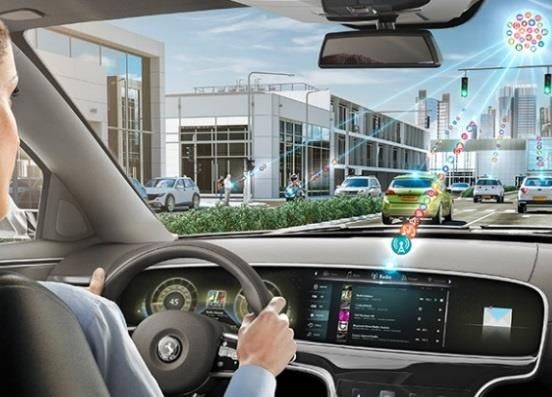
2) Key Enabler: Digitalization
   … but Causes Sustained high R&D and Capex

    Automotive Group R&D (mn €)           Automotive Group Capex (mn €)

                                  R&D and capex have a
                                   lead time of about 2-3
                                  years and the increase
                                         is mainly a
                                    consequence of the
                                     strong order intake

                                                            Capital Markets Day at CES - January 9, 2018
                                                            EDMR – Equity and Debt Markets Relations
                                                                                                           7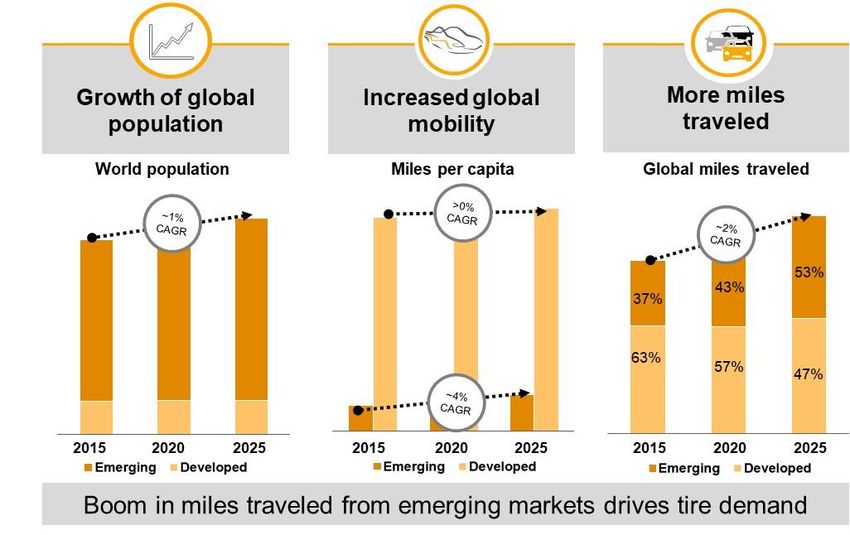
2) Key Enabler: Digitalization
   Which in the Future Leads to Higher ROCE
    Automotive Group Avg. Operating Assets excl. Goodwill Acquired Before 2009

                                                     Target range 25-35%

                                                        Capital Markets Day at CES - January 9, 2018
                                                        EDMR – Equity and Debt Markets Relations       8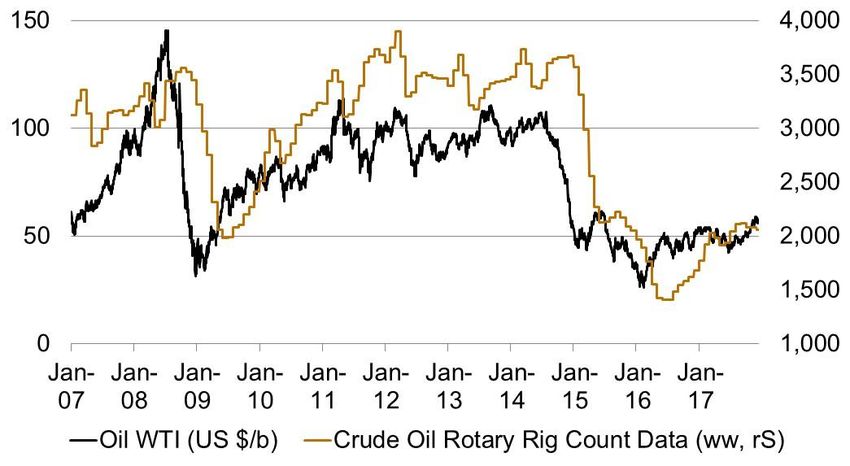
3) Electrification
   Engine Roadmap 2017 to 2025 – Electrification View
                                           Global PC & LT Production
  ›   Until 2025 the internal combustion
                                           by Engine Type (mn units)
      engine (ICE) will be the most
      dominant force amongst the
      different propulsion types
  ›   More variants of hybridization due
      to decline in Diesel
  ›   Strong increase in pure Electric
      Vehicles after 2025
  ›   Breakthrough in battery technology
      might accelerate scenario

Source: Continental estimates

                                                Capital Markets Day at CES - January 9, 2018
                                                EDMR – Equity and Debt Markets Relations       9
3) Electrification
   Order Intake Confirms Shift to Electronics & Electrification

                                     Order Intake
                                                    ∑ € >13 bn            ∑ € ~7.7 bn

1
    Order Intake as Lifetime Sales

                                                                 Capital Markets Day at CES - January 9, 2018
                                                                 EDMR – Equity and Debt Markets Relations       10
3) Electrification
Relative Value of Continental’s Content in Powertrains1
Gasoline-related Diesel-related HEV-related BEV-related
business business business including business including
extended offering extended offering
100%1 160% 160-360% 400%
› Engine management › Engine management › Engine management › High-voltage axle drive
systems for solenoid systems for diesel piezo systems (gasoline/diesel)
direct injection (injector, common-rail injection › Power electronics
› Exhaust aftertreatment
ECU, pressure pumps) (injector, ECUs, › Onboard charging
pressure pumps) › Sensors and actuators systems
› Exhaust aftertreatment
› Turbochargers
› Exhaust aftertreatment › Battery management
› Sensors and actuators and
› Sensors and actuators › 48V solutions systems
› Turbochargers (12kW/ 15kW/ 25kW)
› DC/DC converter
or
› Plug-in hybrid solutions › Thermal management
(incl. thermal components &
charging systems)
components
Well positioned in all key technologies!
1
Value of displayed gasoline content per car is indexed at 100%; all other values read relative to the gasoline content
Capital Markets Day at CES - January 9, 2018
EDMR – Equity and Debt Markets Relations 114) Automated Driving
Market for Automated Driving: Estimated Development
PC&LV production (mn units)
L0-L2 L3 L4 L5 Total Market
Capital Markets Day at CES - January 9, 2018
EDMR – Equity and Debt Markets Relations 124) Automated Driving
Market for Automated Driving: Three-Layer Model
Recent Additions to the Portfolio
Market for Automated Driving
~€35 bn1 by 2025 Cooperation/
Joint Venture
Sensors
Components DIGILENS
~€26 bn
ADCU
Electronics
Software HUAWEI easyMILE
System
Integration
~€7 bn BMW intel NTT docomo
Software
Environmental China
Electronics here Baidu
Model unicom
~€2 bn
1
Source: Continental estimates
Capital Markets Day at CES - January 9, 2018
EDMR – Equity and Debt Markets Relations 134) Automated Driving
ADAS Sensors per Car
Sensors 441 BMW
per car
401 GM
232
Surround View Camera
162
Ultrasonic3 3D Flash Lidar
62
Short Range Long Range
Level 2 Level 3 Level 4/5 Radar
Radar
1
Source: https://www.bmwgroup.com/content/dam/bmw -group-websites/bmwgroup_com
/ir/technologie_workshops/Technology_Workshops_Autonomous_Driving.pdf Capital Markets Day at CES - January 9, 2018
https://www.gm.com/content/dam/gm/events/docs/5265893 -685163-Chartset-11-30-2017 EDMR – Equity and Debt Markets Relations 14
2
Continental estimates
3
Ultrasonic not in Continental portfolio4) Automated Driving
Leading Position in ADAS
System Manufacturers Component Suppliers
Sales (€ mn)
~2,500
Incl. Elektrobit, HMI and HuD
OI
OI
2017:
2016: OI OI
~€3.5
€3.5 bn
bn 2016: 2016: n/a n/a
€0.4 bn €1.3 bn
1
Continental ADAS = Radar, Lidar, Camera and ADCUs, 2017 OI includes ADAS related CVAM business OI
2
Bosch PR May 4th, 2017; Bosch has not communicated any future ADAS sales target; Bosch includes ultrasonic in ADAS sensors; Bosch target is a 2019 target
3
Denso reports ADAS sales as part of “Information and safety systems”; Denso’s ADAS target 03/2021 looks for JPY 200 bn; sales are annualized
4
Autoliv active safety products: radar systems, vision and night systems, active seatbelts and brake systems, dynamic spot light and s ystem integration; 2020 target
5
Mobileye 2016 sales; company has the target to achieve 1.1 bn USD sales by 2019
6
Hella: according to Jeffries Research
7
Delphi 2016 sales represent company communication from Q2 2016 and target to achieve 1 bn USD sales by 2019
8
Valeo reports sales for comfort and driving assist only. It includes rain, lighting and ultrasonic sensors in DA sales; it has no official target for future ADAS sales communicated
9
ZF has not provided any sales data on its ADAS business
Capital Markets Day at CES - January 9, 2018
EDMR – Equity and Debt Markets Relations 154) Automated Driving
Electrification and ADAS Require New Braking Solutions: MKC1
For Recuperation in Electric Vehicles For Highly Automated Driving
2 4
1
3
› The MK C1 supports regenerative braking in a wider › The MK C1 for highly automated driving has a
range than standard regenerative brake systems redundant fallback-level by combining it with a MK 100
based Hydraulic Brake Extension.
Traditional braking system MK C1
› The MK C1 HAD system architecture with two
networked braking system units offers a stepped
degradation concept to ensure the required
deceleration level at all times without driver interaction.
At lower weight than a traditional braking system (from ̴ 9-10kg to ̴ 6kg)
Capital Markets Day at CES - January 9, 2018
EDMR – Equity and Debt Markets Relations 165) Holistic Connectivity
Rise of Connected Vehicles
Estimated vehicle population (mn units) ~1,500
~1,400
>1,000
~40%
~20%
~10%
Capital Markets Day at CES - January 9, 2018
EDMR – Equity and Debt Markets Relations 175) Holistic Connectivity
Software Drives Architecture, Process and Organization
Yesterday Today Tomorrow
more more
than 170 Sensors than 200 Sensors
Only
up to
90 ECUs
Increasing Computing Power5) Holistic Connectivity
Central Processing Unit in a Server Based Architecture
› Automotive and cross industry trends require new approaches in EEA*
Automated driving
› Move towards structures known from IT industry
Electrification › The In-Vehicle server is a cornerstone of modern vehicle architectures
Connectivity
New Mobility
› The In-vehicle Server offers a HW/SW platform realizing individual use cases:
SW defined car
High performance Redistribution of In-vehicle Master for Cyber Security,
computing unit. application SW. communication. SW over-the-air updates
010011000 Predefined appli- Separation of I/O* Increasing and vehicle diagnosis.
Digitalization 101010011
cations as well as logic from appli- demand of in- Elektrobit SW management
new 3rd party SW cation function + vehicle network and Argus cyber security
and service inte- application fusion bandwidth. solutions are essential
Internet of Things IoT gration. across domains. elements.
1 EEA = Electric/Electronic architecture
2 I/O = Input / Output
Capital Markets Day at CES - January 9, 2018
EDMR – Equity and Debt Markets Relations 196) Tires: No Disruption but Evolution
Four ACES Will Reduce Costs per Mile Traveled
Electrification Shared Mobility
Economies of scale
Fuel efficiency
Better safety
Automated
Connectivity Mobility
› Higher utilization of car park
› Lower cost per mile traveled
› Results in greater access to mobility
Capital Markets Day at CES - January 9, 2018
EDMR – Equity and Debt Markets Relations 206) Tires: No Disruption but Evolution
Greater Access to Mobility for a Growing World Population
Sources: Continental, World Bank, Roland Berger
Capital Markets Day at CES - January 9, 2018
EDMR – Equity and Debt Markets Relations 216) Tires: No Disruption but Evolution
Strategy 2025: Globalize Growth (mn units)1
120
∑142 ∑>200
∑120
EMEA
80
APAC
Americas
40
0
2010 2015 2025 target
2 1 3
2025 Continental growth to outperform global market
1 Continental global production capacity of PC< and CV tires
Capital Markets Day at CES - January 9, 2018
EDMR – Equity and Debt Markets Relations 227) ContiTech – Smart Solutions beyond Rubber
CT Products: Relevant Markets and Growth Opportunities
Σ~€82 bn
Σ~€60 bn
7
6 7 Air Spring Systems
5 6 Conveyor Belt Group
4
5 Power Transmission Group
3
4 Vibration Control
2 3 Industrial Fluid Systems
2 Mobile Fluid Systems
1 1 Benecke-Kaliko Group
(incl. Elastomer Coatings from 1/2018)
2017 2025
Balanced portfolio of OE Automotive and Non-OE Automotive businesses
Growth through volume and (added) value1 expansion of products
1 Additional sales driven by servitization and software
Capital Markets Day at CES - January 9, 2018
EDMR – Equity and Debt Markets Relations 237) ContiTech – Smart Solutions beyond Rubber
Unveiling the Power of Digitalization
Automation and Functional integration Lifecycle integration
horizontal integration
Highly automated operations Added value through Servitization and
functional integration Smart Conveyer Belts
of electronics and software1
Value Advanced use of process data helps to improve asset efficiency,
Creation logistics and maintenance by facilitating operational excellence.
1 Example for combination of our air springs with the sensor technology, software, control devices for height adjustment and Continental compressors
Capital Markets Day at CES - January 9, 2018
EDMR – Equity and Debt Markets Relations 248) Continental Strategy – Outlook 2020 and Beyond
Four ACES1 Will Advance Our Growth Opportunities
Global
PC & LT2 2005-2010: 2010-2015: 2015-2020E:
Production CAGR 3% CAGR 4% CAGR 1-2%
1
ACES: autonomous, connected, electrified and shared mobility
2
Passenger car and light truck production Capital Markets Day at CES - January 9, 2018
EDMR – Equity and Debt Markets Relations 25Thank you!
Capital Markets Day at CES - January 9, 2018
EDMR – Equity and Debt Markets Relations 26Disclaimer
› This presentation has been prepared by Continental Aktiengesellschaft solely in connection with the release of the
preliminary figures for fiscal 2017 on January 9, 2018, in Las Vegas and the subsequent conferences in New York,
Detroit and Frankfurt in January 2018. It has not been independently verified. It does not constitute an offer, invitation
or recommendation to purchase or subscribe for any shares or other securities issued by Continental AG or any
subsidiary and neither shall any part of it form the basis of, or be relied upon in connection with, any contract or
commitment concerning the purchase or sale of such shares or other securities whatsoever.
› Neither Continental Aktiengesellschaft nor any of its affiliates, advisors or representatives shall have any liability
whatsoever (in negligence or otherwise) for any loss that may arise from any use of this presentation or its contents
or otherwise arising in connection with this presentation.
› This presentation includes assumptions, estimates, forecasts and other forward-looking statements, including
statements about our beliefs and expectations regarding future developments as well as their effect on the results of
Continental. These statements are based on plans, estimates and projections as they are currently available to the
management of Continental. Therefore, these statements speak only as of the date they are made, and we
undertake no obligation to update publicly any of them in light of new information or future events. Furthermore,
although the management is of the opinion that these statements, and their underlying beliefs and expectations, are
realistic as of the date they are made, no guarantee can be given that the expected developments and effects will
actually occur. Many factors may cause the actual development to be materially different from the expectations
expressed here. Such factors include, for example and without limitation, changes in general economic and business
conditions, fluctuations in currency exchange rates or interest rates, the introduction of competing products, the lack
of acceptance for new products or services and changes in business strategy.
› All statements with regard to markets or market position(s) of Continental or any of its competitors are estimates of
Continental based on data available to Continental. Such data are neither comprehensive nor independently verified.
Consequently, the data used are not adequate for and the statements based on such data are not meant to be an
accurate or proper definition of regional and/or product markets or market shares of Continental and any of the
participants in any market.
› Unless otherwise stated, all amounts are shown in millions of euro. Please note that differences may arise as a result
of the use of rounded amounts and percentages.
Capital Markets Day at CES - January 9, 2018
EDMR – Equity and Debt Markets Relations 27Preliminary Figures for Fiscal 2017 and Outlook 2018 January 2018 Ticker: CON ADR-Ticker: CTTAY Twitter: @Continental_IR http://www.continental-ir.com W. Schaefer – CFO
AGENDA

1 Corporation Highlights 2017                                                            3
2 Opportunities and Challenges in 2018                                                  8
                                                                                       14
3 Opportunities and Challenges in the Medium Term                                      14
4 Outlook                                                                              19

                                               Capital Markets Day at CES - January 9, 2018
                                               EDMR – Equity and Debt Markets Relations       29
1) Corporation Highlights 2017
Most Important KPIs
FY 2017
› Sales up by >8% to ~€44.0 bn; organic sales growth at ~8%
› Adj. EBIT1 totaled >€4.7 bn; adj. EBIT1 margin ~10.8%
› Free cash flow before acquisitions amounted to >€2.2 bn,
leading to a cash conversion2 of1) Corporation Highlights 2017
Sales and Adjusted EBIT1 by Quarter
FY Sales ~€44.0 bn
FY Sales €39,232 mn FY Sales €40,549 mn
FY adj. EBIT1 >€4.7 bn
~11,250
11,000 11,033
10,524 10,693
10,030 10,016 9,851 10,191 9,984
9,569 9,618
1,292 1,284 1,166 1,163 ~1,300
1,090
1,090
644
Q1/15 Q2/15 Q3/15 Q4/15 Q1/16 Q2/16 Q3/16 Q4/16 Q1/17 Q2/17 Q3/17 Q4/17E
Sales (mn €) Adj. EBIT 1 (mn €)
1
Before amortization of intangibles from PPA, consolidation and special effects
Capital Markets Day at CES - January 9, 2018
EDMR – Equity and Debt Markets Relations 311) Corporation Highlights 2017
Automotive Group and Rubber Group by Quarter
Automotive Group Rubber Group
1 1
1
Before amortization of intangibles from PPA, consolidation and special effects
Capital Markets Day at CES - January 9, 2018
EDMR – Equity and Debt Markets Relations 321) Corporation Highlights 2017
Organic Growth Accelerated Throughout the Year
Organic Sales Growth vs. Organic Sales Growth
PC & LT1 Production Growth by Division
Q4/17E
Q4/17E
Q4/17E
Q2/17
Q2/17
Q1/17
Q1/17
Q2/17
Q1/17
Q3/17
Q3/17
Q3/17
Chassis Powertrain Interior
1 Passenger car and light truck
2 Microcontrollers
& Safety
Capital Markets Day at CES - January 9, 2018
EDMR – Equity and Debt Markets Relations 331) Corporation Highlights 2017
Highlights from the CES 2018
Ac2ated Sound – Speakerless Audio System Platform for Accelerating Development
The innovative technology replaces of Automated Driving Control Units
conventional loudspeakers with a
system based on actuators to create Adaptable platform provides flexibility and
sound by exciting certain surfaces in the adaptability to changing market requirements
vehicle, just like the functional principle of for automated driving such as machine
string instruments. It exceeds consumer learning techniques, sensor technology,
and customer expectations with its and configuration.
excellent acoustics and reduced The platform will be demonstrated at CES.
system weight and spatial volume.
Continental and Avis Budget Group
Continental Air Supply (CAirRs) Partnership Drives Mobility Forward
Continental’s CAirS is a highly integrated air
Continental’s aftermarket Key-as-a-Service
supply module that simplifies vehicle
offering will provide seamless access and
installation and conserves energy. Its small
start for Avis customers. Avis debuts new
size reduces weight by as much as 25 percent of conventional
telematics solution that makes rental
components and decreases vehicle energy consumption,
experience entirely keyless.
which supports sustainable and ecological mobility.
The solution will be demonstrated at CES.
High-Quality 3D Display Surface Offers Fifth Radar Generation Meets Future
new Design Possibilities in the Cockpit Requirements for Automated Driving
Continental has developed a 3D display surface When creating future applications, high
featuring optically bonded, topographical elements precision in range resolution, object
that restores a sense of quality and design detection and accuracy in measuring the
individuality to the classic display. The three speed are highly important. With the fifth
Dimensional Active Touch Surface brings depth generation of Continental’s powerful and
to the digital world, combines physical finger tried-and-tested radar sensors, we are
guides with active haptic feedback to shorten or opening up new opportunities for modern
eliminate off road glances, benefiting safety. advanced driver assistance systems.
Capital Markets Day at CES - January 9, 2018
EDMR – Equity and Debt Markets Relations 342) Opportunities and Challenges in 2018
› 2018
› European growth to more than compensate expected decline in North America
› China: expect increased volatility if no additional stimulus is provided
› Russia and Brazil to further recover from depressed levels
› ContiTech: oil and mining-related businesses to slowly recover
› Tires: raw materials will provide tailwind in H1 2018 but expect slight headwind for the
year as a whole
› Medium Term
› Tire business to benefit further from mix improvement – industry capex in line with
prior years despite rising demand
› Order intake supports Automotive Group growth
› Rising R&D expenses in Automotive, a consequence of successfully transforming the
business towards electronics and software
› High growth combined with continuous investment in R&D will limit operating leverage
in the next 12-18 month
› Regional sales and customer mix becoming more balanced
Capital Markets Day at CES - January 9, 2018
EDMR – Equity and Debt Markets Relations 352) Opportunities and Challenges in 2018
Europe Slowing and North America Likely to Decline Slightly
› Opportunities PC & LT1 Production (mn units) – Europe
› European volume growth to more
than compensate decline in the U.S.
› Tax cuts in the U.S. could stabilize
new car sales in 2018 >10
8.5 9.3
› Average car park age at all time high
in both markets
› Challenges Average age of the fleet in years
› NAFTA trade deal still not finalized PC & LT1 Production (mn units) – NA
› Brexit and German government
adjourned game weigh on European
sentiment
~12
10.0 11.0
1
Passenger car and light truck (2) Opportunities and Challenges in 2018
China – Signs of Slower Growth
› Opportunities China – GDP Growth YOY3
› Full EV1s as a business opportunity
› China presents Continental with both
market and content growth
opportunity
› Challenges
› Chinese GDP growth slowing further
› Vehicle demand in 2018 will be
largely dependent on additional China – PC & LT4 Production
stimulus
› China PC & LT4 production with
outlook on slow growth level 29%
26%
› Separating EV1 quota from ICE2 23%
regulation will push EV demand
1
Electric Vehicle
2
Internal combustion engine
3
2017E and 2018E: IMF Oct 2017 Update
4
Passenger and light truck; source: IHS and own estimates Share of World PC & LT Production
Capital Markets Day at CES - January 9, 2018
EDMR – Equity and Debt Markets Relations 372) Opportunities and Challenges in 2018
Russia and Brazil to Recover from Depressed Levels
› Opportunities Russia – GDP Growth YOY1
› New car sales in Russia (2017E
1.6 mn) and Brazil (2017E 1.9 mn)
recovered from low levels and
increased both by more than 10%
› Russia and South America represent
currently about 4% of Continental’s
global sales in 2017
› In the mid-term, both markets offer
growth potential as their share in Brazil – GDP Growth YOY1
global car production was down from
8% in 2008 to 4% in 2017
› Challenges
› Elections in Brazil and Mexico in
2018 with highly uncertain outcome
1
2017E and 2018E: IMF Oct 2017 Update
Capital Markets Day at CES - January 9, 2018
EDMR – Equity and Debt Markets Relations
382) Opportunities and Challenges in 2018
Oil and Mining-Related Sectors Impacting ContiTech
› Opportunities Oil Price and Rig Count Data
› Oil and mining-related exposure of
ContiTech stabilized at 15% of sales
after Hornschuch acquisition
› Oil-related business with chance
to recover further in 2018
› Cost structure in mining related
business aligned to benefit from any
recovery ahead
Mining Capex (mn US$)1
› Challenges
› Only moderate recovery in
mining-related businesses outside of
North America during 2018 expected
1
Source: Company filings and consensus data for BHP, Rio, Vale, Grupo Mexico,
FCX, ABX, GG, NEM, NCM, TCK/B, ANTO, NUE, AA, KGC, AEM, EGO
Capital Markets Day at CES - January 9, 2018
EDMR – Equity and Debt Markets Relations
392) Opportunities and Challenges in 2018
Expected Raw Material Price Development
› Natural rubber price (TSR 20) Raw Material Price Development1
expected to rise by 10% 2013–2018E (U.S. cents/kg)
› Synthetic rubber price (butadiene Average (Y)
TSR 20: 251
Average (Y)
TSR 20: 172
Average (Y)
TSR 20: 137
Average (Y)
TSR 20: 138
Average (Y)
TSR 20: 167
Average (Y)
TSR 20: 184
Butadiene: 148 Butadiene: 132 Butadiene: 90 Butadiene: 113 Butadiene: 151 Butadiene: 160
feedstock) forecasted to rise
by 6%
› Prices for carbon black and
chemicals are forecasted to rise
by at least 10%
› Based on these assumptions
costs of raw materials are
expected to burden the Tire
division with about €50 mn in
2018
› However, H1 2018 will be
supported by lower costs of raw
materials and roll over of price
increases from Q2 2017
1
Source: Bloomberg and Continental estimates for 2017
Capital Markets Day at CES - January 9, 2018
EDMR – Equity and Debt Markets Relations 403) Opportunities and Challenges in the Medium Term
› 2018
› European growth to more than compensate North America decline
› China: expect increased volatility if no additional stimulus is provided
› Russia and Brazil to further recover from depressed levels
› ContiTech: oil and mining-related businesses to slowly recover
› Tires: raw materials will provide tailwind in H1 2018 but expect slight headwind for the
year as a whole
› Medium Term
› Tire business to benefit further from mix improvement – industry capex in line with
prior years despite rising demand
› Order intake supports Automotive Group growth
› Rising R&D expenses in Automotive, a consequence of successfully transforming the
business towards electronics and software
› High growth combined with continuous investment in R&D will limit operating leverage
in the next 12-18 months
› Regional sales and customer mix becoming more balanced
Capital Markets Day at CES - January 9, 2018
EDMR – Equity and Debt Markets Relations 413) Opportunities and Challenges in the Medium Term
Rising Demand vs. Stagnating Tire Capex
› Opportunities World Market for PC & LT 1 Replacement Tires
› Global replacement tire market CAGR
1.4
11%
continues to grow with a CAGR of 3% CAGR
1.2
10%
3%
1.0 22%
3%
11% 24%
› Mix improvement continues driven by 22% 18%
14%
growing SUV share in Europe and 11%
24% 21%
China 25%
31% 29% 27%
› Europe to stay the largest
2012 2017 2022E
replacement tire market by volume Europe North America China Rest of Asia Rest of World
› China to keep double digit CAGR of Tire Capex2 2007 to 2018E (mn €)
~10% from 2017 to 2022E 10,000
› Challenges 8,000
6,000
› Rising costs of raw materials
expected for 2018 as a whole 4,000
2,000
0
1 2007 2008 2009 2010 2011 2012 2013 2014 2015 2016 2017E2018E
Passenger and light truck replacement tire market in bn units; source:
LMC (December 2016) and own estimates
2
Company filings and forecasts (based on public information from 16 tire companies)
Capital Markets Day at CES - January 9, 2018
EDMR – Equity and Debt Markets Relations
423) Opportunities and Challenges in the Medium Term
Strong Order Intake Safeguards Growth…
› Order intake in the Automotive Group Automotive Group:
increased from €30 bn in 2015 to more Strong Order Intake (bn €)
than €39 bn in 2017
› Order backlog totals some €85 bn with
close to 90% of 2019 sales already
booked
› Strong order intake well distributed
across the three Automotive Divisions
with all showing YOY increases
› Strong backlog will allow growth in the
Automotive Group to range at the upper
end of the guidance of 3% to 5% growth
ahead of global car production
1
1
LTS = Life time sales
Capital Markets Day at CES - January 9, 2018
EDMR – Equity and Debt Markets Relations
433) Opportunities and Challenges in the Medium Term
… but Causes Sustained High R&D and Capex
Automotive Group R&D (mn €) Automotive Group Capex (mn €)
R&D and capex have a
lead time of about 2-3
years and the increase
is mainly a
consequence of the
strong order intake
Capital Markets Day at CES - January 9, 2018
EDMR – Equity and Debt Markets Relations
443) Opportunities and Challenges in the Medium Term
Towards Regional Sales Balance
Sales by Region 2016 Sales by Region 2022E
1 1
Growing in Asia with
local OEMs: Share with
Japanese, Korean and
Chinese OEMs will
increase to 20% in the
coming years
Distribution of Global PC & LT Production 2016 Distribution of Global PC & LT Production 2022E
1
Rest of World
Capital Markets Day at CES - January 9, 2018
EDMR – Equity and Debt Markets Relations
454) Outlook 2018
PC & LT Production by Quarter 1 Q1 2018 blurred by
statistical effects
Europe (mn units) North America (mn units) China (mn units)
2016: 2017E: 2018E: 2016: 2017E: 2018E: 2016: 2017E: 2018E:
21.4 22.0 22.4 17.8 17.1 16.8 27.1 27.8 27.9
1
Source: IHS and own estimates, Europe excluding Kazakhstan and Uzbekistan
Capital Markets Day at CES - January 9, 2018
EDMR – Equity and Debt Markets Relations 464) Outlook 2018
Market Outlook for Major Regions
PC & LT1 Production (mn units) Commercial Vehicle2 Prod. (k units)
Source: IHS and ow n estimates Source: IHS and ow n estimates
PC & LT Repl.3 Tire Market (mn units) CV Repl.4 Tire Market (mn units)
Source: LMC and ow n estimates Source: LMC and ow n estimates
1
Passenger car and light truck 6t Capital Markets Day at CES - January 9, 2018
3
4
Passenger car & light truck replacement EDMR – Equity and Debt Markets Relations 47
Commercial vehicle replacement (radial and biased)4) Outlook 2018
Continental Corporation
2017E 2018E
Consolidated sales ~€44.0 bn To increase to ~€47 bn at constant FX rates;
adj. EBIT1 margin ~10.8% ~10.5%
Automotive Group ~€26.5 bn
adj. EBIT1 ~€2.2 bn March 8, 2018
Rubber Group ~€17.5 bn
adj. EBIT1 ~€2.6 bn March 8, 2018
Raw materials cost impact Burden of about ~€450 mn Raw materials to burden Rubber Group / Tires
for the Rubber Group with about €50 mn on latest assumptions
Special effects ~-€20 mn -€100 mn
Net interest result ~-€190 mn at constant FXThank you!
Capital Markets Day at CES - January 9, 2018
EDMR – Equity and Debt Markets Relations
49Disclaimer
› This presentation has been prepared by Continental Aktiengesellschaft solely in connection with the release of the
preliminary figures for fiscal 2017 on January 9, 2018, in Las Vegas and the subsequent conferences in New York,
Detroit and Frankfurt in January 2018. It has not been independently verified. It does not constitute an offer, invitation
or recommendation to purchase or subscribe for any shares or other securities issued by Continental AG or any
subsidiary and neither shall any part of it form the basis of, or be relied upon in connection with, any contract or
commitment concerning the purchase or sale of such shares or other securities whatsoever.
› Neither Continental Aktiengesellschaft nor any of its affiliates, advisors or representatives shall have any liability
whatsoever (in negligence or otherwise) for any loss that may arise from any use of this presentation or its contents
or otherwise arising in connection with this presentation.
› This presentation includes assumptions, estimates, forecasts and other forward-looking statements, including
statements about our beliefs and expectations regarding future developments as well as their effect on the results of
Continental. These statements are based on plans, estimates and projections as they are currently available to the
management of Continental. Therefore, these statements speak only as of the date they are made, and we
undertake no obligation to update publicly any of them in light of new information or future events. Furthermore,
although the management is of the opinion that these statements, and their underlying beliefs and expectations, are
realistic as of the date they are made, no guarantee can be given that the expected developments and effects will
actually occur. Many factors may cause the actual development to be materially different from the expectations
expressed here. Such factors include, for example and without limitation, changes in general economic and business
conditions, fluctuations in currency exchange rates or interest rates, the introduction of competing products, the lack
of acceptance for new products or services and changes in business strategy.
› All statements with regard to markets or market position(s) of Continental or any of its competitors are estimates of
Continental based on data available to Continental. Such data are neither comprehensive nor independently verified.
Consequently, the data used are not adequate for and the statements based on such data are not meant to be, an
accurate or proper definition of regional and/or product markets or market shares of Continental and any of the
participants in any market.
› Unless otherwise stated, all amounts are shown in millions of euro. Please note that differences may arise as a result
of the use of rounded amounts and percentages.
Capital Markets Day at CES - January 9, 2018
EDMR – Equity and Debt Markets Relations 50Contact
Equity and Debt Markets Relations
Vahrenwalder Str. 9 Michael Saemann
30165 Hanover Analysts, Institutional Investors and Sustainability Investors
Germany Phone: +49 511 938 1307
E-mail: ir@conti.de E-mail: michael.saemann@conti.de
Fax: +49 511 938 1080
www.continental-ir.com Klaus Paesler
Analysts, Institutional Investors, ADR and Private Investors
Rolf Woller Phone: +49 511 938 1316
Head of IR E-mail: klaus.paesler@conti.de
Phone: +49 511 938 1068
E-mail: rolf.woller@conti.de Christopher Macke
Analysts, Institutional Investors
Jana Cross Phone: +49 511 938 1062
Assistant to the Head of IR E-mail: christopher.macke@conti.de
Roadshow and Conference Organization
Phone: +49 511 938 1163 Sabine Reese
E-mail: jana.cross@conti.de Sustainability, ASM, CMD Organization, IR Website,
Capital Market Disclosure Requirements
Phone: +49 511 938 1027
E-mail: sabine.reese@conti.de
Marvin Kalberlah
Social Media
Phone: +49 511 938 14034
E-mail: marvin.kalberlah@conti.de
Capital Markets Day at CES - January 9, 2018
EDMR – Equity and Debt Markets Relations 51Continental
Financial Calendar
2017
Preliminary figures for fiscal 2016 January 9, 2017
Annual Financial Press Conference March 2, 2017
Annual Shareholders’ Meeting (incl. key data for Q1 2017) April 28, 2017
Q1 Financial Report May 9, 2017
Half-Year Financial Report August 3, 2017
Nine-Month Financial Report November 9, 2017
2018
Preliminary figures for fiscal 2017 January 9, 2018
Annual Financial Press Conference March 8, 2018
Annual Shareholders’ Meeting (incl. key data for Q1 2018) April 27, 2018
Q1 Financial Report May 8, 2018
Half-Year Financial Report August 2, 2018
Nine-Month Financial Report November 8, 2018
Capital Markets Day at CES - January 9, 2018
EDMR – Equity and Debt Markets Relations 52Continental
Share Data / ADR Data
Share Data
Type of share No-par value share
Bloomberg Ticker CON
Reuters Ticker CONG
German Security Identification Number (WKN) 543 900
ISIN Number DE0005439004
Shares outstanding as at December 31, 2017 200,005,983
ADR Data
Ratio (ordinary share: ADR) 1:5
Bloomberg Ticker CTTAY
Reuters Ticker CTTAY.PK
ISIN Number US2107712000
ADR Level Level 1
Exchange OTC
Sponsor Deutsche Bank Trust Company Americas
Capital Markets Day at CES - January 9, 2018
EDMR – Equity and Debt Markets Relations 53Continental
Bond Data
Continental Rubber of
Issuer Continental AG Continental AG Continental AG
America, Corp.1
Issue Senior Notes Senior Notes Senior Notes Senior Notes
Principal amount €750 mn €500 mn €600 mn €750 mn
Offering price 98.950% 99.739% 99.410% 99.228%
Ba2 (Moody’s 4) Ba1 (Moody’s 4)
Rating at issuance
BB (S&P) BBB (S&P) BBB+ (S&P) BB (S&P)
date
BB (Fitch2) BBB (Fitch) BBB+ (Fitch) BBB (Fitch2)
Current
corporation and BBB+ (Fitch), BBB+ (S&P), Baa1 (Moody’s4)
bond ratings3
Coupon 3.0% p.a. 0.5% p.a. 0.0% p.a 3.125% p.a.
Issue date July 16, 2013 November 19, 2015 December 5, 2016 September 9, 2013
Maturity July 16, 2018 February 19, 2019 February 5, 2020 September 9, 2020
Annual
Semi annual February 19, Annual
Interest payment Not applicable
January 16/July 16 commencing September 9
on February 20, 2017
WKN A1X24V A1Z7C3 A2DARM A1X3B7
ISIN XS0953199634 DE000A1Z7C39 XS1529561182 XS0969344083
€1,000 with min. €1,000 with min. €1,000 with min. €1,000 with min.
Denomination
tradable amount €1,000 tradable amount €1,000 tradable amount €1,000 tradable amount €1,000
1
Guaranteed by Continental AG
2
Non-contracted rating at date of issuance
3
Fitch since October 24, 2016; S&P since May 11, 2016; Moodyʼs since June 30, 2015
4
Non-contracted rating since February 1, 2014
Capital Markets Day at CES - January 9, 2018
EDMR – Equity and Debt Markets Relations 54Continental
Continental’s Credit Rating
Standard & Poor’s1 Moody’s2 Fitch3
S&P, Fitch / Moody’s
BBB+ / Baa1
Investment
Grade
BBB / Baa2
BBB- / Baa3
BB+ / Ba1
Non-Investment
BB / Ba2
Grade
Before
BB- / Ba3 Siemens
VDO
B+ / B1
B / B2
1 Contracted rating since May 19, 2000
2 Non-contracted rating since February 1, 2014 Capital Markets Day at CES - January 9, 2018
3 Contracted rating since November 7, 2013
EDMR – Equity and Debt Markets Relations 55References
Useful Links
Continental Investor Relations website www.continental-ir.com
Annual and interim reports www.continental-corporation.com/en/investors/reports
2016 Fact Book www.continental-corporation.com/en/investors/reports
Investor Relations www.continental-corporation.com/en/investors/events/presentations
events and presentations
Sustainability at Continental www.continental-corporation.com/en/investors/about-us/presentation-
(presentation and fact sheet for sustainability-at-continental-23118
investors)
Corporate Social Responsibility www.continental-sustainability.com
Corporate Governance Principles www.continental-corporation.com/en/company/corporate-governance/principles-
and-declarations
Continental shares www.continental-corporation.com/en/investors/share
Continental bonds and rating www.continental-corporation.com/en/investors/debt-and-rating
Continental IR App for the iPad itunes.apple.com/app/continental-investor-relations/id922896658?mt=8
Continental IR on Twitter twitter.com/Continental_IR
Capital Markets Day at CES - January 9, 2018
EDMR – Equity and Debt Markets Relations 56You can also read