CFD Analysis of PACE Formula-1 Car
←
→
Page content transcription
If your browser does not render page correctly, please read the page content below
1

                           CFD Analysis of PACE Formula-1 Car

                   Satyan Chandra1, Allison Lee2, Steven Gorrell3 and C. Greg Jensen4
                       1
                        Brigham Young University, satyanchandra@hotmail.com
                          2
                           Brigham Young University, allisonlee8@gmail.com
                             3
                              Brigham Young University, sgorrell@byu.edu
                             4
                               Brigham Young University, cjensen@byu.edu

                                              ABSTRACT

        An analytical study on air flow effects and resulting dynamics on the PACE Formula
        1 race car is presented. The study incorporates Computational Fluid Dynamic
        analysis and simulation to maximize down force and minimize drag during high
        speed maneuvers of the race car. Using Star CCM+ software and mentoring provided
        by CD – Adapco, the simulation employs efficient meshing techniques and realistic
        loading conditions to understand down force on front and rear wing portions of the
        car as well as drag created by all exterior surfaces. Wing and external surface loading
        under high velocity runs of the car are illustrated. Optimization of wing orientations
        (direct angle of attack) and geometry modifications on outer surfaces of the car are
        performed to enhance down force and lessen drag for maximum stability and
        control during operation. The use of Surface Wrapper saved months of time in
        preparing the CAD model. The Transform tool and Contact Prevention tool in Star
        CCM+ proved to be an efficient means of correcting and modifying geometry instead
        of going back to the CAD model. The CFD simulations point out that the current
        front and rear wings do not generate the desired downforce and that the rear wing
        should be redesigned.

        Keywords: formula 1, CFD, aerodynamic analysis, downforce, FEA, angle of attack.
        DOI: 10.3722/cadaps.2011.PACE.1-14

1   INTRODUCTION
Computational fluid dynamics (CFD) is extensively used in the racing industry to predict the downforce
and drag racecars would experience at high velocities [1]. CFD provides numerical solutions to the
governing equations of fluid dynamics throughout the desired flow region. It allows for complex
problems to be solved without losing the integrity of the problem due to over-simplification. It is this
ability to solve large problems that makes CFD an excellent tool for the automotive industry. CFD
allows engineers to examine the airflow over an automobile or a particular part such as a wing or hood,
and see the aerodynamic effect of changing the geometry of any particular area of the vehicle. Not only
does the automotive industry use CFD to study the airflow external to the car, but now also employs

                                           Computer-Aided Design & Applications, PACE (1), 2011, 1-14
                                                © 2011 CAD Solutions, LLC, http://www.cadanda.com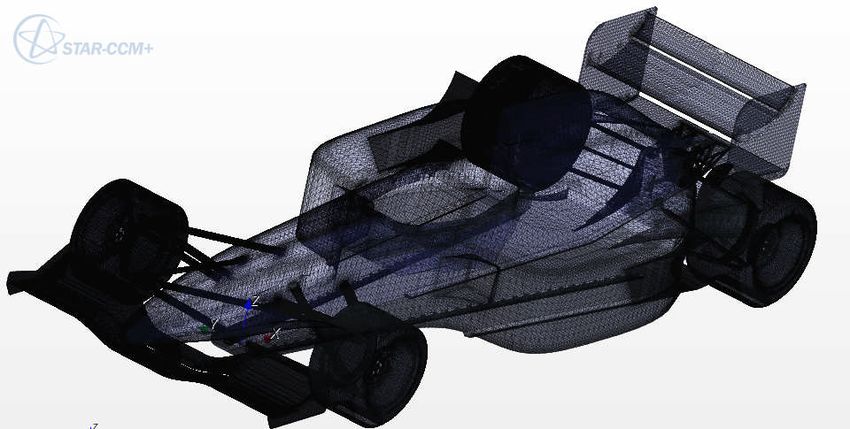
2

CFD in mapping airflow through the engine, and even within the car to predict the behavior of thermal
comfort systems and the efficiency of cooling systems.

Brigham Young University (BYU) along with 26 other universities has worked together for the past 5
years to design and build the PACE Formula 1 car (see Figure 1). The product development efforts
have spanned several continents and many cultures, involving industry leaders and students from a
wide variety of backgrounds, from industrial design to manufacturing to crash analysis. The car is
ready to be tested for high speed performance at the Miller Motorsports Park in Utah. Before this test
takes place, however, the aerodynamic capabilities of the race car had to be determined. In November
2010 it was decided by faculty and students of the PACE program that full scale CFD simulations of the
car would be performed to help predict if there is enough downforce to safely drive the car at high
speeds of up to 220 mph. This paper presents the process required to generate CFD simulations of the
PACE Formula 1 car from the CAD models used to design and build the car. Simulations run using CD-
Adapco’s Star CCM+ software (v6.02.007) were used to predict the downforce and drag of the car at
different speeds. These studies provided information needed to set the angle of attack on the front
and rear wings of the car to increase the downforce at high speeds while minimizing the drag.

                       Fig.1: Selected design for the 2009 PACE Formula 1 race car.

Many challenges were faced and overcome in order to generate a mesh from the CAD models. By
understanding the process needed to produce a simulation, a set of recommendations are derived with
regards to generating CAD models, simplifying the geometry, and generating meshes and CFD models.
The lessons learned in this project help define research that should be accomplished in order to
reduce the time and complexity often required to generate a CFD mesh from a CAD model.

The paper will proceed by presenting the original CAD model of the PACE Formula 1 car followed by a
description of the challenges identified and steps taken to generate a good quality CFD mesh. The CFD
simulations run using Star CCM+ on the BYU supercomputer are described, followed by the results and
analysis of the downforce and drag predicted on the car at typical Formula 1 speeds. The paper
concludes with recommended practices for creating CAD models that will be used to create meshes for
CFD simulations and with recommendations on the angle of attack for the Formula 1 car.

2   COLLABORATION TOOLS
Simulations were run at BYU with consultation and mentoring provided by Lorenzo Crosatti, an
application engineer at CD-Adapco. Collaborative tools such as Webex and Skype were employed for
long distance communication. Webex provides computer-sharing capabilities, along with online
conference calls and video chat which allowed Lorenzo Crosatti to provide us with valuable feedback
and recommendations on the mesh quality and modeling of the race car. Meetings were held weekly
initially on but then were conducted on an on-demand basis.

                                          Computer-Aided Design & Applications, PACE (1), 2011, 1-14
                                               © 2011 CAD Solutions, LLC, http://www.cadanda.com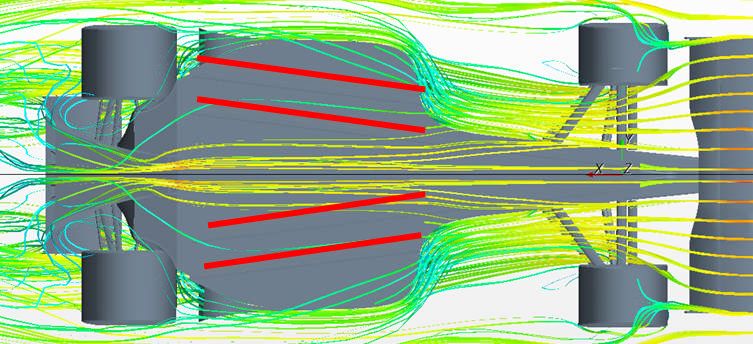
3

3   CORRECTING THE CAD MODEL
The Formula 1 car was built using Siemens NX 5.0 software and was worked on collaboratively at 26
universities from several different countries. As the 2009 PACE car was a third generation product,
several components had been re-utilized from the previous two generations. However many design and
functionality alterations were made for the newest member of the PACE Formula 1 family. While many
changes were updated in the CAD model, several had been left in their pre-existing state and several
were missing (see Figure 2). Hence the first month of this project was dedicated to rectifying the CAD
model. The corrections were necessary for an accurate and updated representation of the aerodynamic
geometry of the race car.

             Fig.2: Original CAD model of 2009 PACE F1 car as the starting point of the project.

Updating the CAD model was accomplished in three steps: assembling missing components,
redesigning lost parts or parts that were missing, and resizing components with accurate dimensions
and features that had not been updated since the previous generation of the car. The correction efforts
included assembling many of the external parts of the car, including the Scallop or Side Flaps and
Engine Cover (see Figure 3), which previously did not exist and were left unmodified on the car
assembly, respectively. It was also determined that both the back and front wheels were the incorrect
sizes and needed to be changed along with the wheelbase. The underbody diffuser was another part
that had several design flaws and was largely outdated. Complications grew upon realizing that
different universities had used different systems of units and modeling techniques: many components
were not NX part files but were rather STP or IGES files that were not easily modifiable. Some
universities used surface modeling to create their parts, while others used solid modeling. Still others
brought in each part from different CAD systems and thus editing these parts was arduous.

Fig. 3: Illustration of defects in the CAD model at the start of the project. From left to right: (a)
Incorrect Engine Cover missing Scallops/ Side Flaps (also shown are the missing rear connecting rods
and suspension arms) (b) Incorrect Diffuser missing air channels and collector channel at rear (c) Old
wheel without wheel rim and the newly modified wheel with wheel rim and spokes.

It became necessary to first understand how the part was modeled before any changes could be made.
In the end, the CAD model consisted of about 800 parts and more accurately portrayed the now-

                                           Computer-Aided Design & Applications, PACE (1), 2011, 1-14
                                                © 2011 CAD Solutions, LLC, http://www.cadanda.com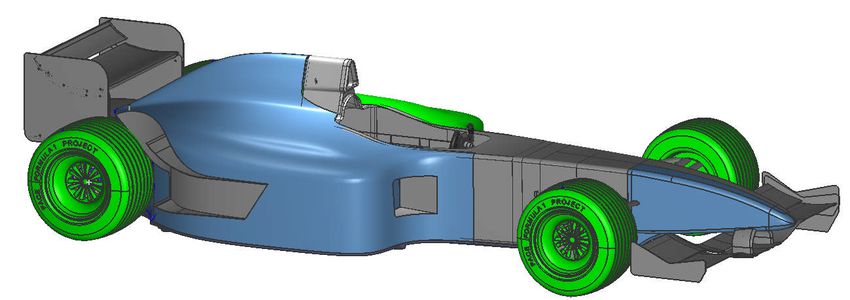
4

constructed racecar. However, not every part of the car was needed in order to run CFD simulations.
The internal geometry, such as the engine and transaxle, were not included as our focus was external
flow. As such, the internal parts were removed from the CAD model (see Figure 4). This was also
helpful for transitioning the CAD model into Star CCM+ since it decreased the complexity and size of
the model.

After the CAD model had been modified to more accurately represent the physical race car, attention
shifted to the requirements for aerodynamic analysis. There are primarily three main requirements for
performing CFD analysis on a vehicle: (1) A sealed volume must be present. (2) No internal geometry or
components are needed for external flow analysis (see Figure 4). (3) No overlapping or intersecting
surfaces should be present.

  Fig. 4: Corrections made to the NX model of the car. From left to right: (a) Internal geometry and parts
  that were irrelevant for CFD analysis were deleted (b) Corrected Diffuser with air channels and a rear
  collector channel.

The car met only one of these requirements i.e. internal geometry and parts had been removed. The
geometry was not sealed and many overlapping surfaces existed. As a result, phase two began with
modifications that would make the car aerodynamically compatible. Under the mentoring of Lorenzo
Crossati at CD – Adapco Inc., the car was sealed in order to employ the Surface Wrapper tool within
Star CCM+. This tool and its importance are discussed in the section 5 of this paper. Sealing the car
included covering the open area at the back of the car with a shell that matched the exterior geometry
of the car (see Figure 5) and covering the air intake at the top of the cockpit. In addition, the cockpit
was sealed at a location within the seat that would be at the drivers lap in an effort to mimic an
occupied cockpit. Thus air could enter the cockpit, but would not be able to flow through the interior
of the car.

Fig. 5: Sealing of the car for CFD analysis. From left to right: (a) Rear portion of car open and unsealed
(b) Sealed rear with an accurate Engine Cover.

                                            Computer-Aided Design & Applications, PACE (1), 2011, 1-14
                                                 © 2011 CAD Solutions, LLC, http://www.cadanda.com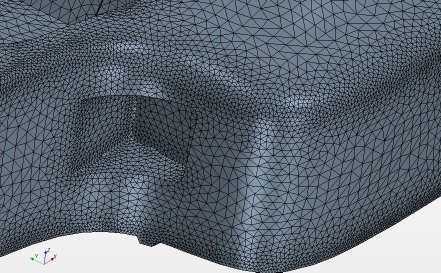
5

The requirement of no overlapping surfaces was only partially met within the CAD system. Several
duplicate parts and overlaps were corrected but two overlapping surfaces still remained: (1) Wheel with
Scallop overlap and (2) Engine Cover intersection with monocoque. As these would take several days to
fix in a CAD system (resolving these issues meant re-doing the parts), they were subsequently resolved
using the Surface Wrapper tool in Star CCM+. The model was then exported out of NX 6.0 (see Figure 6)

    Fig. 6: Corrected CAD model of the car with: (1) Correct Engine Cover (2) Proper wheel design with
    spokes and a rim (3) Sealed geometry (4) Deleted internal parts (5) Correct rear wing.

4      COMPUTATIONAL DOMAIN
Subsequent to geometrical and design modifications, the car was imported into Star CCM+ as an IGES
file. The importing process automatically generated regions or surfaces on the car. Star CCM+ had
allotted names to its own regions or parts. However for the purposes of this analysis, the different
components were combined to represent specific parts of interest. Different regions of the car were
defined to allow for custom meshes on different areas of the car. These regions included the Car Body,
Front Wing, Rear Wing, Wheels, Suspension Arms, and Scallop (see Figure 7). The car was placed in a
rectangular block that sectioned the car in half, creating a plane of symmetry. The block simulated a
wind tunnel and allowed for the outer surface of the car to be studied. Because the car was
symmetrical, it was only necessary to study the forces on half the car. The inlet of the wind tunnel was
placed one car-length in front of the nose of the car and the outlet was eight car-lengths behind the car
to capture wakes downstream of the car.

    Fig. 7: Different regions of the car: Blue-Green – Front Wing; Yellow – Wheels; Blue – Car; Purple – Rear
    Wing; Gray – Scallops; Bright Green – Suspension Arms.

                                              Computer-Aided Design & Applications, PACE (1), 2011, 1-14
                                                   © 2011 CAD Solutions, LLC, http://www.cadanda.com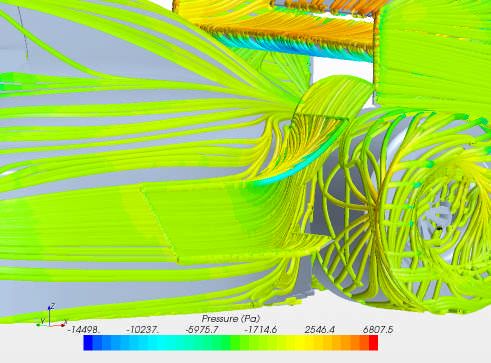
6
Setting up the computational domain was a necessary and vital step in the process of generating an
accurate CFD mesh. Without the regions in place and the wind tunnel defined, it is impossible to refine
the surface and volume meshes in particular regions without greatly increasing computational time.
5 GENERATING SURFACE AND VOLUME MESHES
Meshing was completed in three steps: capsuling the car using the Star CCM+ Surface Wrapper tool;
creating a surface mesh; and creating a volume mesh that included boundary layers.
The Surface Wrapper tool was used to create an Air Solid (sealed volume). Many CFD programs
encounter problems in the initial surface mesh stage because the original CAD model was not made
perfectly. For example, overlapping edges, non-manifold surfaces, holes, and gaps, regardless of how
small, prevent the surface mesh from being created, hence bringing the analysis effort to a standstill.
The Surface Wrapper tool eliminates the laborious problem of searching for every small model error by
“wrapping” the model with one continuous surface. Any gaps in the model geometry, as long as they
were smaller than the given base size of the Surface Wrapper (which is specified by the user), were
covered and sealed. Overlapping edges or surfaces, like the two present in the updated model of the
car, were not an issue as well because the Surface Wrapper lies above the entire model. Surface
Wrapper provided an efficient method for converting the CAD model into a usable CFD model. Part of
the Surface Wrapper is a Leak Detector tool that indicates gaps within the model that are larger than
the base size of the surface wrapper; gaps the wrapper would be unable to seal. Using the leak detector
provided an easy method to find any hidden gaps that were not easily seen in NX 6.0. These gaps were
covered, or patched, within Star CCM+. Once the large gaps were patched, the Surface Wrapper covered
the external surface of the car and produced an airtight model that was ready to be meshed (see Figure
8). The use of Surface Wrapper saved months of time in preparing the CAD model. Other teams
working on separate CFD programs spent months fine-tuning the CAD model within a CFD program
because of errors that NX 6.0 did not recognize. Surface Wrapper enabled an almost immediate
transition from the CAD model to the CFD model. As a result, the focus now shifted on creating a
refined mesh.
Fig. 8: Fully sealed and air tight car using the Surface Wrapper tool in Star CCM+.
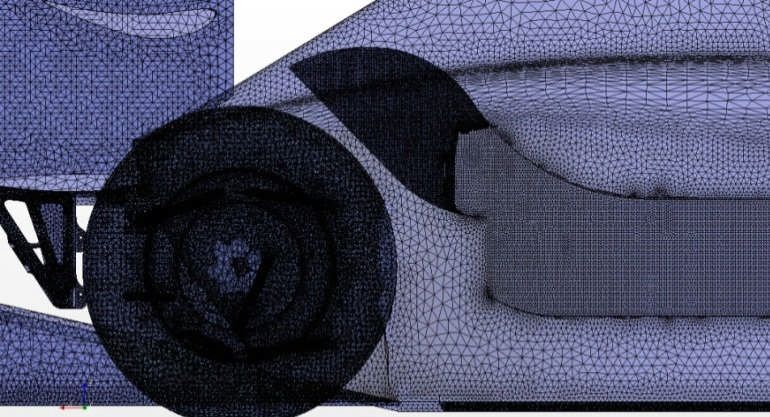
The surface of the car was meshed with triangular elements. Each vertex of the triangle connects with
another triangle and is the grid point where results are computed. The size of the mesh was defined by
a base mesh size and a target mesh size. The base mesh size is the largest that a triangle can be, while
the target is the smallest. Thus small areas of the car, such as the nose or wing tip, will have a smaller
mesh size, while larger, flatter areas like the engine cover will have larger triangles. This approach
concentrates computational time on surface regions which are more complex having higher mesh
density (see Figure 9).
The next step in meshing is creating a volume mesh that references the surface mesh previously made.
The volume mesh was built with polyhedral cells instead of typical tetrahedral cells. Star CCM+
suggests using polyhedral meshes to provide a balanced solution for complex mesh generation
Computer-Aided Design & Applications, PACE (1), 2011, 1-14
© 2011 CAD Solutions, LLC, http://www.cadanda.com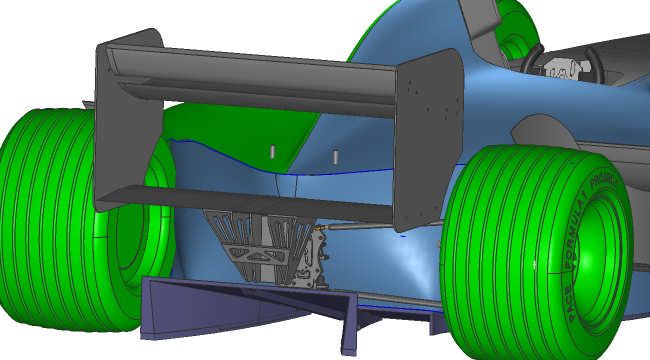
7

problems. Polyhedral meshes are setup with a surface mesh in the same manner as tetrahedral meshes,
but use 5 times fewer cells once the volume mesh is generated [2], thus decreasing the needed
processer power to generate meshes and run simulations.

   Fig. 9: Surface mesh of the car. Visible are the difference is mesh sizes; the mesh size is much
   finer in places that are curved or in complex geometry locations and larger and less detailed in
   locations that do not need high refinement such as flatter surfaces.

The volume mesh also included prism boundary layers. These layers are necessary to accurately
capture the flow field at the surface boundaries of the car [3]. There were 6 layers that were each
15mm in size. Combined with the polyhedral mesh, the prism layers created a well-refined volume
mesh that was used to generate an accurate CFD simulation to calculate the forces on the car.

During meshing of the car it was noticed that the mesh was creating intersections between the back
wheel of the car and Scallop, as the two parts were intersecting as previously mentioned. The
separation of the two parts could have been accomplished within CAD but with the complexities of the
model, doing so would not only add significant time but was also rather difficult to achieve. The
solution hence comprised of two steps. First, the Transform tools within Star CCM+ were put to use.
These tools allow for regions to be rotated, expanded, shrunk, and moved, all relative to a specific
frame of reference that could either be defined or be set to the default global reference. Using Scale
and Translate the wheels were separated from the Scallop and the correct wheel base of the car was
set. The wheels were made to touch the ground (in slip to simulate rolling of wheels) and adjusted to
the correct separation distance between the wheels and the Scallop. Despite the separation, the mesh
combined the two bodies. To avoid these intersections then, the Contact Prevention tool in Star CCM+
that forces regions to stay separate from one another was employed. This tool was a leading factor for
dividing the car into different regions as contacts were seen not only in the wheel and scallop, but also
in the wheel and body of the car and between the tire and the ground. Contact Prevention was used to
eliminate this incorrect meshed surface. By defining the separation distance between two parts, such
as the wheel and the Scallop, the problem of mesh intersections was resolved and the two parts had
their individually defined mesh with regards to a base size and a target size (see Figure 10)

   Fig. 10: Wheel and Scallop intersection. From left to right: (a) Intersection of wheel and Scallop in
   NX 6.0 at approximately a 1.15 inch overlap (b) Overlap situation fixed by using Transform and
   Contact Prevention tools to separate the mesh of wheel and Scallop parts.

                                            Computer-Aided Design & Applications, PACE (1), 2011, 1-14
                                                 © 2011 CAD Solutions, LLC, http://www.cadanda.com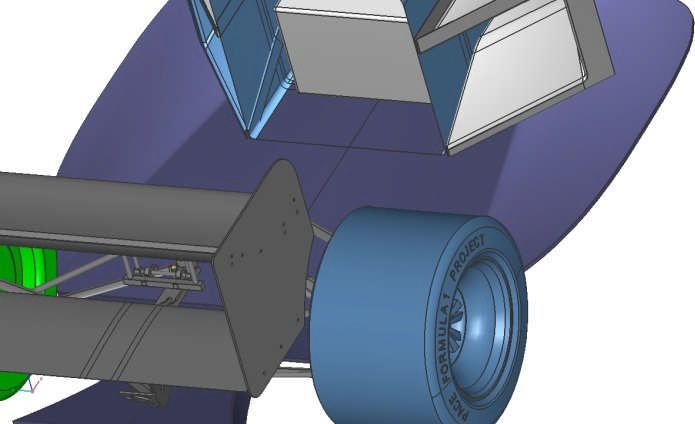
8

The surface mesh produced 3.9 million cells which reduced to 3.1 million cells as a volume mesh.
Volume meshing reduced the count of cells by performing optimization runs to decrease element
discontinuities.

Once the surface and volume meshes were in place, the model was ready for boundary conditions and
simulations.

6   SIMULATIONS
This section describes the CFD simulations. An explanation of the residuals, which were tracked in
order to verify that the solution had converged, is included. Also, a description of the simulation
characteristics is provided.

Star CCM+ was used to solve the Reynolds-Averaged Navier-Stokes equations. Generally, a solution is
assumed converged when the residuals become constant and do not change with additional iterations.
The residuals should decrease by multiple orders of magnitude before leveling off and typically settle
at 0.001 or 0.0001 residual units. We achieved residuals between 0.001 and 0.0008 that were sufficient
and very low for our analysis. In order to analyze the downforce and drag on the Formula 1 car at
various speeds and angles of attack, each simulation was set up to monitor the lift and drag on the
whole car and then also individual parts of the car. The output from the simulations is discussed in the
Results section of this paper.

Setting up the simulations included defining the model parameters. The following physical models
were chosen to simulate the airflow around the actual car: steady flow, constant density, segregated
flow, and turbulent flow using a realizable k-epsilon turbulence model. These models were chosen as a
balance between accuracy and speed. Lorenzo Crosatti also indicated that constant density flow would
be better than ideal flow. Choosing segregated flow allowed Star CCM+ to solve the necessary flow
equations in an uncoupled manner [4]. This model would not work for high Mach numbers; however
the theoretical maximum speed of the race car went only up to 220 mph (well below Mach 1) [4]. It is
standard industry practice to use k-epsilon turbulence model and, under the direction of Lorenzo
Crosatti, the realizable k-epsilon version was chosen, as it can be a more accurate model than standard
k-epsilon turbulence [5].

The drag and lift (downforce) were calculated based on the frontal area of the car. Drag and lift
coefficients were solved with the same area. To change the forces on the car, a study was done
comparing the forces resulting from different angles of attack on the rear wing and front wing. Both
wings on the Formula 1 car can be placed at different angles, so this study provided preliminary
indications of which angle will decrease drag while maintaining downforce sufficient for high speed
driving. The wings were rotated between 3 and 7 degrees with 1 degree increments from their original
positions in order to increase the downforce felt by the wing. Angular modifications less than 3
degrees were ignored because of how little drag and lift they generated.

7   SUPERCOMPUTER
The CFD analysis was performed with the help of the BYU Fulton Supercomputing Laboratory (FSL).
With 25 separate simulations, and each simulation needing 1000 iterations and roughly 22 hours of
solving time at a regular duo-core desktop to reach convergence, it was imperative that the solving
procedure be hastened significantly. Using the Supercomputer allowed the team to rapidly analyze all
of the simulations and ultimately propose the best combination of angle of attack for the front and
rear wings of the car.

The BYU FSL contains 9592 core processors and a total operating memory of 27.1 TB [6]. While each
core has a clock speed similar to a modern PC, solving time is greatly reduced by splitting jobs
between cores. While a simulation took approximately 22 hours and 30 minutes to reach the set

                                           Computer-Aided Design & Applications, PACE (1), 2011, 1-14
                                                © 2011 CAD Solutions, LLC, http://www.cadanda.com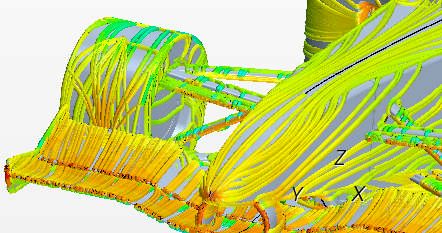
9

stopping criteria on a high performance desktop, the Supercomputer finished the task in less than 60
minutes, increasing efficiency by over 97%.

Boundary conditions changed to define each simulation were velocity and angle of attack. Each
simulation was sent to the Supercomputer through a PBS Batch Job Submission process. The
submission script specifies the software specific syntax and execution commands that are necessary
for Star CCM+ to recognize the simulation and run it. Within the submission script is a java file that
dictates to Star CCM+ the operations to perform. The java file, recorded as a macro, is generated with
Star CCM+ manually and is a set of commands that Star CCM+ follows when performing the
simulation. The submission script contains this java file and along with other syntax effectively
executes the simulation in the Supercomputer.

8    RESULTS
Simulations were run at 3 speeds (100 mph, 150 mph, and 220 mph) and 5 angles of attack (3 degrees
to 7 degrees in 1 degree increments) for both the Front Wing and the Rear Wing. The focus of this
paper is to show how to obtain a CFD simulation from a complicated CAD model and steps that can be
taken to efficiently accomplish that process. The simulation results are simply presented here as an
example of what can be learned from a CFD simulation. A grid independence study was outside the
scope of this effort. The ideology was to determine the best combination of orientation for both the
Front and Rear Wings and then use those angles of attack on the entire car. Figure 11 shows the
downforce (negative lift) and drag values for each simulation.

 Fig. 11: Front Wing and Rear Wing simulation results. It is evident that the Rear Wing is
 insensitive to changes in its angular orientation both in terms of downforce and drag while the
 Front Wing is much more sensitive to the angle of attack.

Looking first at the Rear Wing (also called Back Wing), it is apparent that both the lift and drag are not
greatly affected by the change in angle. It is important to note however, that the Drag seems to
decrease slightly with increased angle. Thus a higher angle may be preferable. This suggests the rear
wing must be moved more than 5 degrees or redesigned to be more sensitive to angle-of-attack. The
Front Wing does show a trend of increasing lift and drag with increasing angle, though there is a slight
                                           Computer-Aided Design & Applications, PACE (1), 2011, 1-14
                                                © 2011 CAD Solutions, LLC, http://www.cadanda.com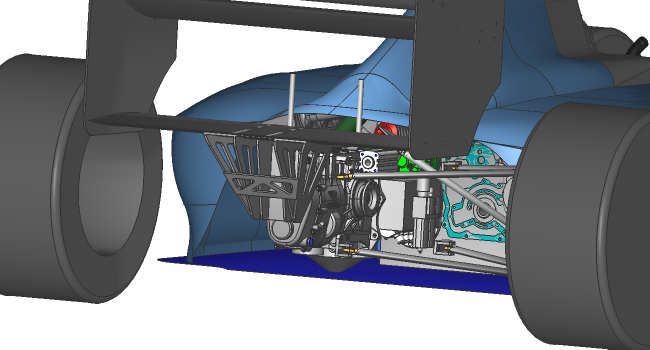
10

decrease in the lift at the final angle of 7 degrees. An S-shaped behavior exists as the increase in
downforce starts to diminish with an increase in the angle of attack. It is apparent that the Front Wing
has a greater influence than the Back Wing pertaining to the performance of the car.

Lift (absolute downforce) to drag ratios were calculated in order to select the best angular combination
of the Rear Wing and the Front Wing. Although the goal was to select the highest Lift to Drag ratio, the
absolute values of the lift and drag forces also had to be considered For example, although the Front
Wing produced the maximum lift to drag ratio at 3 degrees, the actual lift was the least of all angle-of-
attack orientations. Hence the end goal was to identify the highest lift possible and then utilize the
ratios as a method of optimization (see Table 1)

 Lift : Drag Ratio                                          Angle
                               3              4                5               6              7
 Front Wing 150mph           9.73           9.00             8.92             8.87           7.78
 Front Wing 220mph           9.40           9.39             9.06            8.31            7.76
 Back Wing 150mph            9.64           9.93             10.00           10.23           9.86
 Back Wing 220mph            9.39           10.17            10.03           10.00           9.80

 Tab. 1: The various Lift: Drag ratios of the Front Wing and Rear Wing at 150 mph and 220 mph.

As a next step, the best angles were then chosen for a simulation of the entire car. Angles 6 and 7 were
chosen for the Front Wing as they both had the top two highest downforce values and angle 6 was
chosen for the Rear Wing. The results of such a combination on the full car were surprising (see Figure
12).

  Fig. 12: Results of full car simulations at a fixed 6 degree orientation of the Rear Wing and a 6 and
  7 degree orientation of the Front Wing. A 6 degree Front Wing angle of attack was determined to
  be most effective in maximizing downforce.

The results clearly indicated that a Front Wing orientation of 6 degrees would maximize downforce, as
at 7 degrees there was a drop in downforce, and also since a Front Wing orientation of 5 degrees,
although possessing a higher Lift: Drag ratio (see Table 1), had significantly lower downforce. What
remained to be determined was the most optimum Rear Wing orientation.

At a Front Wing angle set at 6 degrees now, simulations were run with a Rear Wing orientation varying
from -3 degrees to +10 in increments of 2 degrees. Any coupling effect of the Front and Rear Wings on
the downforce was ignored given the linearity of the problem. It was evident that changing the angle of
attack on the Rear Wing, either positively or negatively, had little effect on the downforce but had a
strong impact on the drag, unexpectedly so. Exceeding a Rear Wing AoA (angle of attack) of +2 degrees
or going below -3 degrees added less than 80 Newtons to the downforce but significantly increased
                                           Computer-Aided Design & Applications, PACE (1), 2011, 1-14
                                                © 2011 CAD Solutions, LLC, http://www.cadanda.com
11
drag. Hence the safe bracket for the Rear Wing was determined to be -3 degrees to +2 degrees
reflecting a design flaw with regards to the Rear Wing as such behavior was neither expected nor ideal.
The CFD results question the Formula 1 car’s design and aerodynamic capabilities and suggested
several flaws in the design and recommendations for optimization. In the end the car under-performed
greatly with regards to downforce but did exceptionally well with a very low drag coefficient (see Table
2). As most Formula 1 cars have a drag coefficient varying between 0.75 and 0.90, the PACE Formula 1
car achieved a staggering low drag coefficient of 0.75 with a maximum touching 0.83. However it failed
in its efforts to obtain a 1:1 Downforce to Weight ratio at 150 mph and 220 mph.
Best Best Best Best FW – RW Max/ Min Drag Overall
Downforce Downforce at Downforce at AoA Coefficient
at 100 150 mph 220 mph combination
mph
None 1475 N 3250 N FW: 6 deg 0.83 Drag: Excellent
D/W: 0.2 D/W: 0.46 RW: -3* to +2** 0.75 Downforce: Poor
Tab. 2: The final results of aerodynamic performance of the PACE Formula 1 race car.
9 AERODYNAMIC RECOMMENDATIONS
Several positives and negatives were derived out of this study. The effectiveness of the Scallops is
clearly seen by their fluid flow directing capabilities; channeling flow above the rear wheels and
pushing as much of the remaining air into the Rear Wing area helped streamline the car (see Figure 13).
The Rear Wing endplates (plates on each side of the wing) effectively minimize vortex formations
which typically arise due to a contrast of low and high pressures [7]. An ineffective end plate would
allow the high pressure air above the wing surface to mix with the low pressure air on the wing side
and cause large vortex formation (see Figure 13).
Scallops
Fig. 13: From left to right: (a) The effectiveness of Scallops is evident in how it channels air above the
rear wheel (b) The end plates of the rear wing do not generate heavy vortices due to good design and
placement.
However several negatives arose as well. The Front Wing end plates are improperly placed directing air
directly into the front wheel’s center (see Figure 14). The underbody diffuser has air channels that
serve little aerodynamic purpose and in reality cause early induced flow separation instead of directing
Computer-Aided Design & Applications, PACE (1), 2011, 1-14
© 2011 CAD Solutions, LLC, http://www.cadanda.com12
air inward to the rear diffuser channel. The diffuser design is ineffective in reducing the pressure due
to high speed airflow and creating suction (see Figure 14). The Rear Wing design allows air to simply
glide through without capturing air or increasing the surface area for air to flow over (see Figure 15).
Additionally the Front Wing lacks a sufficient curvature profile to direct air above the Front Wings and
like the end plates, channels air to meet the front portion of the wheel (see Figure 15).
Fig. 14: From left to right: (a) The front end plates on the Front Wing direct air both to the outside of
the front wheel and to the center of the front wheel when it should only channel air outside of the
front wheel; also seen are the air channels of the diffuser (highlighted in red for clarity) that cause
early flow separation ( ) and do not direct air inward to the rear collector but rather outward (b)
Ineffective diffuser design inducing very little suction force as is evident by the insignificant low
10pressure
CONCLUSION
areas that appear only at the rear end of the diffuser.
While a few other design flaws exist and it is not possible to represent the analysis as a whole in this
setting, several modifications will allow the PACE Formula 1 car to achieve high levels of performance
at high speeds and much easily approach a 1:1 Downforce to Weight ratio. First, the Front and Rear
Wings would need to be altered. Both wings allow air to only glide through while most F1 car designs
form a small cavity or cup to capture air. Incorporating such a curved profile would dramatically
increase downforce. Additionally the Front Wing endplates are recommended to move out so that they
direct air outside of the line of the front wheels while a curvier Front Wing directs air above the front
wheels – this would allow much less air to interface with the wheels and reduce drag (see Figure 15).
Fig. 15: From left to right: (a) The Rear Wing at its default state does not capture air as most Formula 1
car Rear Wings do as shown in (b). (c) The Front Wing needs a sharper curvature to direct most of the
air above the front wheel instead of merely guiding most air directly to the midpoint of the wheel –
this will also greatly increase downforce.
Apart from the Front and Rear Wing and Diffuser designs, other modifications are necessary as well.
The current ground clearance of the race car exceeds 5 inches while typical Formula 1 cars have a
ground clearance of less than 2 inches: in most cases even almost an inch. While the reduction needed
is about 75%, the benefits expected are much higher. A lower ground clearance would help the PACE
car take benefit of the ground effect of higher air speeds thus creating a greater suction force [7].
Diffusers function on the Venturi Effect that states that airflow is faster when the channel or entrance
it passes through is constricted or small [7]. This lowers the air pressure, sucks the car to the ground
Computer-Aided Design & Applications, PACE (1), 2011, 1-14
© 2011 CAD Solutions, LLC, http://www.cadanda.com13
and creates downforce. Since the Venturi Effect is a function of the square of the velocity difference,
greater suction would be created with slight increases in speed due to a narrower clearance.
Additionally, a lower ground clearance of the front wings leading edge would also add to the creation
of downforce, anchoring the car further to the road. This is a colossal component of Formula 1
aerodynamics and with a much lower ground clearance immediate increases in downforce are expected
to be observed.
Finally, wheel rim covers or fairings would help further streamline the car. The analysis showed high
pressure generation (22% lesser than that seen by the front nose and 15% lesser than that seen by the
Front Wing) due to open wheels. Wheel rim covers are often utilized at high speeds to prevent air from
stagnating at the inside of a wheel and increasing drag (see Figure 16)
Fig. 16: Wheel rim covers. From left to right: (a) High pressure generated at center of wheel due to it
not being sealed (b) A wheel rim cover or fairing would streamline airflow around the car.
10 CONCLUSION
Running simulations on the PACE Formula 1 car provided valuable insight on how the car would react
during high-speed runs. Being able to complete simulations was dependent on the ability of our team
to move the CAD model from NX to Star CCM+. The difficulty of the import process was due to the lack
of up-keep with the CAD model after changes had been made to the car along with the many different
modeling practices used by other universities. To prevent future problems, it is recommended that any
and all changes made while a product is being built be rigorously documented and corrected within the
CAD model. The Star CCM+ surface wrapper, Transform tool, and Contact Prevention tool were critical
to generating a mesh from the CAD model and making corrections and changes to the meshed
geometry.
Additionally this project was highly educational on aerodynamics and CFD simulations, high speed
performance, automobile design and development and Finite Element Analysis along with
Supercomputing. Through this project, the performance of the race car was analyzed, its aerodynamics
evaluated, and necessary recommendations and suggestions provided for the next iteration of the car.
These suggestions include redesigning the rear wing to increase its generated downforce and setting
the front wing at an angle-of-attack of 6 degrees. As students, we saw first-hand the process of
designing a car from an aero-dynamical perspective, right from the CAD model to analyzing
streamlines and pressure paths, for the most dangerous speeds and have developed a strong
appreciation for automotive design, the capabilities of aerodynamic and CFD analysis and an ever
growing liking for Formula 1 racing.
REFERENCES
[1] Tu, J.; Yeoh, G.; Heng; L, C.: Computational Fluid Dynamics: A Practical Approach, Butterworth-
Heinemann, Burlington, MA, 2008.
[2] What is the Polyhedral Meshing Model?, Star CCM+ 6.02.0009 Help
Computer-Aided Design & Applications, PACE (1), 2011, 1-14
© 2011 CAD Solutions, LLC, http://www.cadanda.com14
[3] What is the Prism Layer Meshing Model?, Star CCM+ 6.02.0009 Help
[4] What is the Segregated Flow Model?, Star CCM+ 6.02.0009 Help
[5] What Is the Realizable K-Epsilon Model?, Star CCM+ 6.02.0009 Help
[6] Fulton Supercomputing Lab, Brigham Young University, Provo, Utah
[7] Formula One Technology Explained, Ferrari Technical Partnership, Shell Corporation,
www.shell.com/home/motorsport/f1_explained
Computer-Aided Design & Applications, PACE (1), 2011, 1-14
© 2011 CAD Solutions, LLC, http://www.cadanda.comYou can also read