CFD simulations of diesel multi-hole injector internal flow and spray jet development at increasing chamber pressure and temperature conditions
←
→
Page content transcription
If your browser does not render page correctly, please read the page content below
ILASS–Europe 2019, 29th Conference on Liquid Atomization and Spray Systems, 2-4 September 2019, Paris, France

CFD simulations of diesel multi-hole injector internal flow and spray
 jet development at increasing chamber pressure and temperature
                            conditions
                                        Charalambos Chasos*1
                              1
                               Frederick University, 1036 Nicosia, Cyprus
                            *Corresponding author: eng.cca@frederick.ac.cy

Abstract
Strict emissions regulations and engine performance improvement requirements impose the development and
use of high-pressure multi-hole diesel injectors, which are employed in direct-injection common rail systems of
diesel internal combustion engines. The fuel injection and air/fuel mixing can be improved by increasing the
injection pressure higher than two thousand bar. However, high injection pressures may cause cavitation and
affect the initial spray characteristics, including jet shape and spray angle. The main objective of the present work
was to investigate the effect of chamber pressure and temperature on the internal nozzle flow, on the initial liquid
jet breakup length and on the jet angle at the vicinity of the nozzle exit. A typical diesel six-hole injector with
nozzle holes symmetrically located around the periphery of the injector tip was designed and modelled. The
nozzle diameter and length were 0.2 mm and 1 mm, respectively, with a ratio of nozzle orifice length over nozzle
diameter L/D equal to 5. The symmetrical one-sixth segment of the injector at the nozzle tip was assembled with
a constant volume chamber with square cross-sectional area with side 1 mm and a chamber length of 5 mm. A
computational unstructured mesh of around one million prism cells was generated with the STAR-CD
computational fluid dynamics (CFD) code. The transient CFD simulations were performed with the STAR-CD
code, utilising the Eulerian methodology and the volume of fluid (VOF) method for the two-phase flow of liquid and
gas, and using the Rayleigh cavitation model. CFD simulations were performed for an injection pressure of 2245
bar of liquid n-heptane which was injected in the constant volume chamber at increasing chamber pressure and
temperature. Four test cases were investigated, including atmospheric chamber pressure and temperature,
atmospheric pressure and chamber temperature of 700 K, and high chamber pressure of 42 bar at 700 and 1000
K chamber temperature, respectively. For all cases, cavitation occurs at the region of upper wall of the nozzle
and affects the fuel/air mixing downstream the nozzle exit. The increase of chamber temperature slightly reduces
the spray cone angle and has negligible effect on jet breakup length. The spray angle increases around 50 %
when the chamber pressures increases by around 40 bar, and the spray angle decreases around 10% when the
chamber temperature increases by 300 K. Comparisons of jet breakup length and the spray jet angle against
empirical data showed moderately good agreement.

Keywords
Multi-hole diesel injector, CFD simulation, VOF method, cavitation, breakup length, spray jet angle, empirical
data.

Introduction
The phenomenon of high-pressure diesel injection from diesel injector nozzles is very complex and the
disintegration of the emerging jet requires further understanding. Modern high-pressure diesel injectors are of
multi-hole type and have nozzles with a length over diameter ratio, L/D, ranging from approximately 4 to 6. The
injection pressures applied in common rail injection systems can be higher than 2000 bar, and diesel fuel injection
in engine cylinders takes place in high pressure and temperature conditions, during compression stroke in
cylinders with high turbulence. The high injection pressure in combination with the sudden decrease of cross-
sectional area at the vicinity of the diesel nozzle entry generates cavitation. The aim of the present work was to
examine the effects of chamber pressure and temperature on the internal nozzle flow where cavitation occurs, the
effects on the initial liquid jet breakup length and on the spray jet angle at the vicinity of the nozzle exit.
Furthermore, it was the objective of the present was to characterize the effects chamber temperature and
pressure on the pattern of the air/fuel mixture downstream the nozzle in the chamber.
The internal and external flows of diesel injectors were investigated in experimental [1, 10, 14, 15] and
computational [1, 6, 9, 11, 13] studies, among others. The main findings from experiments carried out in
transparent large scale injectors showed that cavitation occurs in the nozzle [10, 14], and that the spray jet at the
vicinity of the nozzle exit is dictated by the cavitation upstream in the nozzle and the interaction with the ambient
gas flow. Modelling and simulation studies examined the injector flow utilising the VOF methodology [8] and the

This work is licensed under a Creative Commons 4.0 International License (CC BY-NC-ND 4.0).
ILASS – Europe 2019, 2-4 Sep. 2019, Paris, France
large eddy simulation methodology [5]. From simulations [8], it was found that strong vortex structures are
generated around the liquid jet penetrating in the gas phase due to the velocity relaxation within the liquid jet
inside and outside the nozzle. Also, the effects of injection pressure on the initial spray atomization
characteristics were examined, and it was revealed that when the injection pressure increases, then both the
breakup length and the downstream penetration of the spray jet increase, while the spray jet angle at the vicinity
of nozzle exit slightly increases with increasing injection pressure.
For better understanding of diesel injection into varying chamber conditions, the present work used CFD
simulations at constant high injection pressure and examined the effect of chamber temperature and pressure on
the liquid jet breakup length, on the spray jet cone angle, and on the air/fuel mixture pattern within the constant
volume chamber.
Methodology
The Eulerian modelling methodology included the mass, momentum and energy conservation equations for the
two phases, employing the VOF method as it is implemented in the CFD code STAR-CD [3]. The interface-
capturing method in the VOF method was used, which computes the convective terms in the volume fraction
equations using the High-Resolution Interface-Capturing (HRIC) model [3]. For the two-phase flow modelling, the
pressure in the two phases is assumed the same. Constant surface tension coefficient is used, with which the
normal force due to the surface tension is treated using the continuum surface force (CSF) model [3], while the
tangential force is not accounted. The CSF model provides a source term in the momentum conservation
equation. The turbulence was modelled with the k-ε high Reynolds number RNG model [17], and the boundary
layer was handled with the standard wall functions. The MARS [3] differencing scheme was used for the
discretization of the conservation equations. The SIMPLE algorithm [3] was employed for the transient numerical
solution of the problem.
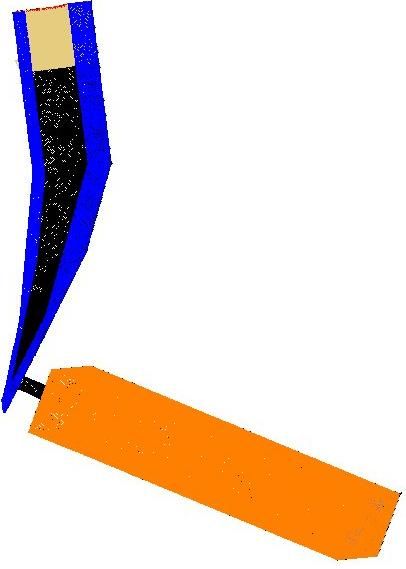
Figure 1. Three-dimensional injector geometry.
A VCO sac-less six-hole diesel injector was designed using published geometry details from typical multi-hole
diesel injectors from literature ([10, 11, 14, 15]). The three-dimensional injector was designed with a CAD
software [4 ]and it is illustrated in Figure 1. The nozzle entry has a sharp edge at the body of the injector. The
injector nozzle diameter and length were 0.2 mm and 1 mm, respectively, with a ratio of nozzle orifice length over
nozzle diameter L/D = 5.
This work is licensed under a Creative Commons 4.0 International License (CC BY-NC-ND 4.0).ILASS – Europe 2019, 2-4 Sep. 2019, Paris, France
Figure 2. Computational mesh and boundary conditions.
A constant volume chamber was assembled at the nozzle exit tip, with a length of 5 mm and a square cross-
sectional area with side width 1 mm. The constant volume chamber was assembled at the centreline of the nozzle
and the symmetry axes of the chamber and the nozzle coincided. The computational mesh was generated with
the automatic mesh generation tool of STAR-CD [3]. The resulting mesh was composed of around 850000 prism
cells, and it is shown in Figure 2. The cell size was around 5 to 10 μm within the injector and between 10 to 20 μm
in the chamber. Inlet boundary condition was defined at the entry of the injector on the top, presented in dark
yellow color in Figure 2. Symmetry plane boundary conditions were imposed on the symmetry sides of the one-
sixth segment of the injector, indicated with violet color in Figure 2. Slip wall boundary condition was imposed on
the four sides of the chamber, presented with orange color in Figure 2. No-slip wall boundary condition was used
at the injector body, at the injector needle and the back plane of the chamber wall where the nozzle was
assembled. At the inlet boundary, the volume fraction of the fuel was set equal to 1, and uniform inlet velocity
was defined. The injection pressure at the inlet of the injector was calculated by code using the inlet velocity. The
fuel used was n-heptane, and the physical properties of liquid fuel, vapour fuel and air were taken from the
database of STAR-CD [3] and are included in Table 1.
Table 1. Liquid/vapour fuel and air properties.
Property Liquid Vapour Air
n-heptane n-heptane
3
Density (Kg/m ) 678.3 2.48639 1.18415
-4 -5 -5
Molecular viscosity (Kg/ms) 3.92073 10 1.01377 10 1.855 10
Surface tension coefficient (N/m) 0.0727
Pressure boundary condition was defined at the chamber front plane, where the different conditions of chamber
pressure and temperature were defined for each test case.
For the transient simulations, stagnant air initial conditions were set in the computational domain. The simulations
for the four test cases were performed for an injection duration of 1 ms with a constant time step size of 0.5 μs.
For the validation of the present simulations, empirical equations were used and empirical data was estimated for
comparisons. The empirical equations provide the primary spray atomization characteristics, and can be used for
the atomization modelling for diesel engines in the absence of experimental data. The empirical equations for the
calculation of the breakup length and the spray angle were selected from [15] and [2], respectively.
The liquid jet breakup length was calculated with the equation from [2],
(1)
where Δp is the pressure drop along the nozzle, ρl is the liquid density and t is the elapsed time after the start of
injection.
The diesel jet spray angle in the atomisation region was calculated by the equation from [2],
(2)
This work is licensed under a Creative Commons 4.0 International License (CC BY-NC-ND 4.0).ILASS – Europe 2019, 2-4 Sep. 2019, Paris, France
where D is the nozzle diameter, is the density of air in the chamber and is the molecular viscosity of air.
Results
The simulation results obtained for the four test cases are presented and discussed in the current section. The
injection pressure for the four test cases was constant and equal to 2245 bar, while the chamber pressure and
temperature varied from atmospheric conditions to high pressure and temperature. The chamber pressure and
temperature for the four test cases are included in Table 2. The injection pressure was calculated by the code at
the inlet boundary using a constant liquid velocity of 28 m/s providing a fuel mass flow rate equal to 0.0592 Kg/s.
Table 2. Test cases operating conditions.
Test case Description of chamber conditions Pch Tch
(bar) (K)
1 Atmospheric 1 298
2 Atmospheric pressure and high temperature 1 700
3 High pressure and high temperature 42 700
4 High pressure and maximum temperature 42 1000
For the four test cases, firstly the simulation results are plotted and compared at the vertical symmetry section
plane of computational domain. Then, comparisons of the breakup length and spray angle data estimated from
the simulations against empirical data are presented.
Firstly, for the atmospheric chamber pressure, and increasing temperature from 298 to 700 K, the simulations
comparison of the evolution of the VOF and velocity fields for the Cases 1 and 2 are presented in Figure 3 and 4.
Then, the results of Cases 2 and 3 for constant chamber temperature of 700 K and increasing chamber pressure
from 1 to 42 bar are presented Figure 5 and 6. Finally, the more realistic results resembling diesel engine cylinder
conditions, for the Cases 3 and 4 at constant pressure of 42 bar and increasing temperature from 700 to 1000 K
are compared in Figure 7 and 8. The plots of simulation results are indicated with the instance of time in ms after
the start of injection (ASOI).
VOF
Figure 3. Comparison of the VOF field for the Cases 1 and 2, for chamber pressure 1 bar and temperature 298 K (left) and 700
K (right), at 0.15, 0.2 and 0.25 ms ASOI.
v(m/s)
This work is licensed under a Creative Commons 4.0 International License (CC BY-NC-ND 4.0).ILASS – Europe 2019, 2-4 Sep. 2019, Paris, France
Figure 4. Comparison of the velocity field for the Cases 1 and 2, for chamber pressure 1 bar and temperatures 298 K (left) and
700 K (right), at 0.15, 0.2 and 0.25 ms ASOI.
The transient development of the spray jet can be observed in Figure 3 and 4 at 0.15, 0.2 and 0.25 ms ASOI. It
can be seen that cavitation starts from the upper edge of the nozzle entry. Also, the cavitation pattern does not
change after around 0.2 ms ASOI. The core of the spay jet has a quasi-steady pattern at the vicinity of the nozzle
and it is slightly deflected towards downward, because of the interaction with the gas flow field in the chamber as
it can be seen in Figure 4. Figure 3 shows that a slightly narrower jet is produced when the chamber temperature
is increasing, because of the evaporation phenomenon which becomes stronger. However, the differences for
increasing chamber temperature are negligible, as it is shown in both Figure 3 and 4.
The comparisons of the results examining the effect of the increasing chamber pressure on the VOF and the
velocity fields for high temperature of 700 K, are included in Figure 5 and 6. When the chamber temperature
increased, then the emerging jet downward deflection intensified at 0.15 ms ASOI as it is shown in Figure 5, and
afterwards the jet radial spreading increased. It can be also observed that the jet which emerges in the chamber
with higher pressure on the right in Figure 5 is more unstable and attenuates compared to jet of the low pressure.
Also at lower pressure the jet is more symmetrical than the jet at higher pressure. The velocity field comparison is
included in Figure 6 and shows that the gas velocity field becomes wider when the chamber pressure is
decreased especially at areas where fuel is not present. This widening of the velocity field indicates that the spray
jet penetrates faster at low chamber pressure than the spray jet at high chamber pressure. As it can be seen in
Figure 5, at high pressure the fuel jet angle towards downstream is bigger than the jet angle at the low pressure,
because of the instability and attenuation of the emerging the jet. The important observation is that the jet breakup
length increases when the chamber pressure is increasing from approximately 1 mm to 1.5 mm, as it can be
noticed at 0.25 ms ASOI.
VOF
Figure 5. Comparison of the VOF field for the Cases 2 and 3, for constant chamber temperature of 700 K and increasing
pressure from 1 bar (right) to 42 bar (right), at 0.15, 0.2 and 0.25 ms ASOI.
v(m/s)
Figure 6. Comparison of the velocity field for the Cases 2 and 3, for constant chamber temperature of 700 K and increasing
pressure from 1 bar (right) to 42 bar (right), at 0.15, 0.2 and 0.25 ms ASOI.
For the high pressure chamber condition of 42 bar and for increasing temperature from 700 to 1000 K, the plots of
the VOF and velocity fields are compared in Figure 7 and 8. The results in in Figure 7 and 8 are similar to the
This work is licensed under a Creative Commons 4.0 International License (CC BY-NC-ND 4.0).ILASS – Europe 2019, 2-4 Sep. 2019, Paris, France
results presented in Figure 3 and 4, where the jet at the highest temperature is slightly thinner, as well as the
temperature increase has negligible effect on the resulting spray jet shape, breakup length and angle.
VOF
Figure 7. Comparison of the VOF field for the Cases 3 and 4, for chamber pressure 42 bar and temperatures 700 K (left) and
1000 K (right), at 0.15, 0.2 and 0.25 ms ASOI.
v(m/s)
Figure 8. Comparison of the velocity field for the Cases 3 and 4, for chamber pressure 42 bar and temperatures 700 K (left) and
1000 K (right), at 0.15, 0.2 and 0.25 ms ASOI.
The main finding from the simulation results and their comparisons, was that the effect of chamber pressure is
more intense on the resulting spray than the effect of chamber temperature. This phenomenon can be explained
by the resulting chamber densities which affect the momentum transfer between the gas and the fuel liquid and
vapour phases, along with the pertinent interactions within the chamber. It was generally observed that the
cavitation pattern within the nozzle is not affected for the chamber temperature and pressure conditions which
were examine in the present work.
The comparison of the breakup length estimated from the simulations for the cases at high chamber pressure
against the breakup length empirical data is illustrated in Figure 9. The time of the start of injection was adjusted
with the value of 0.14 ms, in order to account for the elapsed time from the start of simulation, which is required
by that the jet to start emerging from the nozzle exit. From the simulation results, the breakup length was
estimated at the distance from nozzle where the VOF value was equal and greater than 0.15, as it can be seen in
the plots of Figure 7, at 0.15 ms and 0.2 ms, respectively. Figure 9 reveals that the breakup length data
estimated from the simulation agrees very well with the empirical data at the early stages of injection at 0.01 ms
ASOI. Both in the simulation and the empirical data, the breakup length increases with elapsed time, as it is
shown in Figure 9. However, during the later period of spray injection, the liquid jet penetration is underpredicted.
The underprediction is due to the evaporation phenomenon which is present and it is modelled by the simulation,
while the empirical data does not account the evaporation phenomenon.
This work is licensed under a Creative Commons 4.0 International License (CC BY-NC-ND 4.0).ILASS – Europe 2019, 2-4 Sep. 2019, Paris, France
Figure 9. Comparison of the breakup length between the simulation and the empirical data with elapsed time ASOI, for
chamber at high pressure.
From the simulations, the spray jet average angle was estimated at 0.25 ms ASOI, by using tangents from the
nozzle exit upper and lower edges directed to the outer upper and lower edges of the jet spray at the distance of
five nozzle diameters from the nozzle exit. The average spray jet angle for the cases of increasing chamber
pressure from 1 to 42 bar at 700 K are compared with the empirical data in Figure 10. As it can be observed from
Figure 10, the same trend of the spray angle increase with increasing chamber pressure is captured, both in the
simulation and in the empirical data. Figure 10 also shows that the spray angle is underestimated at low chamber
pressure, while at high chamber pressure is very well predicted by the simulation.
Figure 10. Comparison of the spray angle between simulation and empirical data at 0.25 ms ASOI for increasing chamber
pressure at 700 K chamber temperature.
The comparison of spray angle for high chamber pressure conditions and 700 and 1000 K is illustrated in Figure
11. Figure 11 shows that the same trend of a slight decrease of the spray angle when the chamber temperature
is increasing occurs both for the empirical data and the simulation. The agreement of spray jet angle from the
simulations with the empirical data is very good, and the spray angle is slightly underestimated in the simulations.
Again, the underestimation can be explained by the evaporation phenomenon which takes place and reduces the
radial dispersion of the predicted spray jet from the simulation.
This work is licensed under a Creative Commons 4.0 International License (CC BY-NC-ND 4.0).ILASS – Europe 2019, 2-4 Sep. 2019, Paris, France
Figure 11. Comparison of the spray angle between simulation and empirical data at 0.25 ms ASOI for increasing chamber
temperature at 42 bar chamber pressure.
For reaching definite conclusions and assess the validity of both the simulation and empirical data, detailed
measurements of the liquid breakup length and the spray jet angle are required for the various chamber
conditions examined in the present work. Furthermore, chamber conditions resembling diesel engine conditions,
including high turbulence, exhaust gas residuals and exhaust gas recirculation are needed. Overall, the
simulations performed in the present work captured the same trends with the empirical data and can provide
meaningful results which can be used for diesel engine spray investigations and diesel engine combustion
modelling setup, which should be complemented with the relevant combustion modelling methodologies including
detailed and/or reduced chemical kinetics mechanisms configurations, for real fuels at high pressure and high
temperature conditions.
Conclusions and recommendations
The effects of chamber pressure and chamber temperature on the initial diesel spray characteristics were
examined by the use of two-phase flow simulations of a typical six-hole diesel injector injecting at very high
pressure. The flow patterns within the nozzle and at the vicinity of the nozzle exit were simulated and compared
for four test cases.
The main finding revealed that the effect of temperature on the spray jet is negligible, while the effect of chamber
pressure on the liquid breakup length and spray jet angle is very strong. The comparisons with empirical data
verified that the simulation captures the same trends for the liquid jet breakup length especially at the early stages
of injection, as well as the spray jet angle values. The spray angle increases by around 50 % when the chamber
pressures increases by 40 bar, and when the chamber temperature increases around 300 K the spray angle
decreases around 10 %.
For future work, the methodologies of LES and DNS will be used in order to further examine the chamber
conditions effect on the initial spray jet characteristics. However, it is further required to compare the simulations
against detailed experimental data of sprays in both constant volume chambers with conditions resembling engine
cylinder conditions with high levels of turbulence, as well as simulate the diesel spray injection in diesel engine
cylinders, where the conditions of cylinder pressure and temperature are varying both during piston motion and
from engine cycle-to-cycle.
Acknowledgements
The provision of computer facilities by Frederick University is acknowledged.
References
[1] Andriotis, A, Gavaises, M. and Arcoumanis, C., 2008, J. Fluid Mech., 60, pp. 195-215.
[2] Arai, M., Sep. 2.-6. 2012, 12th Triennial International Conference on Liquid Atomization and Spray Systems.
[3] Computational Dynamics adapco Ltd., 2015, STAR-CD Methodology, Version 4.22. London, England.
[4] Dassault Systèmes SolidWorks Corporation, http://www.solidworks.com.
[5] de Villiers, E., Gosman, A. D. and Weller, H. G, 2004, SAE Technical Paper Series 2004-01-0100.
[6] Giannadakis, E., Gavaises, M. and Arcoumanis, C., 2008, J. Fluid Mech., 616, pp. 153-193.
[7] Heywood, J. B. 1987, "Internal Combustion Engine Fundamentals"
This work is licensed under a Creative Commons 4.0 International License (CC BY-NC-ND 4.0).ILASS – Europe 2019, 2-4 Sep. 2019, Paris, France
th
[8] Jameel, A., Bowen, P., and Yokoi, K., 8.-10. Sep., 2014, 26 European Conference on Liquid Atomization and
Spray Systems.
[9] Margot, X., Hoyas, S., Fajardo, P. and Patouna, S., 2010, Mathematical and Computer Modelling, 52, pp.
1143-1150.
[10] Oda, T., Ohnishi, K., Sumi, T. and Ohsawa, K., Sep. 2.-6. 2012, 12th Triennial International Conference on
Liquid Atomization and Spray Systems.
[11] Payri, F., Payri, R., Salvador, F. J. and Martinez-Lopez, J., 2012, Computers & Fluids, 58, pp.88-101.
[12] Payri, F., Salvador, F. J., Marti-Aldaravi, M. and Martinez-Lopez, J., 2012, Energy Conversion and
Management, 54, pp.90-99.
[13] Salvador, F. J., Martinez-Lopez, J., Romero, J. V. and Rosello, M. D., 2013, Mathematical and Computer
Modelling, 57, pp. 1656-1662.
th
[14] Sou, A., Pratama, R. H., Tomisaka, T. and Kibayashi, Y., 2.-6. 2012, 12 Triennial International Conference
on Liquid Atomization and Spray Systems.
th
[15] Tamaki, N., Nishikawa, K. and Fukamichi, S., 1.-4. Sep.2013, 25 European Conference on Liquid
Atomization and Spray Systems.
[16] Varde, K. S., 1985, The Canadian Journal of Chemical engineering 63
[17] Yakhot, V., and Orszag, S.A. 1986, J. Scientific Computing, 1, pp. 1–51.
This work is licensed under a Creative Commons 4.0 International License (CC BY-NC-ND 4.0).You can also read