Challenges and Trends in the Automotive Industry 2019 - Ehningen , Capital Market Day 2019 - Bertrandt
←
→
Page content transcription
If your browser does not render page correctly, please read the page content below

Challenges and Trends in the
Automotive Industry 2019

Ehningen , Capital Market Day 2019
Introduction

S&PwC supports the whole value chain transformation – Experts
from Industry for Consulting
            Strategy
                                                     Products, Services                          New Operating Models
• Portfolio Capability
• Operating Models
                                          Globalization
                                                                                                                 Business digitization
    Competitiveness
• Product Cost
• CAPEX                                        Industry 4.0               ~50 Partners               @        Connectivity
                                                                          EMEA/China
• Productivity
        Organization
                                                          New Mobility
• Benchmarking                                                            References 2018
• Best Practice
• Implementation                                                           3 Digital providers
                         4 Raw Material                8 Software CE                               FS                   Sales & service
                                                                          14 OEM
                         4 Network providers           21 Supplier                                            Fleets    & network

Strategy&                                                                                                                                 1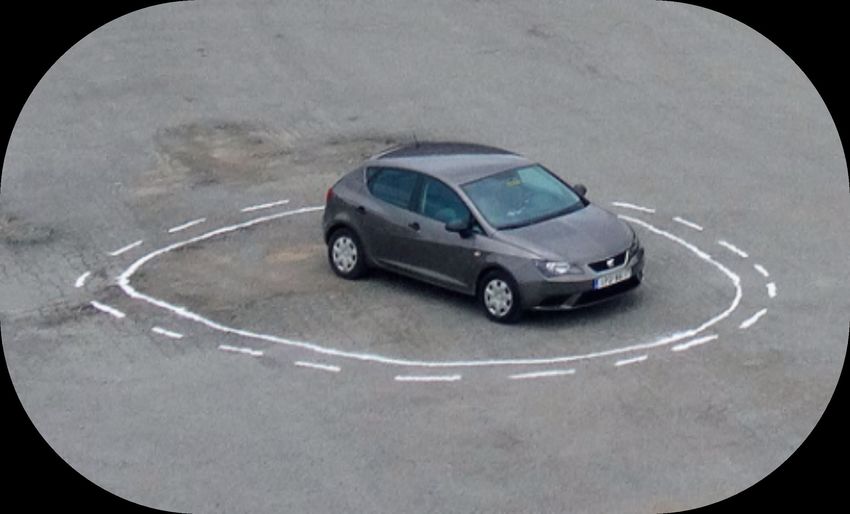
Introduction

New technologies and customer requirements lead to fundamental
transformation of the automotive industry and its players

                   Short term                                 Medium term                                                                     2035+
                                                                                                                            Fully autonous driving – New operating models for OEM
                                               New Services
                                                                                                                                     Usage-based
                                                                                                                                       payment                             “smart” vehicles
                                                                                   Entertainment
                Safety                      Vehicle
                                          management                                                                                                                                   Autonomous
                                                                                                                                                   Adapted
                                                                           Integration                       Mobility                                                                    driving
                                                                                                                                                infrastructure
                                               Semi-                        of Smart                       management
               Comfort
                                            autonomous                        Home                                                                       Changed OEM operating model
                                               driving
                                                                                         2) Digital ecosystem for the vehicle

                            1) Vehicle-related services                                                                                              Digital competitors control growing proportions
                                                                                 Competitors in the digital ecosystem compete with OEMs for                       of user experience
                    OEMs control vehicle-related services                                         additional service offerings

                                                                                             Challenges for OEMs
 Robust quality processes                                                                       and suppliers

            Increasing complexity and                          Validation of new technologies and
                                                                                                                  Regulatory framework conditions                    Increasing modularization
                number of variants                             shorter life cycles/ market launches

              Increasing demand for                                      High flexibility and                        Knowledge about laws and                    High level of responsibility through
               tests and validations                                 responsiveness to changes                         regulatory framework                          use of individual modules

Strategy&                           Source: PwC Strategy& analysis                                                                                                                                      2
Introduction

Reality of E-Mobility in Germany Today – 2019

    Goal of the Federal
       Government's
      Electromobility
    Initiative 2012 was
   2.0 million e-mobiles
          by 2020.

Strategy&                                       3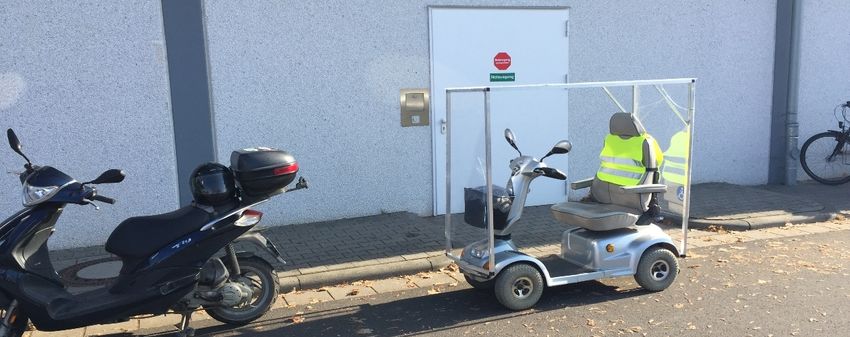
Introduction

Industry claims : E-Mobility mass production will start right now

                Volkswagen MEB Platform is planned to be
                 manufactured 1,0 m units p.a. as of 2022

Strategy&                                                           4
Introduction

Vision and Demand of Our Industry 2020

       Demanding:
    Productivity wins
      by Robotic for
     Compatitiveness
  throughout demografic
         change

Strategy&                                5
Introduction

Our digital dashboard helps to navigate the future as both carmaker
and mobility service provider
Digital dashboard with key transformation areas

                                                                   Customer pull
Chapter 1                      Technology push
                                                                 on-demand, shared,
                                                                                                    Regulation impact
                                                                 multi-modal mobility
Market                         connected, electric,
                                  autonomous                         Revenue and
                                                                                                   approvals, taxes, data
                                                                                                   privacy, infrastructure
radar                                                                 profit shift

Chapter 2
Mobility &                                                        Vehicle business
connected                                                     Connected          Mobility
service                                                        services          services
heads-up

Chapter 3
Capabilities
for the road                   Smart              Immersive     Hyper-local          Fit-for-purpose   Ambidextrous
ahead                         portfolio            channels      footprint             technology       organization

Strategy&                                                                                                                    6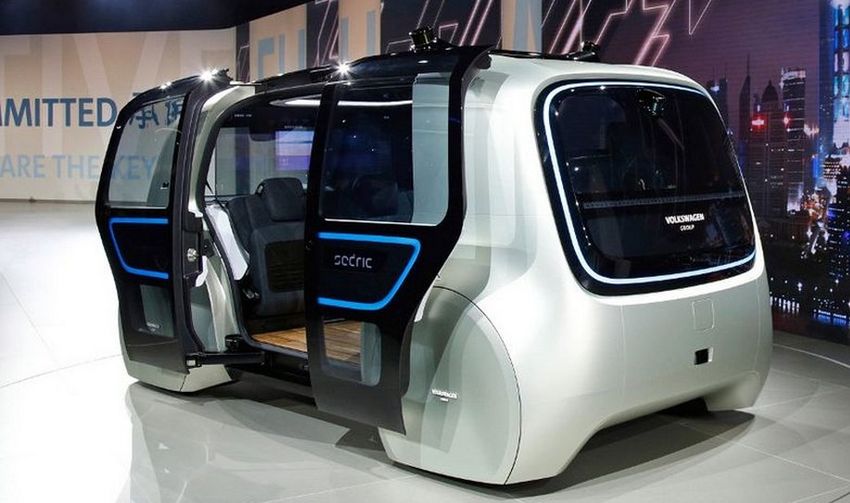
01.
Market radar
Strategy&      7
Market radar

Consumers expect mobility services that are convenient,
personalized, multi-modal and connected

                                                                                         Ubiquitously connected and
   Multi-modal                                                                           integrated                                                                          On-demand

   74% of consumers opt for the                                                          34% of European consumers                                                           47% of European
                                                                                         expect to seamlessly receive                                                        consumers would consider giving
   most convenient way to get
                                                                                         connected car services1) – so does a                                                up their own car in favor of
   from A to B – including the
                                                                                                                                                                             widely available and adequately
   combination of multiple                                                               89% share of Chinese customers                                                      priced autonomous robotaxi
   transport modes
                                                                                                                                                                             services

                                                            Personalized
                                                                                                                                                                Experience-driven
                                                            70% of consumers expect mobility
                                                            offers to be personalized – reflecting                                                              When traveling fully autonomous, music
                                                            their personal needs and mobility                                                                   streaming with 46% and video streaming with
                                                            patterns
                                                                                                                                                                42% are considered most relevant by
                                                                                                                                                                consumers to enhance their experience
  Shared
  70% of Chinese vehicle owners could                                                                                     Subscription-based
  imagine earning money from sharing their car                                                                            The majority of consumers would be willing to
  via a peer-to-peer platforms, while only 28%                                                                            pay up to $250 for a monthly subscription of
  would do so in Europe                                                                                                   unlimited rides within town

                                 1) Real-time traffic information, communication and advertising, news stream, music stream
Strategy&                        Source: PwC Strategy& consumer research, 2018, n=3000 (EU, USA , CHN)                                                                                                         8
Market radar
Electric and autonomous vehicles are subject to volatile regulatory
frameworks across the E.U., China and the U.S.
Regulatory trends
USA China
Electric Electric
• Target controversy between • Licensing privileges for BEVs
„CARB“ states and EPA and PHEVs in many cities
• Gap between CARB’s ZEV • Mandatory EV quota planned
sales targets and EPA’s for 2019
emission standards freeze • Stepwise reduction of vehicle
• OEMs anxious about subsidies until 2022
disparate US regulations
Autonomous
Autonomous • Legal initiatives for AVs on the
• Individual legislation in each EU political agenda, no nationwide
state fast ratification Electric Autonomous regulations issued yet
• AVs on public highways • Local focus on NOX & • AVs receive only test vehicle • Test vehicle registrations for
permitted in selected states particles status, driver mandatory for public highways in 7 cities
(Florida, Nevada, Virginia,..) testing on public roads (incl. Beijing and Shanghai)
• Credits for EVs to avoid CO2
• Michigan and California allow non-compliance penalties • L3 mode allowed in Germany, • Many players already testing
driverless vehicle tests yet unclarity about certification with local regulations of certain
• Inner-city bans of ICE planned
cities
Regulator as (1) accelerator (2) inhibitor (3) or neutral
Abbreviations: CARB – states that have adopted the California Emission Standards; EPA – US Environmental Protection Agency; ZEV – zero emission vehicle; EV – electric
Strategy& vehicle; AV – autonomous vehicle 9Market radar
Electric vehicle sales will be boosted by legislation especially in China
and E.U. after 2020
Electric vehicles (in total new vehicle sales) (E.U., U.S., China; in millions)
35 35
32
29
20 21 20 22
18 18 17 17
2018 2020 2025 2030 2018 2020 2025 2030 2018 2020 2025 2030
• 44% share of electric in 2030 • 20% share of electric in 2030 • ~50% share of electric in 2030
• Strong legislative push from 2020 on • As mobility patterns are not expected to • Strong legislative push from June 2018 on
• Sufficient public charging infrastructure change notably until 2030, EV • Integrated charging infrastructure ~2025
~2025 technologies follow conventional S-curve
adoption paths based on relative cost • Cost-of-operations advantages by
• Cost of operations tipping point differs by advantages segment and use pattern already evident
segment and use pattern
Combustion Hybrid Electric
Strategy& Source: PwC AutoFacts 10Market radar
Commercial applications will be first; China is far ahead
Robo Intralogistic
Robotaxis
Robo-Last Mile
Strategy& 11Market radar
Autonomous vehicles could be used in significant numbers after 2025
Autonomous vehicles (in total new vehicle sales) (E.U., U.S., China; in millions)
35 35
32
29
20 21 20 22
18 18 17 17
2018 2020 2025 2030 2018 2020 2025 2030 2018 2020 2025 2030
• ~25% of new cars with level 4/5 in 2030 • Share of level 4/5 up to ~10% in 2030 – • ~35% share of level 4/5 in 2030
• Assuming tech will allow level 4/5 point of inflection expected after 2030 • Assuming tech will allow level 4/5
adoption from 2028 onwards & regulation • Assuming a slower transformation in the adoption from 2028 onwards & regulation
in place US, as mobility behavior is driven by lower in place
• Robotaxis driving on specific routes / TCO of traditional cars than elsewhere • Growing middle class open for new
defined areas from 2025 onwards mobility modes and pushing demand for
autonomous
Level 0 Level 1 Level 2 Level 3 Level 4 Level 5
Abbreviations: TCO – Total Cost of Ownership
Strategy& Source: PwC AutoFacts 12Market radar
Shared-autonomous mobility will have strongest growth
in China
Distribution of mobility types in road-bound personal mobility1
2%
100% 3% 2% 6%
4% 1%
90% 12%
6%
80% 30%
3%
70%
6%
60%
6%
50%
91%
40% 76%
30%
52%
20%
10%
0%
2018 19 20 21 22 23 24 25 26 27 28 29 30 2018 19 20 21 22 23 24 25 26 27 28 29 30 2018 19 20 21 22 23 24 25 26 27 28 29 30
Personally owned driver driven Shared driver driven Personally owned autonomous Shared autonomous Robotaxi (2-6 seats) Shared autonomous People Mover (7-12 seats)
1. in % of total person km ”road” driven
Strategy& Source: PwC AutoFacts, Strategy& analysis 13Market radar
Vehicle parc expected to decline in Europe, followed by the U.S. –
yet, still growing in China
Total vehicle parc (in millions, auton./electr./connected, in % of total vehicle parc)
Total Total
Vehicle Parc Share
Parc
parc (mn) Mio % (in %)
% Mio
300 287 291 293 100
272 265 267 269 262 303 90
289
250 80
218 70
200
189 60
150 50
40
100
30
20
50
10
0 0
2018 2020 2025 2030 300 2020 2025 2030 2018 2020 2025 2030
• Uptake of connected, electric and autonomous after policy and technology breakthroughs
• Overall increase of distance driven and strong growth in relative share of vehicle-based mobility (China in particular)
• Increased vehicle utilization and turnover due to sharing/pooling resulting in declining vehicle base
• China: increase of new vehicle sales as new mobility modes become more affordable (larger customer base)
Autonomous Cars Electric Cars Connected Cars Total Parc
Strategy& Source: PwC AutoFacts 14Market radar
Industry profit share of traditional suppliers, OEM vehicle sales and
aftermarket could almost halve to 41% by 2030
Global automotive value pool shifts
Revenue distribution1) (in $bn) Profit distribution1) (in $bn) Key levers
• MaaS increases vehicle utilization and
5,315 8,931 377 637 respective vehicle wear/tear → higher
vehicle related sales, but declining vehicle
4%Market radar
The engineering supplier market is expected to grow with a CAGR of
approx. >6%
ESO market per region (EUR Mio.)
ESO market developoment per region ESO market growth per region
Geographical
attribution based on +7% 17,128 420 39 17,128
175 366
where operations 16,085 101 1,417 101
are located not 15,033 834 777 834 776
3,258
14,138 1,028 1,029
contracted.
13,235
+11% 12,346
11,453 4,916 11,453
4,645 4,915
(29%)
10,229 4,389 (29%) 468 62
9,666 4,147 (29%) 854 356
9,175 3,918
3,702 (29%)
3,498 (30%)
7,387 (30%) 3,498
3,122 3,173 (31%)
2,951 (31%)
(32%) (32%)
2,426 2014-2020 absolute and relative
9,473
(33%)
7,673 8,231 8,830
(55%)
growth per region 9,473
6,667 7,152 (55%) (55%)
5,522 6,215 (54%)
5,034 5,214 (54%) (54%) 6,215
3,977 (54%) (54%)
(55%) (54%)
(54%)
2010 2011 2012 2013 2014 2015 2016 2017 2018e 2019e 2020e Market Market
Size 2014 Size 2020
DE US CN IN MX
ESO: Engineering service Offering. RoE = Rest of Europe (excluding Germany)
Strategy& Sources: Strategy& analysis, Market Model 16Market radar
Forward-looking concepts with a completely new structure and new
functions are already in place
Example – Iconiq
Styling Trends
• Big screens, bigger,…..
• Under Body LED
• Exterior Lighting (in blue)
• Night View Sealing
• Useability in new
dimensions
Strategy& 17Market radar
Natural Interaction will be a real challenge for OEM, suppliers and
customers
Many technical
solutions upcoming
Gaining for customer
acceptance
Strategy& 18Market radar
New interior solutions will differentiate the new mobility
Clean, Robust,
Unlimited
Functionality
For
Shared Mobility
Strategy& 19Market radar EXAMPLE
New Technologies have to be rolled out with a strong strategic
orientation to visibility and functional impact
Need for action
• High feasibility • Painted metallic effects
̶ Technical solution / material • Plastic tailgate
Contribution to direction of impact
Painted metallic available in the market • Structured surfaces
effects
̶ Suppliers established • MuCell
Light
Morphing
Structured surfaces
̶ Process blueprint available
Durable surfaces Plastic tailgate
• Medium-term feasibility • Component integration
Component
Environment integration ̶ Basic solutions available • Stable surfaces
interaction
MuCell
̶ Concrete strategy • Stiffeners
Foliation outer skin
parts ̶ VE projects / supplier • Foiled bumpers
Stiffeners
Potential exploration
differentiators
+ Researchproject/ AP existing
• Long-term horizon • Environment interaction
̶ Development of concepts • Morphing
Material/ technology to Feasibility Material / technology
be strongly developed available and fields of application
Feasibility of metallic effects, tailgates and structured surfaces can be classified as short-term implementation.
Future topics can be implemented with a longer time horizon.
Strategy& 2002. Mobility and connected service heads-up Strategy& 21
Mobility and connected service heads-up
Mobility platforms beat traditional transportation offerings in choice,
convenience, and price
Mobility service platforms
• Aim at providing passenger
Driving/ Extended
transportation that is more convenient Booking and
transportation travel services
ticketing
and at a better price Billing and
than traditional offers through Trip planning
payment
more efficient asset use and/ or and routing Mobility service
better orchestration of
ecosystem partners platform
Insurance
Congrats Asset insurance
Travel insurance … Financing
Mapping and
Vehicle financing
traffic Vehicle leasing …
Mapping
Traffic monitoring … Infrastructure
and energy
Road/track provision
Charging and fueling
Energy management …
Freight/
logistics
Delivery services …
IT systems
Cloud services
Traditional OEMs Platform OS …
…
Vehicle assembly
Vehicle design
Connectivity Retail … Electric Media and
C2X communication Traditional drivetrain … retail
4G/5G … Cells/battery Infotainment
Vehicle technology vehicle parts production Consumer Location based
Hardware development Parts/components … Drivetrain
manufacturing …
electronics services …
Software development …
Voice assistance
Wearables …
Strategy& Abbreviations: OS – operating system 22Mobility and connected service heads-up
We see four Ways-to-play in the mobility market with different scope
Target
audience
Mobility Advisor Mobility-as-a-Service Provider
B2C
Navigation
Apps
Specialized Mobility Enabler Operating System Provider
B2B
narrow broad Offering scope
Strategy& 23Mobility and connected service heads-up
The value of MaaS is expected to grow at a combined 25% p.a. from
2017 to 2030 to reach ~USD 1,400 billion in the US/EU/China
Estimated MaaS CAGR 2017-30
market size
development, U.S. 250
(in USD billions) 170 +14%
47
Estimated MaaS
market size
451
development, E.U.
198 +25%
(in USD billions)
25
Estimated MaaS
market size 656
development, China
(in USD billions) 201 +33%
15
2017 2025 2030
Note: vehicle-based mobility as a service, incl. “shared autonomous” and “shared driver-driven”. based on Strategy& 2030 scenario
Strategy& Source: expert interviews, PwC Autofacts, Strategy& analysis 24Mobility and connected service heads-up EXAMPLE
The domain ADAS /AD is subject to most significant and most com-
plex technological change and a good example for distributed safety
High-level view on domain ADAS / AD – Distributed safety
Expected Impact
Other IoT
Infra- • New concepts for safety- and
Adjacencies
Cars
structure Map
safe path
fallback paths are required
• In-vehicle approach for
autonomous driving is highly
Cloud
Backend “Multiclouds” Cloud
integrated
safe path • Multiclouds enable bringing
adjacent safety
Outside
High
Trajectory
• Level 5 autonomous driving will
Reality
Resolution
Planning most likely be enabled by a cloud
Map
Total in- backend with AI
vehicle • Various designs and
safety
architectures will emerge
Digital
Indoor
Sensor Fusion
Reality
Drive Path
Actors • Safety transforms from
“Perception” “Maneuver”
Sensors “Localization” individual ECU to all functions and
Ultimate
Outdoor fallback layers and must be reflected in
Safety Domain safety organization
e.g. Ego Motion
Drivetrain
Dynamics
Strategy& 25Mobility and connected service heads-up
There are so many uncertain drive situations
… trap for
autonomous cars ;)
Strategy& 26Mobility and connected service heads-up
The value of connected services will grow at a combined 28% p.a.
from 2017-2030 to reach USD76 billion in the US/EU/China
Vehicle-centric connected services – Market potential
Estimated connected CAGR 2017-30
services market size 19.6
development, U.S. 10.3
(in USD billions) +23%
1.3
Estimated connected
services market size 16.7
development, E.U. 8.6
(in USD billions) +26%
0.8
Estimated connected
services market size 39.5
development, China 16.8
(in USD billions) +38%
0.6
2017 2025 2030
Note: based on Strategy& 2030 scenario
Strategy& Source: expert interviews, PwC Autofacts, Strategy& analysis 27Mobility and connected service heads-up
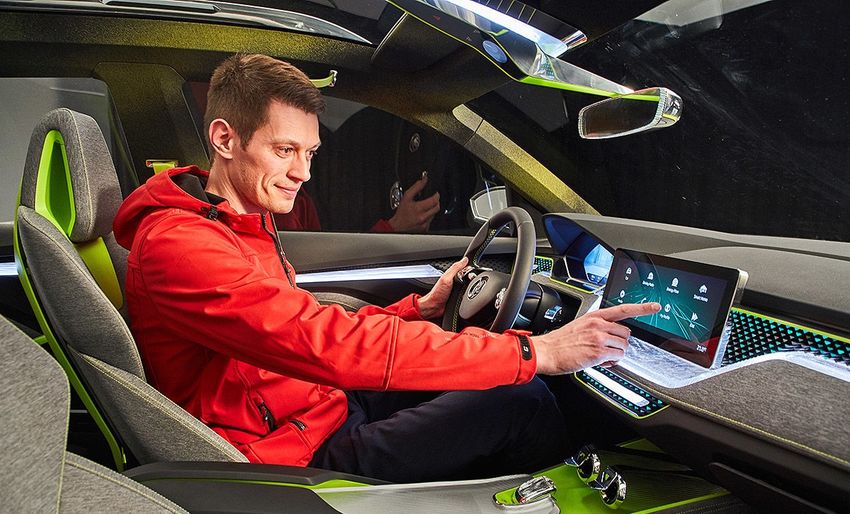
Fifth screen will be the new point of sales
New technologies
enable usability and
driver focus for
connected services
Strategy& 2803. Capabilities for the road ahead Strategy& 29
Capabilities for the road ahead

Winners will shift gears in 5 areas to meet future of mobility demands
New paradigms in automotive …

                                                                                 Service
                                                                                excellence
                                                     Direct                                                    Remote
                                                   customers                                                   updates

                                                                                                   Fit-for-
                                                           Immersive                              purpose
       … ask for gears to                                   channels                            technology

          be shifted
                                                                             Hyper-local
                                                                              footprint                       Ambidextrous
                                            Smart                                                             organization
                                           portfolio

                                     Digital                                                 Real-time
                                  touchpoints                     Rapid                    data & analytics              Etc.
                                                               development

Strategy&                                                                                                                       30
Capabilities for the road ahead
Operating models and workshare is shifting
New paradigms in automotive …
Service B2B
excellence B2C Remote
Direct Mobility Remote
MaaS
Services
updates
updates # trips/user
customers Mobility Advisor
5th Screen Ecosystem Services
Connected Digital Life Interface # active user
Services Autonomous Driving ServicesFit-for- per service
Immersive Vehicle Management purpose
Fit-for-
channels Insurance technology
Immersive
Financial purpose Policy
… ask for gears to
Services Financing renewal rate
channels technology
Parts
be shifted
Aftersales Parts net
Maintenance
Hyper-local margin
footprintLight Vehicle Ambidextrous
Average
Vehicles
Hyper-local organizationselling price
Commercial Vehicle
footprint Ambidextrous
Products/
Smart Services Purchase
Lease/
Rental
Sharing/
organizationKPI
Subscription Hailing
portfolio Real-time Examples
data
Vehicle Ownership Model & analytics
(B2C) Etc.
Traditional elements New elements
Digital Real-time
touchpoints Rapid data & analytics Etc.
Take away No. 1: The customer group is growing
development for ESO
Strategy& 31Capabilities for the road ahead
New working environment will lead to new organizations
New paradigms in automotive …
Service
excellence
Direct Remote
customers updates
Fit-for-
Immersive purpose
… ask for gears to channels technology
be shifted
Hyper-local
footprint Ambidextrous
Smart organization
portfolio
Digital Real-time
touchpoints Rapid data & analytics Etc.
Take away No. 2: Organizations will change, buying center
development of clients is transforming
Strategy& 32Capabilities for the road ahead
Engineering service providers have made high investments in elec-
tronic capability development; competition is intensifying as a result
Investments in "competence" development
Current investment focus for the development of ... will significantly intensify future competition in E/E
competencies in the area of E/E...
Engineering service provider investments Detailed product portfolio
Old engineering service
providers confirm E/E as Most market participants are
future field and focus of their high number of market low number of market active in PT, followed by CS
most recognized
skills
little recognized
skills
investment readiness partici-pants invest-
ments
partici-pants invest-
ment and E/E; high competitive
pressure as a result
Take away No. 3: The ESO market is already moving to advanced capabilities
Strategy& Source: Strategy& analysis, Bloomberg, annual reports, expert interviews, company websites, international media 33Capabilities for the road ahead
Testing and validation is an essential part of software development
and is often ~ 50% of the workload
Example: Autonomous/assisted drive test environment
Test environment
• Setup of a test environment for the
1 Database 3 HiL Farm 5 KPI Calculation
automatic validation of camera
Storage of video data
(>1 million km, 15
>60 reinjection
units
Calculation of >200
key performance
functions and performance tests by
PetaByte) indicators Tier-1 Supplier
• Approximately 50% of the
development costs were needed to
set up and run the test environment
2 Basic data
Selection and marking
4 MMS
Management
6 KPI Report
Automatic • Strong underestimation of the
of relevant scenes
and assessment of
system for
performing
generation of test
reports for each
complexity of the required IT
quality automated
tests
software version infrastructure and special test software
Subproject for the planning and execution of Establishment of complex databases and • Autonomous Drive requires one of the
software tests and the verification of controls for automatic testing of HiL, SiL and most complex test infrastructures
compliance requirements parallel to the MiL systems parallel to the software
software development development process
Take away No. 4: Testing is the key issue for sustainable products
Strategy& Source: Strategy& analysis, Tier-1 Supplier; KPI=Key Performance Indicator; HiL=Hardware in the Loop; SiL=Software in the Loop 34Capabilities for the road ahead
ESO will prepare for a holistic transformation to build the necessary
competencies and skills
Necessary skills • Organizations foster innovation, recognize customer needs, and
enable continuous after-sales improvement (on-air updates)
• Ensure best-in-class technology/differentiating skills (e. g.
architecture design, agile software development, testing, artificial
intelligence)
• Organizations work decentralized with central know-how in modern,
function-related areas
• Development organizations with strong profiles and conscious
location decisions (Best Cost Country vs. Best Capability Country) are
necessary
• Organizations plan to have sufficient for protection
• Cross-functional competency building and scalable project setups
R&D network
(e. g., campus concept)
• Organizations promote "Digital Change Culture" within the company
Realignment & Balancing Organization
Take away No. 5: Next level ESO transformation starts right now
Quelle: PwC Strategy& Analyse
Strategy& 35E F Strategy& 36
You can also read