Changes in EEG Brain Connectivity Caused by Short-Term BCI Neurofeedback-Rehabilitation Training: A Case Study
←
→
Page content transcription
If your browser does not render page correctly, please read the page content below
ORIGINAL RESEARCH
                                                                                                                                              published: 24 June 2021
                                                                                                                                     doi: 10.3389/fnhum.2021.627100

                                           Changes in EEG Brain Connectivity
                                           Caused by Short-Term BCI
                                           Neurofeedback-Rehabilitation
                                           Training: A Case Study
                                           Youhao Wang 1 , Jingjing Luo 1,2* , Yuzhu Guo 3 , Qiang Du 1 , Qiying Cheng 1 and
                                           Hongbo Wang 1*
                                           1
                                               Academy for Engineering and Technology, Fudan University (FAET), Shanghai, China, 2 Jihua Laboratory, Foshan, China,
                                           3
                                               School of Automation Science and Electrical Engineering, Beihang University, Beijing, China

                            Edited by:     Background: In combined with neurofeedback, Motor Imagery (MI) based Brain-
               Saugat Bhattacharyya,
                                           Computer Interface (BCI) has been an effective long-term treatment therapy for motor
    Ulster University, United Kingdom
                                           dysfunction caused by neurological injury in the brain (e.g., post-stroke hemiplegia).
                        Reviewed by:
                          Andrej Savic,    However, individual neurological differences have led to variability in the single sessions
        University of Belgrade, Serbia     of rehabilitation training. Research on the impact of short training sessions on
             Rodrigo Ezequiel Ramele,
     Instituto Tecnológico de Buenos       brain functioning patterns can help evaluate and standardize the short duration of
                       Aires, Argentina    rehabilitation training. In this paper, we use the electroencephalogram (EEG) signals to
                              Chen Liu,
                                           explore the brain patterns’ changes after a short-term rehabilitation training.
        Sun Yat-sen University, China
                 *Correspondence:          Materials and Methods: Using an EEG-BCI system, we analyzed the changes in
                      Hongbo Wang
                                           short-term (about 1-h) MI training data with and without visual feedback, respectively.
         wanghongbo@fudan.edu.cn
                        Jingjing Luo       We first examined the EEG signal’s Mu band power’s attenuation caused by Event-
           luojingjing@fudan.edu.cn        Related Desynchronization (ERD). Then we use the EEG’s Event-Related Potentials
                                           (ERP) features to construct brain networks and evaluate the training from multiple
                   Specialty section:
        This article was submitted to      perspectives: small-scale based on single nodes, medium-scale based on hemispheres,
          Brain-Computer Interfaces,       and large-scale based on all-brain.
                a section of the journal
    Frontiers in Human Neuroscience        Results: Results showed no significant difference in the ERD power attenuation
      Received: 08 November 2020           estimation in both groups. But the neurofeedback group’s ERP brain network
          Accepted: 31 May 2021
         Published: 24 June 2021
                                           parameters had substantial changes and trend properties compared to the group
                           Citation:
                                           without feedback. The neurofeedback group’s Mu band power’s attenuation increased
         Wang Y, Luo J, Guo Y, Du Q,       but not significantly (fitting line slope = 0.2, t-test value p > 0.05) after the short-term
        Cheng Q and Wang H (2021)          MI training, while the non-feedback group occurred an insignificant decrease (fitting line
  Changes in EEG Brain Connectivity
          Caused by Short-Term BCI         slope = −0.4, t-test value p > 0.05). In the ERP-based brain network analysis, the
        Neurofeedback-Rehabilitation       neurofeedback group’s network parameters were attenuated in all scales significantly (t-
             Training: A Case Study.
  Front. Hum. Neurosci. 15:627100.
                                           test value: p < 0.01); while the non-feedback group’s most network parameters didn’t
   doi: 10.3389/fnhum.2021.627100          change significantly (t-test value: p > 0.05).

Frontiers in Human Neuroscience | www.frontiersin.org                              1                                           June 2021 | Volume 15 | Article 627100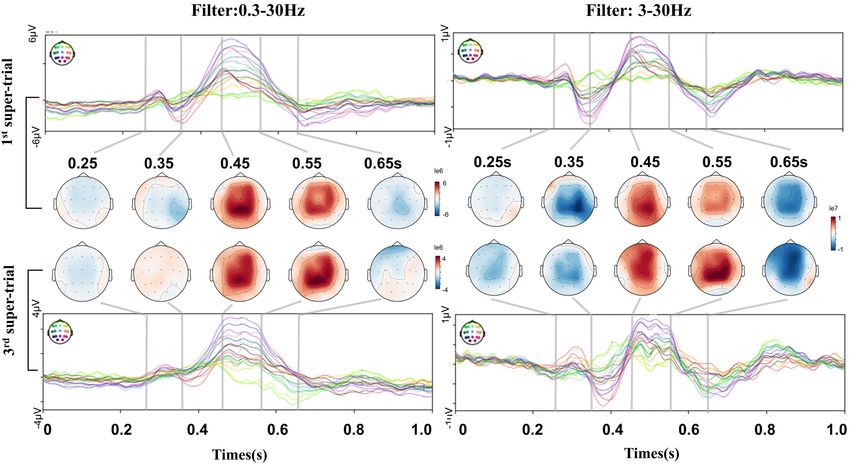
Wang et al.                                                                                                        Short-Term BCI Rehabilitation Study

                                          Conclusion: The MI-BCI training’s short-term effects does not show up in the ERD
                                          analysis significantly but can be detected by ERP-based network analysis significantly.
                                          Results inspire the efficient evaluation of short-term rehabilitation training and provide a
                                          useful reference for subsequent studies.
                                          Keywords: brain-computer interface, electroencephalogram, motor imagery, neurofeedback-rehabilitation,
                                          short-term training, event-related potentials, brain-network analysis

INTRODUCTION                                                                  (ERD/ERS) modulation during MI or movement execution
                                                                              (Pfurtscheller and Da Silva, 1999; Graimann et al., 2009; Nicolas-
Electroencephalograph (EEG)-based BCI systems is often applied                Alonso and Gomez-Gil, 2012) is proportional to the motor
in combination with motor imagery (MI) paradigm (Alkadhi                      function’s impaired level of patients (Matsumoto et al., 2010;
et al., 2005) for neurorehabilitation training (Kumar et al., 2016;           Rossiter et al., 2014; Naros and Gharabaghi, 2015; Soekadar et al.,
Baig et al., 2017; Oikonomou et al., 2017; Cheng et al., 2018),               2015). And it was found to be improved in the prolonged MI-
especially for enhancing motor recovery from brain injuries                   BCI rehabilitation (Rozelle and Budzynski, 1995; Pfurtscheller
such as stroke hemiplegia (Buch et al., 2008; Zimmermann-                     and Da Silva, 1999; Yoshida et al., 2016). The ERPs as EEG
Schlatter et al., 2008; Daly et al., 2009; Langhorne et al., 2009;            averages are direct amplitude changes in response to exhibited
Barclay et al., 2020). Neurofeedback (NF) is also commonly                    events (Kok, 1997). Both signals characterize as potential
applied in the BCI system. Thus cortical movement intention                   recovery measures, given that they may carry information about
can be transferred to physical activity or stimulation that feeds             underlying mechanisms of brain recovery. What’s more, the
back to the patient as a consequent response, forming a closed-               functional connectivity of brain networks is another strategy to
loop neural circuit (Yu et al., 2015; Zich et al., 2015; Sitaram              reveal changes in neural activity. For example, brain network
et al., 2017). Clinical studies have shown improvement in                     analysis based on fMRI has been used in clinical-pathological
neurorehabilitation using MI-BCI system with NF (Prasad et al.,               studies (Van Den Heuvel and Pol, 2010). Compared to the
2009; Caria et al., 2011; Shindo et al., 2011; Ramos-Murguialday              fMRI, the convenience and high temporal resolution of the
et al., 2013; Mukaino et al., 2014), and results are supported                EEG signal has led to an increasing number of scholars
by the underlying mechanisms of neural plasticity and brain                   using it to analyze the brain networks (Varela et al., 2001;
reorganization (Rozelle and Budzynski, 1995; Ang et al., 2014).               Wang et al., 2010; Faith et al., 2011; Sakkalis, 2011; Carter
   Neurorehabilitation assessment is essential for both patients              et al., 2012; Stam and Van Straaten, 2012; Belardinelli et al.,
as well as BCI system evaluation. Clinical assessments of physical            2017). Further studies use the EEG to apply graph theory
function restoration such as functional upper extremity test                  on the cortical network (Bullmore and Sporns, 2009; Fallani
(FMA), wolf motor function test (WMFT) are used as typical                    et al., 2013; Cheng et al., 2015) to measure brain changes by
methods (Rozelle and Budzynski, 1995; Mihara et al., 2013; Ang                rehabilitation training (Brown, 1970; de Vico Fallani et al., 2014;
et al., 2014; Li et al., 2014; Kim et al., 2016; Leeb et al., 2016).          Philips et al., 2017).
However, most physical assessments are only applicable after                      Studies mentioned above show that neural functional changes
substantial functional recovery with a long training period and               reflected by EEG signals are reliably correlated with changes
are the indirect measure of brain injury recovery. Researchers                in physical function. Still, the results are observed only after
have been studying brain imaging techniques such as functional                prolonged training, which may not be comprehensive enough.
Magnetic Resonance Imaging (fMRI) (Song et al., 2014; Young                   Thus, we consider the short-term effects of BCI on brain
et al., 2014), EEG (Daly and Wolpaw, 2008; Ono et al., 2015),                 activity. BCI training with feedback could alternately enhance
and electromyogram (EMG) (Rozelle and Budzynski, 1995;                        and suppress spontaneous rhythmic activity for short periods
Daly and Wolpaw, 2008). The goal is to find new assessment                    (Nowlis and Kamiya, 1970; Beatty et al., 1974; Sterman, 1974)
methods to analyze the brain directly and observe subtle changes              and leads to sustained changes in neural activity (Kaplan, 1975;
in neural reorganization. For BCI rehabilitation, the challenge               Wyler et al., 1976). Lin et al. found that short-term training
is to establish an EEG quantitative standard to evaluate the                  leading to significant neural activity changes in brain network
rehabilitation effect. MI as a typical BCI rehabilitation paradigm            by using functional connectivity of fMRI (Lin et al., 2017).
varies in its performance when applying different feedback                    In neurorehabilitation, Tsuchimoto et al. (2019) found that
strategies (Ahn and Jun, 2015; Marzbani et al., 2016; Renton et al.,          BCI training with neurofeedback can effect on patients’ EEG
2017). There are other factors such as induction paradigm or                  synchrony in the short term. We can infer that the short-term
training engagement, may affect potential brain recovery, thus                MI-BCI rehabilitation training variations based on EEG signals
make it more important to find direct and rapid measurements                  may also have the ability to interpret the rehabilitation process.
for BCI rehabilitation using EEG.                                             Evaluating those variations can help to portray the recovery
   For BCI EEG analysis, sensorimotor rhythm (SMR) of                         process more accurately. Yet, the variations are still unclear, and
neurophysiological oscillations and event-related potentials                  an efficient and rapid recovery assessment method of short-term
(ERPs) are commonly used as neurophysiological features. As a                 MI-BCI rehabilitation training has not been proposed. Using the
particular example of SMR, desynchronization/synchronization                  EEG to study the state of neural signal expression in a short

Frontiers in Human Neuroscience | www.frontiersin.org                     2                                     June 2021 | Volume 15 | Article 627100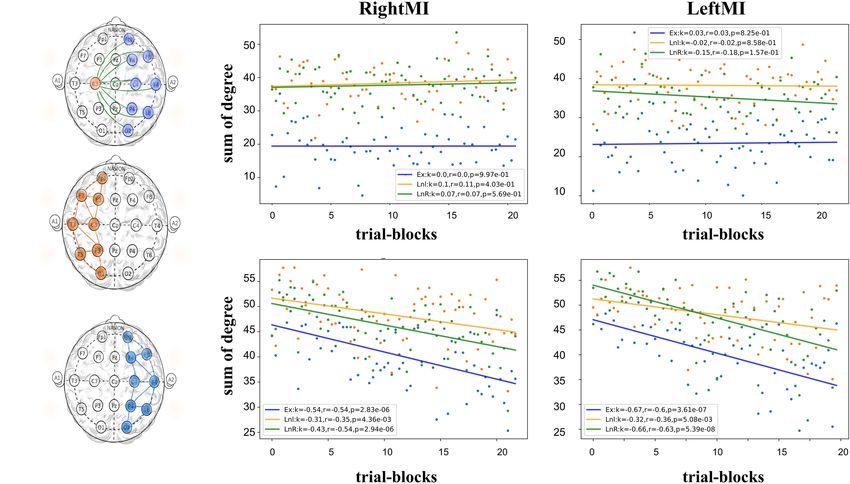
Wang et al.                                                                                                                         Short-Term BCI Rehabilitation Study

time may provide a new approach to measuring the effects of                            pause phase had a duration of 1.5–2.5 s randomly, with an average
rehabilitation training.                                                               of 2 s. During the action phase, the screen showed a GUI interface
   Our study investigated how the short-term MI-BCI training                           with a red square, to instruct the participant to perform the
affects the human brain and uses EEG signals to evaluate it. We                        corresponding task for 1 s (Figure 1A). The red square upon the
used EEG’s Mu band power attenuation to analyze the impact of                          left- or right-handed cartoon image indicated the grasping MI
short-term rehabilitation training and use network methods to                          task, and upon the middle circle indicated a “hold” task with no
analyze the effectiveness of exercise on various network scales. In                    imagery (Figure 1A). The experiment was carried out on 3 days
section II, the experimental data are presented, and the analysis                      at irregular intervals. The four subjects of non-feedback paradigm
methods are described. Section III presents the experimental                           were labeled as A, C, D, E in this article.
results of the short-term ERD modulation and the ERP-based
cortical network, respectively. Discussion and conclusions are                         Feedback Data
presented at the end.                                                                  The feedback paradigm had the same overall steps as the non-
                                                                                       feedback paradigm, however subjects were asked to control
                                                                                       actions of a 3D virtual robotic arm. During the action phase,
MATERIALS AND METHODS                                                                  the screen showed a virtual robotic-arm bellow the task
                                                                                       icons. Depending on the real-time decoding analysis of Mu-
Data Acquisition                                                                       suppression, robotic arm appeared to move left/right or stay
We used left- and right-handed motor imagery data from a                               “hold” (Figure 1B). The robotic-arm moved as the feedback of an
publicly available dataset (Kaya et al., 2018). All 5 subjects                         imagery success. The first session followed the same steps as in the
underwent 3 days of MI-BCI training were selected, of which                            non-feedback paradigm. In second and third sessions, subject’s
four subjects with no visual feedback and one subject with                             imagery was actively performed, and the movement of the virtual
visual feedback. In all experiments, an EEG distribution with 19                       robotic arm was determined by subjects themselves initially. It
electrodes in the International Standard 10–20 system was used.                        was then set as specific task sequences, e.g., to “move two units
Data was acquired using a medical-grade EEG-1200 recording                             to the left” or to “move 1 unit to the left and then three units
system with a JE-921A acquisition cassette (Nihon Kohden,                              to the right.” We labeled the feedback subject as subject B later
Japan) and band-filtered at 0.53∼70 Hz at the recording phase.                         in the article. We arranged EEG data of 3 days in parallel for
Participants were seated in a chair and observed a computer                            statistical analysis for each subject. In each day, left- or right-hand
screen about 200 cm in front of the BCI system. A typical                              imagery task trials were used with all “hold” trials removed for
rehabilitation training of left/right hand MI was applied as                           EEG analysis in this article.
the experiment paradigm. Two formats of experiments were
conducted, a “non-feedback” mode as well as a “feedback” mode,
introduced as follows.                                                                 Mu Suppression Score
                                                                                       ERD/ERS in MI task is calculated by the power spectral
Non-feedback Data                                                                      density(PSD) of EEG signals in the personalized frequency range,
The whole process lasted 51.5 min, assembled from three 15-min                         typically at 8–13 Hz known as the Mu band (Kuhlman, 1978;
sessions, with a 2.5-min break to initialize the system before the                     Pfurtscheller and Da Silva, 1999). In the ERD phenomenon,
session start, followed by a 2-min break between the two sessions                      the corresponding region of primary motor cortex (M1) in
for the subject to relax (Figure 1C). Each session contained 300                       the hemisphere contralateral to the movement is attenuated.
trials in total, each consisting of pause and action phases. The                       In this study, the C3 and C4 electrode positions from the 10

  FIGURE 1 | Experimental Paradigm. (A) The experimental paradigm of the data is divided into three 15-min sessions, each containing 300 BCI trials, with an average
  duration of 3 s per trial, including about 2 s of pause and 1 s of the action. (B) Icons seen by the subjects during the non-feedback experiment. Subjects follow the
  instructions in the red box for the MI task. (C) Computer instructions for Feedback experiment. Subject are able to move the robotic-arms as feedback in the MI-task.

Frontiers in Human Neuroscience | www.frontiersin.org                              3                                             June 2021 | Volume 15 | Article 627100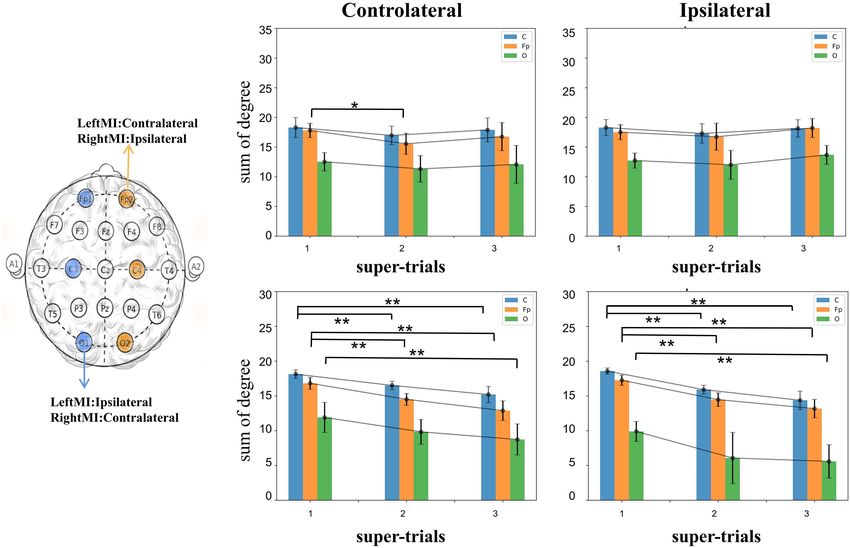
Wang et al.                                                                                                        Short-Term BCI Rehabilitation Study

to 20 international system are located close to the M1 region.              amplitude characteristics. The Pearson correlation coefficient was
Therefore, for the right-hand MI, we used the C3 channel as the             calculated as follows:
contralateral side, and its symmetric electrode C4 as the ipsilateral
                                                                                           E[(X − µX )(Y − µY )]
side. The same applies to the left-hand MI.                                          ρ=
   The quantification of ERD/ERS can be calculated using the                                      σXσY
classical approach called Mu-suppression. The obtained EEG                                           E[(X − µX )(Y − µY )]
                                                                                           = qP                    qP                             (2)
signal is first converted to the frequency domain by Fourier                                     n
                                                                                                     (X     µ   )    n
                                                                                                                     i=1 (Yi − µY )
                                                                                                          −      2                 2
                                                                                                 i=1    i     X
transform. Then, we used multi-taper method (Thomson, 1982)
to calculate the PSD, selected frequency range with Mu-                     where X and Y represent the calculated signal values for trial-
suppression for individual experiment to derive the band power.             block ERPs of two channels. µX and µY represent the mean of
Change of contralateral Mu-band energy between the task state               X and Y. σX and σY represent the standard deviation of X and
and the resting state was evaluated, using the most recent 1-s              Y. The formula calculates the covariance ratio between the two
before task initiation representing resting state (Thomson, 1982;           channels to the product of two standard deviations.
Oberman et al., 2008; Braadbaart et al., 2013). The following
formula gives the Mu-suppression score (MuSC):                              Network Indicators
                                                                            Graph theory plays a crucial role in network analysis. Each EEG
                                MuPbo − MuPnbo
                 MuSC = −                      ∗ 100             (1)        channel represents a single node in graph. Degrees derived from
                                   MuPnbo                                   Functional Connectivity estimates between nodes then form a
where MuPbo is the band power of the task state, and MuPnbo is              graph. Since MI-action focuses on C3 and C4 nodes’ expression,
the band power of the resting state.                                        we consider the direct calculation of the change in C3 and C4
   As human brain is characterized by inter-individual variability          nodes’ degree as the task proceeds.
and rapid dynamic changes, we applied a sliding frequency                                                     X
window with a size of 3 Hz (0.67 overlaps) to precisely                                              Ei (G) =     dij                    (3)
select the subject-specific Mu-band boundaries. The most                                                       j6=i∈G

suppressed window comparing the MI state (0∼1 s) against                    where i is the node of interest, G is the whole brain connectivity
the corresponding resting state (−1∼0 s) was chosen as MI-                  map. J is other nodes and Ei (G) is the sum of the connection
related EEG oscillations for each subject each day. The screening           weights of the node of the claim. All other nodes within the region
results for subject-specific Mu-band boundaries are presented in            were calculated. We also performed the same calculation to O1
Supplementary Table 1.                                                      and P1 nodes’ degrees far away from the M1 region, used as a
                                                                            comparison study. Also, the summation of degrees for all nodes
Network Analysis                                                            in the region provides a complete picture of the corresponding
Functional Connectivity Estimation                                          brain regions’ overall neural activity:
Neuronal oscillations are implicit in the underlying coordination                                                 X
mechanisms of the brain (Singer, 1999; Varela et al., 2001). The                                   Eregion (R) =      dij                    (4)
channels with EEG signal contain a collection of oscillations                                                    j6=i∈R
of regional neurons. The synchronization of oscillations
                                                                            Where Eregion refers to the region of interest, which can be the
between channels may indicate that the brain has information
                                                                            left or right hemisphere. R is the set of nodes within the brain
flow between regions (Womelsdorf et al., 2007). Functional                  hemisphere, and j is the other nodes. This equation calculates
Connectivity is a method for assessing the synchronization of               the sum of the weights of all weighted edges in the region.
oscillating signals from channel to channel. The degree between             This calculation allows us to estimate the overall activity of the
channels indicates how much information is exchanged.                       nodes in the region.
    ERPs is any stereotyped electrophysiological response to a                  The clustering coefficient (Gonzalez-Lima and Mclntosh,
stimulus, which have excellent temporal resolution. Considering             1994; Latora and Marchiori, 2001) is used in this analysis, aiming
the immediacy of the short-term changes targeted in this study,             to explore the whole brain’s variation. Clustering coefficients
we chose ERPs as the basis for brain network calculations.                  are divided into three calculation methods: global, local, and
In the scenario of MI, ERPs are generally obtained by trial                 average. The global clustering coefficient is used to explore the
averaging. Band-pass filtering is commonly used in some EEG                 variation of the whole brain. The clustering coefficient calculation
studies for data preprocessing and to investigate the extraction            requires that the graph be binary and coherent. Thresholds
and amplification of signals of interest by different band-                 should be properly chosen to binarize the calculated connectivity
pass filter bands, such as Movement-related cortical potentials             in the brain network analysis. To ensure the connectivity of the
(MRCP,0.05–6 Hz). In this study, We made preliminary band-                  graph, we use the threshold value of 0.6 in this experiment. The
pass pre-process for different frequency bands that may be                  coefficient is obtained by dividing the number of closed-loop
triggered by MI, then the EEG signal was averaged over every                ternary groups by the number of all ternary groups in the graph,
20 trials as “trial-block” to obtain a pronounced ERP curve.                calculated as follows:
Pearson’s correlation coefficient was used for the functional                                                   3 × G1
connectivity estimation, directly expressing the correlation of                                 Ctotal (G) =                                  (5)
                                                                                                             3 × G1 + G3

Frontiers in Human Neuroscience | www.frontiersin.org                   4                                      June 2021 | Volume 15 | Article 627100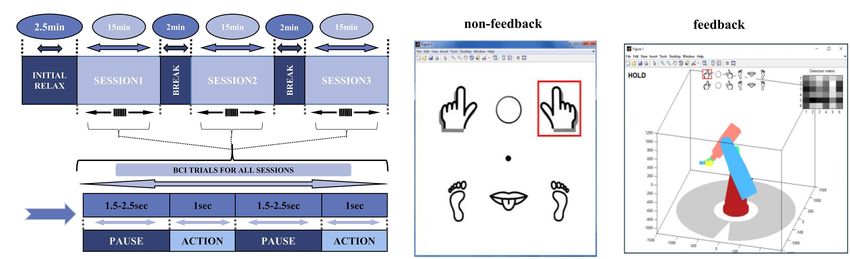
Wang et al.                                                                                                                             Short-Term BCI Rehabilitation Study

where G1 represents the number of closed-loop triads in the                               was to design an appropriate EEG preprocessing filter before
graph (three nodes connected), and G∧ means that there are                                construction the ERP functional network. We study the three
only two edges with weight one between the three nodes. In this                           sequential sessions with MI training of both paradigms and
experiment, we calculate the changes of the clustering coefficients                       label the first to third sessions in the experimental sequence
of the whole brain and the hemispheres overtime to get a                                  as super-trial 1–3, respectively. Results showed that both the
global picture of the brain network’s changes in the short-term                           2nd and 3rd super-trial of the 3-day data of the feedback
for the MI task.                                                                          group in 3–6 Hz had significant decrease compared to the
                                                                                          1st super-trial (p = 2e-3, 7e-3 for day 1 respectively, p = 2e-
                                                                                          3, for day 2, p = 6.5e-4, 5e-5 for day 3, respectivley) (see
RESULTS                                                                                   Table 1). Some other frequency band above 5 Hz also showed
                                                                                          a partially significant trend. However, signal in the 0.53∼4
Change of ERD MuSC                                                                        Hz band of the low frequency component did not show
We applied Mu-band boundary selection for each individual and                             differences during on-going training sessions. In contrast,
results were within alpha and lower-beta band (5–20 Hz, filtering                         non-feedback subjects showed subtle increase at 0.53∼4 Hz,
results listed in the Supplementary Material for reference).                              while no trend showing in other frequency ranges. Results
MuSC was calculated from the 636 non-feedback subject A and                               indicated a consistent change along the short-term training for
616 feedback subject B trials then averaged for each consecutive                          the feedback group.
20 trials constructing “trial blocks” results. The MuSC of the non-                          To investigate the detailed dynamic change along the short-
feedback subject A tends to be downwards with the fitting line                            term training, we compared 1st and 3rd super-trial ERPs of
slope of −0.4 (Figure 2A), by contrast, the feedback B’s MuSC                             the feedback subject B, at both 0.3–30 Hz and 3–30 Hz
rises with the fitting line slope of 0.2 (Figure 2B), similar to the                      frequency bands. In the case of 0.3–30 Hz filtering (Figure 3A),
result in previous studies (Shindo et al., 2011; Yoshida et al.,                          the ERP dynamic processes did not show significant changes,
2016). However, there is no significant difference between the two                        with topographic maps appearing similarly patterns at the MI
experiments due to the large variance. Changes in ERD’s MuSC                              task. However, ERP dynamic changes were revealed under
can be observed in short-term MI experiments with feedback, but                           the 3–30 Hz filtering (Figure 3B), such as a strengthening
the trend of the data is subtle and difficult to use to measure the                       of the negative potential at 0.35 s, of the following positive
effect of short-term training. Four non-feedback subjects showed                          potential at 0.55 s, and the negative potential at 0.65 s. ERP
consistent result of ERD/ERS, thus we took non-feedback subject                           features at 3∼30 Hz presented strengthened deflections from
A as the typical subject to show the comparisons and analysis                             the beginning of the training session to the end. By combining
in the following.                                                                         results in Table 1, result indicated the EEG low frequency
                                                                                          component containing MI brain activities, as consistent with
Change of ERP Network                                                                     (Ramos-Murguialday and Birbaumer, 2015; Schwarz et al., 2019),
We used different frequency bands (0.53–4 Hz, 3–6 Hz, 5–                                  and it contained information of short-term variations at the
10 Hz, 8–16 Hz, and 15–30 Hz) to apply an initial inspection                              feedback paradigm. We choose a 3∼30 Hz band-pass filter to
of degree-of-nodes for four non-feedback subjects (A,C,D,E)                               capture EEG characteristics as interested before average and
and 3-day data separately of the feedback subject B. This                                 further analysis.

  FIGURE 2 | The MuSC of subject A and B. (A) the MuSC for non-feedback subject A (3-day experimental data are synchronized and averaged according to a set of
  20 trials). The red line is a linear fit, where the slope of line A is negative (slope = −0.4). (B) the MuSC for Subject B, the slope of line B is positive (slope = 0.2).

Frontiers in Human Neuroscience | www.frontiersin.org                                 5                                              June 2021 | Volume 15 | Article 627100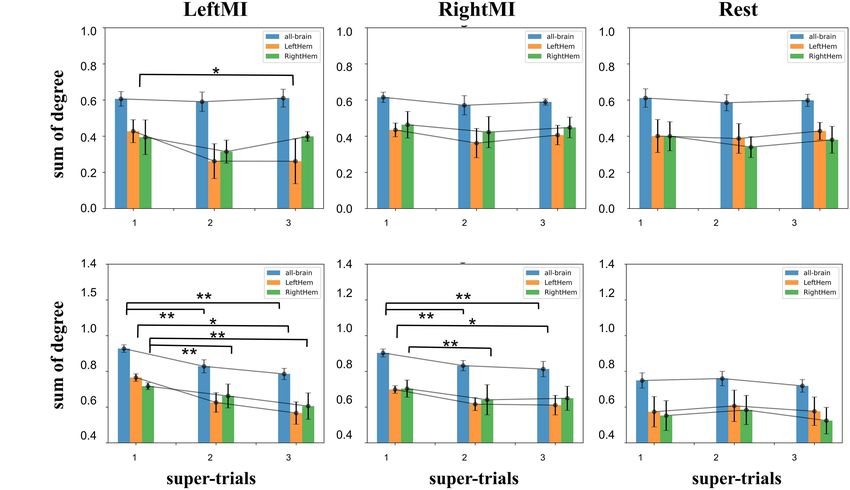
Wang et al. Short-Term BCI Rehabilitation Study
19.6 ± 2.2
17.4 ± 1.6
19.0 ± 2.6
15.3 ± 1.1
15.7 ± 1.4
14.9 ± 2.1
16.1 ± 1.4
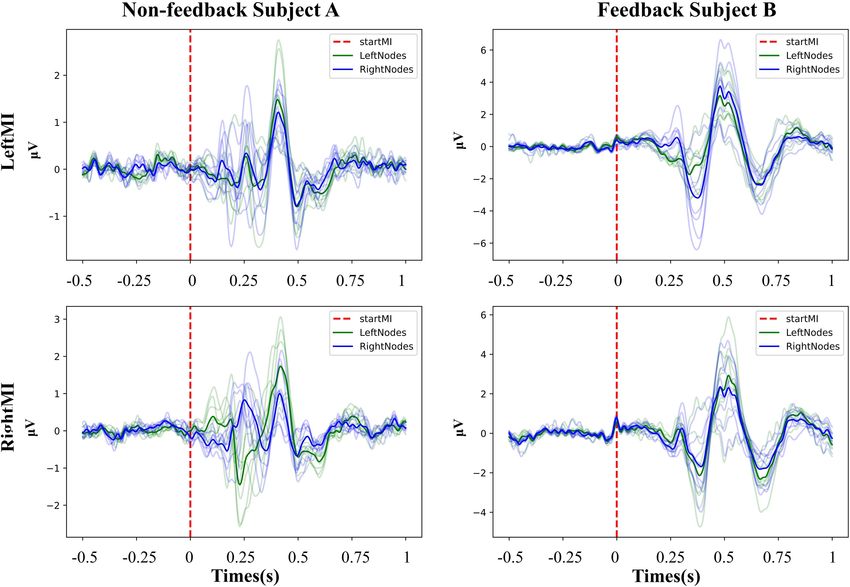
As event-related responses apart from Mu-suppression, we
analyzed ERPs of left or right MI task for non-feedback subject
3
A and feedback subject B. It was derived from averaging 20
trials at −0.5∼1 s filtered at 3–30 Hz for of all EEG channels.
20.9 ± 1.1++
15∼30 Hz
18.6 ± 2.1
16.8 ± 2.8
14.8 ± 1.1
16.0 ± 1.6
14.4 ± 1.3
17.1 ± 1.3
The ERP responses initiated after the start of the MI task. The
*Decreasing with p < 0.05; **: decreasing with p < 0.01.,+: increasing with p < 0.05; ++: increasing with p < 0.01. The bold values means the significant change of the data (p < 0.05 or p < 0.01).
overall ERP performance of the feedback (Figure 4A) and non-
2 feedback subject (Figure 4B) were stable for left- and right-
20.2 ± 2.2
handed MI, with slightly different ERP performance for different
16.3 ± 2.7
18.5 ± 1.6
14.8 ± 1.7
16.7 ± 1.3
14.3 ± 0.9
16.3 ± 1.1
side-channels for left- and right-handed MI.
Sess1
Degree of Nodes
Single node degrees were analyzed for non-feedback subject
20.3 ± 3.1
20.6 ± 2.4
21.7 ± 2.7
16.6 ± 1.5
20.8 ± 0.8
17.1 ± 1.5
17.5 ± 1.2
A and feedback subject B, respectively. Figure 5A shows the
3
analyzed nodes. The contralateral analysis target nodes for left-
handed motion include C4, O2, Fp2, and right-handed C3, O1,
22.1 ± 1.9*
19.2 ± 2.3
21.9 ± 2.6
16.0 ± 1.9
21.4 ± 1.9
16.7 ± 2.3
16.7 ± 1.6
Fp1, and the opposite nodes for ipsilateral motion. The subject
8∼16 Hz
experiments were divided into three groups according to the
2
order in which the sessions were performed. The trials for MI
task execution were selected from each group, averaging the
19.5 ± 2.7
19.5 ± 4.2
23.7 ± 2.2
15.0 ± 1.7
21.9 ± 1.4
17.7 ± 1.8
17.7 ± 1.2
20 original trials to containing ERP features to calculate the
Sess1
network’s connectivity. In Figure 5B, the connectivity histogram
of subject A’s ipsilateral and contralateral sides Fp node’s
contralateral side is significantly different (t-test value p = 0.01)
22.2 ± 2.2*
21.9 ± 4.1
20.2 ± 3.0
18.7 ± 2.5
26.1 ± 1.0
20.6 ± 1.1
15.7 ± 2.1
between the first and third super-trials, while the other nodes
3
not significantly different. In Figure 5C for subject B, the second
and third super-trials of the C and Fp nodes are significantly
24.3 ± 1.9
21.7 ± 3.4
23.2 ± 2.2
18.5 ± 1.7
25.7 ± 1.4
20.0 ± 1.8
14.5 ± 1.5
5∼10 Hz
different from the first in both ipsilateral and contralateral (t-
test value p = 2.3e-5, 1.2e-5 for C; p = 2.1e-5,3.7e-6for Fp in
2
contralateral and p = 1.5e-8, 2.5e-6 for C; p = 3.2e-6,1.2e-6 for Fp
in ipsilateral); in addition, the O nodes’ contralateral experiments
23.6 ± 2.8
21.4 ± 3.4
25.0 ± 2.3
17.7 ± 1.2
26.1 ± 1.0
21.6 ± 1.5
16.0 ± 1.8
Sess1
were significantly different between the first and third super-trials
(t-test value p = 0.6e-2 and 0.3e-3 in contralateral and ipsilateral).
Different significant downward trends can be observed in subject
27.1 ± 3.0**
25.8 ± 1.5**
A and subject B. Thus, we hypothesize that feedback BCI training
25.7 ± 2.6
18.8 ± 2.3
25.4 ± 1.1
22.7 ± 2.0
22.5 ± 1.1
leads to decreased node degrees in the ERP brain network.
3
Degree of Region
28.1 ± 1.4**
27.1 ± 1.4**
27.6 ± 1.4*
In this part, we calculated the sum of the connectivity in the left
17.5 ± 2.8
25.2 ± 2.1
23.3 ± 1.3
23.7 ± 2.1
3∼6 Hz
TABLE 1 | Degree-of-nodes for all subjects in different frequency bands.
and right hemispheres as LnL and LnR, and connectivity between
2
two sides (excluding the medial node) as EX (Figure 6A). Then
used linear regression to fit a straight line of scatter. In Figure 6B
30.4 ± 0.6
29.0 ± 0.9
30.5 ± 0.9
20.0 ± 1.9
25.9 ± 1.7
24.4 ± 1.6
22.1 ± 2.3
for subject A, The slopes of the three fitted lines all approach 0 in
Sess1
both left-handed and right-handed MI. In Subject B’s feedback
experiment (Figure 6C), the slopes of all fitted lines were
negative, indicating a decrease in regional connectivity. During
29.2 ± 1.0**
28.2 ± 1.2+
28.1 ± 0.9+
22.4 ± 1.5+
28.5 ± 1.9
29.7 ± 1.7
17.4 ± 3.6
left-handed MI, the slope of LnR on the opposite side was smaller
3
than that of LnL on the same side (Ex fitting line slope = −0.67,
Lnl fitting line slope = −0.32, LnR fitting line slope = −0.66),
0.53∼4 Hz
whereas this phenomenon does not appear, the fitted lines for
28.3 ± 2.6
30.3 ± 0.6
29.6 ± 1.9
16.3 ± 2.5
27.0 ± 1.3
28.5 ± 1.1
21.6 ± 4.1
right-handed MI are (Ex fitting line slope = −0.53, Lnl fitting
2
line slope = −0.31, LnR fitting line slope = −0.42). Figure 5
gives a clear contrast between the regional degree summation.
29.3 ± 0.8
29.7 ± 0.9
30.6 ± 0.6
18.8 ± 3.1
27.1 ± 1.2
26.9 ± 1.7
20.7 ± 2.6
The feedback experiments will have an overall downward trend,
Sess1
and its contralateral downward trend is more pronounced in left
MI. The slopes of LnR in their leftMI are smaller than LnL both in
subjects A and B, which is presumed to be related to the ERD/ERS
Freq
Subj
B1
B2
B3
features of the EEG.
C
D
A
E
Frontiers in Human Neuroscience | www.frontiersin.org 6 June 2021 | Volume 15 | Article 627100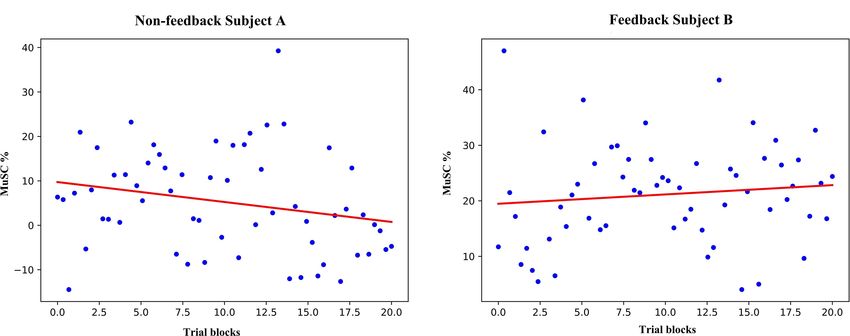
Wang et al.                                                                                                                         Short-Term BCI Rehabilitation Study

  FIGURE 3 | ERP and topographic comparisons between the 1st and 3rd super-trials of the short-term BCI training process. This comparison was for feedback
  subject B. Each super-trials containing consecutive 100 non-hold trials. (A) Filter with 0.3–30 Hz. No significant change between the 1st and 3rd super-trials. Some
  drift changes were present in the prefrontal channels. (B) Filter with 3–30 Hz. The 1st and 3rd topographic maps show dynamic differences. N-potential attenuation
  at 0.35 s, P-potential enhanced at 0.55 s, then N-potential enhanced at 0.65 s.

  FIGURE 4 | The overall ERP performance of the feedback and non-feedback subject. (A) Non-feedback subject A, the potential graph of each channel during left-
  and right- handed MI training (−0.5∼1 s). (B) Feedback subject B, the potential graph of each channel during left- and right- handed MI training (−0.5∼1 s). Both
  subjects present clear ERP curves, and the ERP curves of the left channels and the right channels show slight differences at different MI task.

Frontiers in Human Neuroscience | www.frontiersin.org                              7                                             June 2021 | Volume 15 | Article 627100
Wang et al.                                                                                                                               Short-Term BCI Rehabilitation Study

  FIGURE 5 | (A) A schematic representation of the one-node degree analysis. (B) Single node degree after averaging the three non-feedback trials of subject A, the
  effect tends to be smooth, where the contralateral Fp node degree shows a significant change of 1–2 super-trial (t-test value p < 0.05). (C) The single node degree
  of subject B, both the ipsilateral and contralateral single nodes have a decrease relative to the initial value (t-test value C’s ipsilateral:s = 5.60, p < 0.01; s = 2.97,
  p < 0.01, C’s contralateral: s = 10.40, p < 0.01, s = 3.13, p < 0.01, Fp’s ipsilateral: s = 5.69, p < 0.01, s = −7.09, p < 0.01, Fp’s contralateral: s = 6.85, p < 0.01,
  s = −8.08, p < 0.01). The symbols * and ** represent the mark of significant and very significant changed data.

  FIGURE 6 | (A) A schematic representation of the nodes included in the three computational methods, from top to bottom, Ex, LnL, and LnR. (B) Scatter plot of the
  brain network indicators in the MI task state of Subject A and calculates the linear regression fitted straight lines for the three scatter types. Among them, B-figure left
  EX,LNL,LNR; (C) Scatter plots of network indicators in subject B’s feedback experimental data, and the slopes of all straight lines fitted are negative, (B,C) indicate
  the gradients of LnR in their leftMI are all less than LnL.

Frontiers in Human Neuroscience | www.frontiersin.org                                  8                                              June 2021 | Volume 15 | Article 627100
Wang et al.                                                                                                                              Short-Term BCI Rehabilitation Study

Clustering of Network                                                                         Firstly we analyzed the Mu band’s energy attenuation on
Clustering coefficients were calculated for the whole brain, left                         the contralateral side. The result showed ERD changed with an
hemisphere, and right hemisphere. The differences between                                 increasing trend at the feedback group. This was consistent with
the task and resting states were calculated separately. Among                             studies of rehabilitation in Shindo et al. (2011) and Yoshida
the three calculations of subject A (Figure 7A), there was a                              et al. (2016), suggesting ERD strengthened for successful BCI
downward trend and significant difference (t-test value p = 0.04)                         training. On the other hand, the non-feedback group presented
between the 1–3 super-trials of left-handed MI in the right                               little change, and the change from 1-h feedback training was
hemisphere. Figure 7B for Subject B shows a significant                                   of no statistical significance, which was different from the
downward trend for left-handed MI’s both all-brain and right                              long-term rehabilitation training. Therefore, characteristics of
hemisphere (p = 1.3e-3 and 0.2e-3 for all-brain), and the                                 cortical motor activities need to be further investigated, to
left hemisphere was significantly different only in first-to-third                        introduce new assessment tools to quantify changes with MI-BCI
experimental comparisons (t-test value p = 0.04); in right-                               training of short-terms.
handed MI, all-brain, left and right hemisphere had significant                               We then studied ERPs of MI tasks in this study. In the
decreases (all:t-test value p = 4.3e-3, 6.9e-3, left: t-test value                        MI analysis of ERP, MRCP is often used. the ERP analyzed
p = 0.04,right:p = 4.3e-3) while there are no significant changes                         in this paper intersects with MRCP but is not identical in
in the rest state. The results show that feedback experiments                             definition. The low frequency (below 6 Hz or so) negative shifts
altered the task-state clustering coefficient to decay and more                           in the EEG signal representing brain activity changes related
extensive in the contralateral sides. Training did not affect the                         to movement. In our investigation, the negative deflection of
resting state significantly.                                                              MRCP appeared relatively obvious only after filtering above
                                                                                          3 Hz. The corresponding ERP dynamic presented visible
                                                                                          changes along the MI training process as well. The EEG
DISCUSSION                                                                                signal band-pass filtered at 3–6 Hz contains information of
                                                                                          significant changes in relation to short-term training. On
In the present study, we focused on using EEG signals to                                  the other hand, signals below 3 Hz had relatively large
investigate what impact MI-BCI training can have on the brain                             amplitude but the response was dynamically consistent during
in short-term. We applied controlled research using MI-BCI                                the training process. This may obscure functional changes
training with/without visual feedback.                                                    of great interest to us. Previous studies have mentioned

  FIGURE 7 | (A) Clustering coefficients histograms of non-feedback subject A, left, middle and right plots were calculated for left-handed MI, right-handed MI, and
  rest condition, a significant decrease in the right hemispheric region value in 1–2 trials during left-handed MI (t-test value p < 0.05), rest condition The all-brain
  indicator was also significantly different (t-test value p < 0.05); (B) clustering coefficients of feedback subject B, there was an extremely significant downward trend in
  the left-handed MI for both the all-brain and right hemisphere indicators 1–2, 1–3 (t-test value p < 0.01), left hemisphere had an extremely significant difference only
  between 1 and 3 experimental comparisons (t-test value p < 0.05). In rightMI, all-brain had a significant decrease between 1 and 2, 1 and 3 super-trials (p < 0.01).
  Left hemisphere and right hemisphere indicators have significant changed between 1 and 3 super-trials (p < 0.05) and 1–2 super-trials (p < 0.01), respectively. The
  symbols * and ** represent the mark of significant and very significant changed data.

Frontiers in Human Neuroscience | www.frontiersin.org                                 9                                              June 2021 | Volume 15 | Article 627100
Wang et al. Short-Term BCI Rehabilitation Study
that there are discriminable information for MI decoding in to be applied to short-term training value assessment. Unlike
Bands at 1∼6 Hz of ERP (Ramos-Murguialday and Birbaumer, other classical brain network analysis methods such as fMRI
2015; Korik et al., 2018; Schwarz et al., 2019). For example, (Van Den Heuvel and Pol, 2010), EEG signals have unique
Ramos et al. used filtering in the 3∼45 Hz for a BCI advantages—high temporal and spatial resolution, which can be
motor task analysis. Korik et al. studied ERP at 4∼8 Hz for analyzed more quickly and easily. It makes a good pavement
decoding imagined 3D hand movement in EEG (Korik et al., for the short-term MI-BCI rehabilitation assessment. This paper
2018). Marshall et al. investigated ERP with 3 Hz high-pass differs from the conventional brain network construction of
filter for infants’ auditory (Marshall et al., 2009). Thus we EEG (Friston, 2011). It adopts an EEG signal combination
applied preprocess filtering with low cut-off frequency at 3 processing method with ERP characteristics, which can reduce
Hz to satisfy our analysis requirements. As we choose 3–30 EEG signals’ instability and reflect signals’ event characteristics
Hz of EEG containing MI brain activities for investigation more effectively.
functional changes during short-term training, it contains However, there are many limitations for improvement in this
ERD range as well. study. For example, the experimental sample data is insufficient.
Different behavioral patterns have different brain network The ERP construction method used for network construction has
activations (Gonzalez-Lima and Mclntosh, 1994; Büchel and not been tried in non-MI rehabilitation training. The present
Friston, 1997; Büchel and Friston, 2000; Horwitz et al., 2000; analysis is based on the visual feedback training of healthy
Taylor et al., 2000). Functional connectivity has been defined subjects. The sample data can be improved in many aspects: for
as ’neural context’ (McIntosh, 1999, 2000; McIntosh et al., example, changing healthy subjects to patients or using different
2001). By calculating functional connectivity, we can further feedback methods; it is also possible to make a comparison
apply graph theory to analyze brain networks. Graph theory, between short-term training and long-term training indicators
which describes the brain as a single interconnected network and integrate the processes of existing indicators proposed in this
(Bullmore and Sporns, 2009; Fallani et al., 2013; Cheng et al., paper to form a perfect evaluation method to quantify the goals
2015), provides a theoretical framework with the potential of rehabilitation training better.
ability to characterize the behavior of complex brain systems
and can reveal important information about the local and
global organization of functional brain networks. Applying the CONCLUSION
methodology described above, this paper validates the changes
In summary, this paper is a preliminary attempt in the field of
in brain networks brought about by short-term MI training
EEG brain network-based rehabilitation assessment. We applied
of these two neural contexts with and without feedback and
Mu band power’s attenuation and ERP-based brain network to
their differences. For example, in Figure 5, we see that the
analyze the EEG changes during short-term MI task. We found
feedback experimental set of individual nodes of this brain
significant changes in brain connectivity, that the functional
network (i.e., with visual feedback) shows a significant downward
network topology coefficients of feedback subject showed a
trend in degree summation. We speculate that this trend stems
significant decrease after about 1 h of MI-BCI training, while
from the fact that MI training with visual feedback leads to
the non-feedback group’s most network parameters didn’t change
decreased connectivity of the blocks represented by the nodes
significantly. The experimental results showed the necessity
due to stronger inhibitory action generation, mentioned in
of neurofeedback. This study has laid a good foundation for
previous literature (Waldvogel et al., 2000; Attwell and Iadecola,
subsequent BCI closed-loop neurological rehabilitation studies.
2002). In Figure 7, we analyzed network connectivity changes
The analytical approach for measuring the effectiveness of short-
from the perspective of the cerebral hemispheres’ internal and
term rehabilitation training proposed in this study is expected to
external interactions. We speculated that the decreasing trend
facilitate the establishment of a more personalized rehabilitation
of the feedback group might be caused by the concentration
assessment system, which, when correlated with long-term
of neural clusters in the brain area and the concentration of
clinical indicators, can lead to more credible and regulated
ERP changes in specific relevant areas, which led to a decrease
individual treatment schedules and help patients to undergo
in the overall correlation within the region. The reduction in
more efficient rehabilitation.
the contralateral MI of the left hand indicated certain ERD
The next step of the study is to collect more data or try
characteristics. Feedback MI training more significantly affects
to apply generative methods to deal with the data scarcity.
brain networks in the task state than in the resting state. In
Furthermore, we also consider different feedback strategies
conclusion, this ERP-based constructed network change showed
to link the short-term indicators to the specific neurological
a significant decrease in the short-time task state, contralateral
mechanisms, so as to provide a more underlying and reliable basis
effectiveness, etc., intuitively reflecting the immediate effect of
for experimental results.
short-term BCI training on the brain.
In the current research on BCI rehabilitation training, we
see that many studies have been devoted to finding indicators DATA AVAILABILITY STATEMENT
of long-term rehabilitation. In contrast, the indicators proposed
in this paper found that brain network activity changes over The original contributions presented in the study are included
a short period. Feedback training results are more significant in the article/Supplementary Material, further inquiries can be
than those of no-feedback training indicators, which are expected directed to the corresponding author/s.
Frontiers in Human Neuroscience | www.frontiersin.org 10 June 2021 | Volume 15 | Article 627100Wang et al. Short-Term BCI Rehabilitation Study
AUTHOR CONTRIBUTIONS the Natural Science Foundation of Beijing Municipality, China
(Grant No. 4202040), and Shanghai Science and Technology
YW: conceptualization. YW and JL: validation and writing— Innovation Action Plan (19441908200).
original draft preparation. JL, YW, and QC: formal analysis.
QC and HW: resources. JL, QC, and HW: writing—review and
editing. All authors have read and agreed to the published version ACKNOWLEDGMENTS
of the manuscript.
We would like to thank editor and reviewers for helpful
FUNDING comments to improve this manuscript.
This research was supported by the Independent Deployment
of Scientific Research Projects of Jihua Laboratory SUPPLEMENTARY MATERIAL
(X190051TB190), the National Natural Science Foundation
of China (U1913216), the Shanghai Municipal Science and The Supplementary Material for this article can be found
Technology Major Project (2017SHZDZX01), the National online at: https://www.frontiersin.org/articles/10.3389/fnhum.
Natural Science Foundation of China (Grant No. 61876015), 2021.627100/full#supplementary-material
REFERENCES Caria, A., Weber, C., Brötz, D., Ramos, A., Ticini, L. F., Gharabaghi, A., et al. (2011).
Chronic stroke recovery after combined BCI training and physiotherapy: a case
Ahn, M., and Jun, S. C. (2015). Performance variation in motor imagery brain– report. Psychophysiology 48, 578–582. doi: 10.1111/j.1469-8986.2010.01117.x
computer interface: a brief review. J. Neurosci. Methods 243, 103–110. doi: Carter, A. R., Shulman, G. L., and Corbetta, M. (2012). Why use a connectivity-
10.1016/j.jneumeth.2015.01.033 based approach to study stroke and recovery of function? Neuroimage 62,
Alkadhi, H., Brugger, P., Boendermaker, S. H., Crelier, G., Curt, A., HeppReymond, 2271–2280. doi: 10.1016/j.neuroimage.2012.02.070
M.-C., et al. (2005). What disconnection tells about motor imagery: evidence Cheng, D., Liu, Y., and Zhang, L. (2018). “Exploring motor imagery EEG patterns
from paraplegic patients. Cereb. Cortex 15, 131–140. doi: 10.1093/cercor/ for stroke patients with deep neural networks,” in Proceedings of the 2018 IEEE
bhh116 International Conference on Acoustics, Speech and Signal Processing (ICASSP)
Ang, K. K., Guan, C., Phua, K. S., Wang, C., Zhou, L., Tang, K. Y., et al. (2014). (Piscataway, NJ: IEEE), 2561–2565.
Brain-computer interface-based robotic end effector system for wrist and hand Cheng, L., Wu, Z., Sun, J., Fu, Y., Wang, X., Yang, G. Y., et al. (2015).
rehabilitation: results of a three-armed randomized controlled trial for chronic Reorganization of motor execution networks during sub-acute phase after
stroke. Front. Neuroeng. 7:30. doi: 10.3389/fneng.2014.00030 stroke. IEEE Trans. Neural Syst. Rehabil. Eng. 23, 713–723. doi: 10.1109/tnsre.
Attwell, D., and Iadecola, C. (2002). The neural basis of functional brain 2015.2401978
imaging signals. Trends Neurosci. 25, 621–625. doi: 10.1016/s0166-2236(02)02 Daly, J. J., Cheng, R., Rogers, J., Litinas, K., Hrovat, K., and Dohring, M. (2009).
264-6 Feasibility of a new application of noninvasive brain computer interface (BCI):
Baig, M. Z., Aslam, N., Shum, H. P., and Zhang, L. (2017). Differential evolution a case study of training for recovery of volitional motor control after stroke.
algorithm as a tool for optimal feature subset selection in motor imagery EEG. J. Neurol. Phys. Ther. 33, 203–211. doi: 10.1097/npt.0b013e3181c1fc0b
Expert Syst. Appl. 90, 184–195. doi: 10.1016/j.eswa.2017.07.033 Daly, J. J., and Wolpaw, J. R. (2008). Brain–computer interfaces in neurological
Barclay, R. E., Stevenson, T. J., Poluha, W., Semenko, B., and Schubert, J. rehabilitation. Lancet Neurol. 7, 1032–1043. doi: 10.1016/s1474-4422(08)
(2020). Mental practice for treating upper extremity deficits in individuals with 70223-0
hemiparesis after stroke. Cochrane Database Syst. Rev. 2011:CD005950. de Vico Fallani, F., Richiardi, J., Chavez, M., and Achard, S. (2014). Graph analysis
Beatty, J., Greenberg, A., Deibler, W. P., and O’Hanlon, J. F. (1974). Operant of functional brain networks: practical issues in translational neuroscience.
control of occipital theta rhythm affects performance in a radar monitoring Philos. Trans. R. Soc. B Biol. Sci. 369:20130521. doi: 10.1098/rstb.2013.0521
task. Science 183, 871–873. doi: 10.1126/science.183.4127.871 Faith, A., Chen, Y., Rikakis, T., and Iasemidis, L. (2011). “Interactive rehabilitation
Belardinelli, P., Laer, L., Ortiz, E., Braun, C., and Gharabaghi, A. (2017). Plasticity and dynamical analysis of scalp EEG,” in Proceedings of the 2011 Annual
of premotor cortico-muscular coherence in severely impaired stroke patients International Conference of the IEEE Engineering in Medicine and Biology
with hand paralysis. NeuroImage 14, 726–733. doi: 10.1016/j.nicl.2017.03.005 Society (Piscataway, NJ: IEEE), 1387–1390.
Braadbaart, L., Williams, J. H., and Waiter, G. D. (2013). Do mirror neuron areas Fallani, F. D. V., Pichiorri, F., Morone, G., Molinari, M., Babiloni, F., Cincotti,
mediate mu rhythm suppression during imitation and action observation? Int. F., et al. (2013). Multiscale topological properties of functional brain networks
J. Psychophysiol.8 89, 99–105. doi: 10.1016/j.ijpsycho.2013.05.019 during motor imagery after stroke. Neuroimage 83, 438–449. doi: 10.1016/j.
Brown, B. B. (1970). Recognition of aspects of consciousness through association neuroimage.2013.06.039
with EEG alpha activity represented by a light signal. Psychophysiology 6, Friston, K. J. (2011). Functional and effective connectivity: a review. Brain Connect.
442–452. doi: 10.1111/j.1469-8986.1970.tb01754.x 1, 13–36. doi: 10.1089/brain.2011.0008
Buch, E., Weber, C., Cohen, L. G., Braun, C., Dimyan, M. A., Ard, T., et al. (2008). Gonzalez-Lima, F., and Mclntosh, A. R. (1994). Neural network interactions related
Think to move: a neuromagnetic brain-computer interface (BCI) system for to auditory learning analyzed with structural equation modeling. Hum. Brain
chronic stroke. Stroke 39, 910–917. doi: 10.1161/strokeaha.107.505313 Mapping 2, 23–44. doi: 10.1002/hbm.460020105
Büchel, C., and Friston, K. (2000). Assessing interactions among neuronal systems Graimann, B., Allison, B., and Pfurtscheller, G. (2009). “Brain–computer interfaces:
using functional neuroimaging. Neural Netw. 13, 871–882. doi: 10.1016/s0893- a gentle introduction,” in Brain-Computer Interfaces, eds B. Graimann, G.
6080(00)00066-6 Pfurtscheller, and B. Allison (Berlin: Springer), 1–27. doi: 10.1007/978-3-642-
Büchel, C., and Friston, K. J. (1997). Modulation of connectivity in visual pathways 02091-9_1
by attention: cortical interactions evaluated with structural equation modelling Horwitz, B., Friston, K. J., and Taylor, J. G. (2000). Neural modeling and functional
and fMRI. Cereb. Cortex (New York, NY: 1991) 7, 768–778. doi: 10.1093/cercor/ brain imaging: an overview. Neural Netw. 13, 829–846. doi: 10.1016/s0893-
7.8.768 6080(00)00062-9
Bullmore, E., and Sporns, O. (2009). Complex brain networks: graph theoretical Kaplan, B. J. (1975). Biofeedback in epileptics: equivocal relationship of reinforced
analysis of structural and functional systems. Nat. Rev. Neurosci. 10, 186–198. EEG frequency to seizure reduction. Epilepsia 16, 477–485. doi: 10.1111/j.1528-
doi: 10.1038/nrn2575 1157.1975.tb06076.x
Frontiers in Human Neuroscience | www.frontiersin.org 11 June 2021 | Volume 15 | Article 627100Wang et al. Short-Term BCI Rehabilitation Study
Kaya, M., Binli, M. K., Ozbay, E., Yanar, H., and Mishchenko, Y. (2018). A large Nowlis, D. P., and Kamiya, J. (1970). The control of electroencephalographic
electroencephalographic motor imagery dataset for electroencephalographic alpha rhythms through auditory feedback and the associated mental activity.
brain computer interfaces. Sci. Data 5, 180211. Psychophysiology 6, 476–484. doi: 10.1111/j.1469-8986.1970.tb01756.x
Kim, T., Kim, S., and Lee, B. (2016). Effects of action observational training plus Oberman, L. M., Ramachandran, V. S., and Pineda, J. A. (2008). Modulation of
brain–computer interface-based functional electrical stimulation on paretic mu suppression in children with autism spectrum disorders in response to
arm motor recovery in patient with stroke: a randomized controlled trial. familiar or unfamiliar stimuli: the mirror neuron hypothesis. Neuropsychologia
Occup. Ther. Int. 23, 39–47. doi: 10.1002/oti.1403 46, 1558–1565. doi: 10.1016/j.neuropsychologia.2008.01.010
Kok, A. (1997). Event-related-potential (ERP) reflections of mental resources: a Oikonomou, V. P., Georgiadis, K., Liaros, G., Nikolopoulos, S., and Kompatsiaris,
review and synthesis. Biol. Psychol. 45, 19–56. doi: 10.1016/s0301-0511(96) I. (2017). “A comparison study on EEG signal processing techniques using
05221-0 motor imagery EEG data,” in Proceedings of the 2017 IEEE 30th international
Korik, A., Sosnik, R., Siddique, N., and Coyle, D. (2018). Decoding imagined 3D symposium on computer-based medical systems (CBMS) (Piscataway, NJ: IEEE),
hand movement trajectories from EEG: evidence to support the use of mu, beta, 781–786.
and low gamma oscillations. Front. Neurosci. 12:130. doi: 10.3389/fnins.2018. Ono, T., Tomita, Y., Inose, M., Ota, T., Kimura, A., Liu, M., et al. (2015).
00130 Multimodal sensory feedback associated with motor attempts alters BOLD
Kuhlman, W. N. (1978). Functional topography of the human mu rhythm. responses to paralyzed hand movement in chronic stroke patients. Brain
Electroencephalogr. Clin. Neurophysiol. 44, 83–93. doi: 10.1016/0013-4694(78) Topogr. 28, 340–351. doi: 10.1007/s10548-014-0382-6
90107-4 Pfurtscheller, G., and Da Silva, F. L. (1999). Event-related EEG/MEG
Kumar, S., Sharma, R., Sharma, A., and Tsunoda, T. (2016). “Decimation filter with synchronization and desynchronization: basic principles. Clin. Neurophysiol.
common spatial pattern and fishers discriminant analysis for motor imagery 110, 1842–1857. doi: 10.1016/s1388-2457(99)00141-8
classification,” in Proceedings of the 2016 International Joint Conference on Philips, G. R., Daly, J. J., and Príncipe, J. C. (2017). Topographical measures
Neural Networks (IJCNN) (Piscataway, NJ: IEEE), 2090–2095. of functional connectivity as biomarkers for post-stroke motor recovery.
Langhorne, P., Coupar, F., and Pollock, A. (2009). Motor recovery after stroke: J. Neuroeng. Rehabil. 14:67.
a systematic review. Lancet Neurol 8, 741–754. doi: 10.1016/s1474-4422(09) Prasad, G., Herman, P., Coyle, D., McDonough, S., and Crosbie, J. (2009). “Using
70150-4 motor imagery based brain-computer interface for post-stroke rehabilitation,”
Latora, V., and Marchiori, M. (2001). Efficient behavior of small-world networks. in Proceedings of the 2009 4th International IEEE/EMBS Conference on Neural
Phys. Rev. Lett. 87:198701. Engineering (Piscataway, NJ: IEEE), 258–262.
Leeb, R., Biasiucci, A., Schmidlin, T., Corbet, T., Vuadens, P., and Millán, J. D. R. Ramos-Murguialday, A., and Birbaumer, N. (2015). Brain oscillatory signatures of
(2016). “BCI controlled neuromuscular electrical stimulation enables sustained motor tasks. J. Neurophysiol. 113, 3663–3682. doi: 10.1152/jn.00467.2013
motor recovery in chronic stroke victims,” in Proceedings of the 6th International Ramos-Murguialday, A., Broetz, D., Rea, M., Läer, L., Yilmaz, Ö, Brasil, F. L., et al.
Brain-Computer Interface Meeting (No. CONF) (Asilomar, CA). (2013). Brain–machine interface in chronic stroke rehabilitation: a controlled
Li, M., Liu, Y., Wu, Y., Liu, S., Jia, J., and Zhang, L. (2014). Neurophysiological study. Ann. Neurol. 74, 100–108. doi: 10.1002/ana.23879
substrates of stroke patients with motor imagery-based brain-computer Renton, T., Tibbles, A., and Topolovec-Vranic, J. (2017). Neurofeedback as a form
interface training. Int. J. Neurosci. 124, 403–415. doi: 10.3109/00207454.2013. of cognitive rehabilitation therapy following stroke: a systematic review. PLoS
850082 One 12:e0177290. doi: 10.1371/journal.pone.0177290
Lin, P., Yang, Y., Gao, J., De Pisapia, N., Ge, S., Wang, X., et al. (2017). Dynamic Rossiter, H. E., Boudrias, M. H., and Ward, N. S. (2014). Do movement-related
default mode network across different brain states. Sci. Rep. 7:46088. beta oscillations change after stroke? J. Neurophysiol. 112, 2053–2058. doi:
Marshall, P. J., Reeb, B. C., and Fox, N. A. (2009). Electrophysiological responses 10.1152/jn.00345.2014
to auditory novelty in temperamentally different 9-month-old infants. Dev. Sci. Rozelle, G. R., and Budzynski, T. H. (1995). Neurotherapy for stroke rehabilitation:
12, 568–582. doi: 10.1111/j.1467-7687.2008.00808.x a single case study. Biofeedback Self Regul. 20, 211–228. doi: 10.1007/
Marzbani, H., Marateb, H. R., and Mansourian, M. (2016). Neurofeedback: a bf01474514
comprehensive review on system design, methodology and clinical applications. Sakkalis, V. (2011). Review of advanced techniques for the estimation of brain
Basic Clin. Neurosci. 7:143. connectivity measured with EEG/MEG. Comput. Biol. Med. 41, 1110–1117.
Matsumoto, J., Fujiwara, T., Takahashi, O., Liu, M., Kimura, A., and Ushiba, J. doi: 10.1016/j.compbiomed.2011.06.020
(2010). Modulation of mu rhythm desynchronization during motor imagery Schwarz, A., Pereira, J., Kobler, R., and Müller-Putz, G. R. (2019). Unimanual and
by transcranial direct current stimulation. J. NeuroEng. Rehabil. 7:27. doi: bimanual reach-and-grasp actions can be decoded from human EEG. IEEE
10.1186/1743-0003-7-27 Trans. Biomed. Eng. 67, 1684–1695. doi: 10.1109/tbme.2019.2942974
McIntosh, A. R. (1999). Mapping cognition to the brain through neural Shindo, K., Kawashima, K., Ushiba, J., Ota, N., Ito, M., Ota, T., et al. (2011).
interactions. Memory 7, 523–548. doi: 10.1080/096582199387733 Effects of neurofeedback training with an electroencephalogram-based brain–
McIntosh, A. R. (2000). Towards a network theory of cognition. Neural Netw. 13, computer interface for hand paralysis in patients with chronic stroke: a
861–870. doi: 10.1016/s0893-6080(00)00059-9 preliminary case series study. J. Rehabil. Med. 43, 951–957. doi: 10.2340/
McIntosh, A. R., Fitzpatrick, S. M., and Friston, K. J. (2001). On the marriage of 16501977-0859
cognition and neuroscience. Neuroimage 14, 1231–1237. doi: 10.1006/nimg. Singer, W. (1999). Neuronal synchrony: a versatile code for the definition of
2001.0941 relations? Neuron 24, 49–65. doi: 10.1016/s0896-6273(00)80821-1
Mihara, M., Hattori, N., Hatakenaka, M., Yagura, H., Kawano, T., Hino, T., et al. Sitaram, R., Ros, T., Stoeckel, L., Haller, S., Scharnowski, F., Lewis-Peacock, J.,
(2013). Near-infrared spectroscopy–mediated neurofeedback enhances efficacy et al. (2017). Closed-loop brain training: the science of neurofeedback. Nat. Rev.
of motor imagery–based training in poststroke victims: a pilot study. Stroke 44, Neurosci. 18, 86–100. doi: 10.1038/nrn.2016.164
1091–1098. doi: 10.1161/strokeaha.111.674507 Soekadar, S. R., Witkowski, M., Birbaumer, N., and Cohen, L. G. (2015). Enhancing
Mukaino, M., Ono, T., Shindo, K., Fujiwara, T., Ota, T., Kimura, A., et al. Hebbian learning to control brain oscillatory activity. Cereb. Cortex 25, 2409–
(2014). Efficacy of brain-computer interface-driven neuromuscular electrical 2415. doi: 10.1093/cercor/bhu043
stimulation for chronic paresis after stroke. J. Rehabil. Med. 46, 378–382. doi: Song, J., Young, B. M., Nigogosyan, Z., Walton, L. M., Nair, V. A., Grogan, S. W.,
10.2340/16501977-1785 et al. (2014). Characterizing relationships of DTI, fMRI, and motor recovery
Naros, G., and Gharabaghi, A. (2015). Reinforcement learning of self-regulated in stroke rehabilitation utilizing brain-computer interface technology. Front.
β-oscillations for motor restoration in chronic stroke. Front. Hum. Neurosci. Neuroeng. 7:31. doi: 10.3389/fneng.2014.00031
9:391. doi: 10.3389/fnhum.2015.00391 Stam, C. V., and Van Straaten, E. C. W. (2012). The organization of physiological
Nicolas-Alonso, L. F., and Gomez-Gil, J. (2012). Brain computer interfaces, a brain networks. Clin. Neurophysiol. 123, 1067–1087. doi: 10.1016/j.clinph.2012.
review. Sensors 12, 1211–1279. 01.011
Frontiers in Human Neuroscience | www.frontiersin.org 12 June 2021 | Volume 15 | Article 627100You can also read