Changes in Tsunami Risk to Residential Buildings at Omaha Beach, New Zealand - MDPI
←
→
Page content transcription
If your browser does not render page correctly, please read the page content below
Article

Changes in Tsunami Risk to Residential Buildings at
Omaha Beach, New Zealand
Ryan Paulik 1,*, Emily Lane 2, Shaun Williams 2 and William Power 3
 1 National Institute of Water and Atmospheric Research (NIWA), 301 Evans Bay, Greta Point, Wellington
 6021, New Zealand; Ryan.Paulik@niwa.co.nz
 2 National Institute of Water and Atmospheric Research (NIWA), 10 Kyle Street, Riccarton, Christchurch

 8011, New Zealand; Emily.Lane@niwa.co.nz (E.L.), Shaun.Williams@niwa.co.nz (S.W.)
 3 GNS Science, 1 Avalon Drive, Lower Hutt, Wellington 5040, New Zealand; W.Power@gns.cri.nz

 * Correspondence: Correspondence: Ryan.Paulik@niwa.co.nz

 Received: 29 January 2019; Accepted: 26 February 2019; Published: 2 March 2019

 Abstract: Coastal settlements worldwide have suffered significant damage and loss to tsunami
 hazards in the last few decades. This period coincides with socio‐economic changes that have
 heightened spatio‐temporal risk through increased coastal development and infrastructure. In this
 study, we apply a spatio‐temporal loss model to quantify the changes in direct economic losses to
 residential buildings from tsunami hazards over a 20‐year period in Omaha Beach, New Zealand.
 The approach reconstructed temporal urban settlement patterns (1992, 1996, 2006 and 2012) for an
 area potentially exposed to regional source tsunami inundation hazard. Synthetic depth–damage
 functions for specific building classes were applied to estimate temporal damage and loss from
 tsunami inundation exposure at each building location. Temporal loss estimates were reported for
 a range of risk metrics, including probable maximum loss, loss exceedance and average annual loss.
 The results showed that an increase in the number of buildings and changes to building design (i.e.,
 storeys, floor area, foundations) influenced the increasing risk to direct economic loss over the study
 period. These increases were driven by conversion from rural to urban land use since 1996. The
 spatio‐temporal method presented in this study can be adapted to analyse changing risk patterns
 and trends for coastal settlements to inform future tsunami mitigation measures and manage direct
 economic losses.

 Keywords: tsunami hazard; coastal development; building attributes; synthetic vulnerability
 functions; direct economic losses; spatio‐temporal risk changes

1. Introduction
 Tsunamis have caused frequent loss of life and damage to buildings and infrastructure along
exposed and vulnerable coastlines in the last few decades. Rapid population growth, driven by
increasing social and economic demand to live, work and holiday in coastal areas, has intensified
building and infrastructure development in these locations [1,2]. Consequently, development
intensification has exacerbated population and financial exposure to coastal flood hazards, including
tsunami. Indeed, the 2004 Indian Ocean Tsunami (IOT) and the 2011 Great East Japan Earthquake
and Tsunami (GEJET) demonstrate the catastrophic potential for economic loss and loss of life when
coastal settlements are exposed to tsunami [3].
 Risk analysis informs disaster risk managers of the potential consequences from future natural
hazard events, providing a basis for making risk‐informed decisions regarding land‐use
development [4]. Risk is often expressed in disaster management as the potential physical, absolute
or relative socio‐economic losses for single or multiple event scenarios over a specified time period

Geosciences 2019, 9, 113; doi:10.3390/geosciences9030113 www.mdpi.com/journal/geosciences
Geosciences 2019, 9, 113 2 of 17

[5,6]. Tsunami risk analysis involves an understanding of the tsunami hazard in any given coastal
location as well as its vulnerability, which is underpinned by historical and future changes in
development and population characteristics of that location.
 Loss models are used in tsunami risk analysis to evaluate the potential consequences of different
scenarios by relating hazard intensities (e.g., flow depth and/or velocity) with the vulnerability of
exposed elements (e.g., buildings, people, infrastructure) [7–10]. Vulnerability functions, which
describe the relationships between hazard intensity and asset damage response, are used in the
modelling process to estimate economic losses. These are developed as either damage or fragility
curves. Damage curves represent the building damage response as a ratio or percentage of the
economic cost of replacement to restore the building to its pre‐damaged condition [11]. In contrast,
fragility curves describe the conditional probability that a damage state will be reached or exceeded
for a given hazard intensity [12]. Both are further classified as (1) empirical, which are functions
derived from damage surveys or insurance claim datasets or (2) synthetic, which are based on either
laboratory tests or expert knowledge on the damage response to hazard intensity. In the absence of
empirically based vulnerability functions for use in loss estimation, context‐specific synthetic curves
are typically developed, for example, in [13,14].
 The risk to elements exposed to a given hazard is often expressed as the temporal recurrence or
annual probability of loss. However, this risk is not static in time; it can change due to changes in the
hazard (e.g. sea level rise exacerbating tsunami hazard or mitigation measures) or changes to the
exposed elements (e.g. new building developments and construction design). Identifying changes to
the assets at risk and their vulnerability to the hazard over a given timeframe provides insight on
dynamic exposure, vulnerability and how risk evolves [15]. Risk estimation of direct economic losses
is widely practiced in tsunami risk analysis [4,7–10,16–18]. However, economic loss scenarios often
limit risk estimation to a single point in time. This is usually determined by the availability of physical
and/or numerical tsunami inundation scenarios and spatial inventories of elements at risk for a given
location, including the availability of context‐specific vulnerability information. This limits risk
analysis from informing decision‐makers on how the risk has changed over time, including the cost‐
effectiveness of risk reduction and/or mitigation activities to minimize future losses from tsunami
hazards. Understanding how elements at risk from tsunamis have changed can support forecasting
of trends that inform decision‐making on activities to reduce losses in future events. Furthermore,
information from such analyses provides a tool for planners and decision‐makers to develop cost–
benefit models for regulatory or non‐regulatory tsunami risk management operations.
 The objective of this study was to quantify and assess the changes in direct economic loss to
buildings over a 20‐year period from tsunami hazards at a local scale and in a location with limited
empirical tsunami impact and vulnerability data. The influence of sea level rise on tsunami hazard
was not considered in this study due to only 3 cm (1.5 ± 0.1 mm/year) of mean sea level rise in this
region over the study period [19]. A spatio‐temporal methodology was applied at Omaha Beach, New
Zealand, to identify building density and attributes in 1992, 1996, 2006 and 2012 exposed to tsunami
hazards (Figure 1). Context‐specific synthetic damage curves were developed and applied in
scenario‐based loss models to estimate changes in direct economic losses for buildings exposed to
tsunami hazards over this period. The drivers influencing the observed changes, including wider
implications and limitations of this study, are discussed within the context of dynamic building
exposure and evolving tsunami risk.

Geosciences 2019, 9, 113 3 of 17

 Figure 1. Overview of study location and urban settlement at Omaha Beach in 2012.

2. Materials and Methods
 Tsunami loss scenarios were used to assess the spatial and temporal risk variations at Omaha
Beach, with risk described as the direct economic loss to buildings for the selected years 1992, 1996,
2006 and 2012. The study was restricted to these years due to available aerial photography for Omaha
Beach. The methodology used to estimate risk is described in seven sections: (1) description of study
area; (2) loss modelling framework and application tool; (3) tsunami hazard data used in the analysis;
(4) spatial building inventories for each study year; (5) synthetic vulnerability (damage) function
development; (6) risk estimation of direct losses to buildings; and (7) limitations in estimating direct
economic losses.

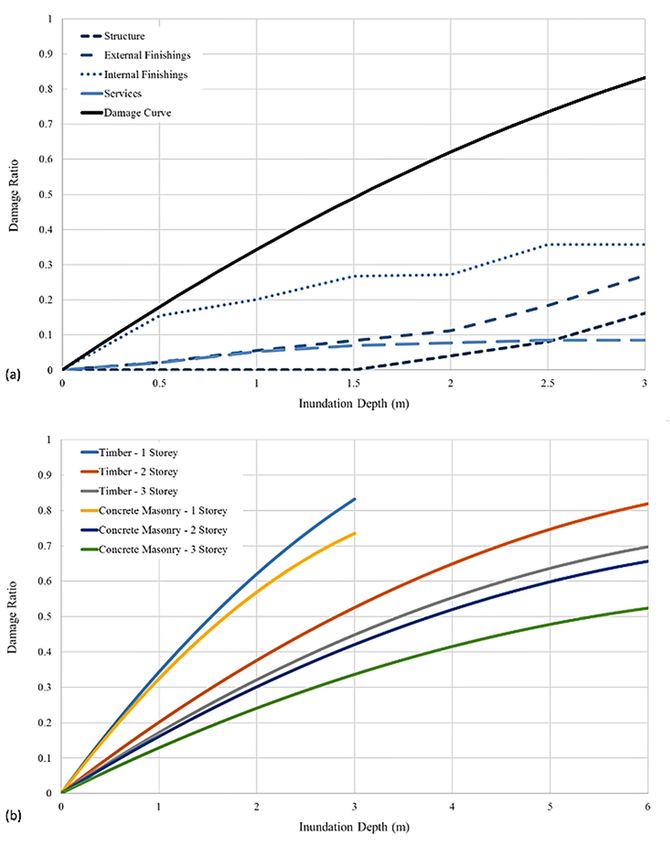
Geosciences 2019, 9, 113 4 of 17

2.1. Study Area
 Omaha Beach is a coastal suburb located 74 km north of Auckland, New Zealand (Figure 1). The
urban settlement is located on a fine‐grain Holocene barrier sandspit, which separates Whangateau
Harbour from Little Omaha Bay [20]. In the 20th century, the sandspit was used for pastoral
production (e.g. sheep and beef farming), with residential building development occurring on the
central spit in the 1960s. A mix of temporal and permanent residential building development steadily
occurred until 2001, when a residential subdivision of over 700 parcels transformed the southern and
northern sandspit from pastoral and scrub land to urban residential settlement. In 2006, Omaha Beach
had a permanent residential population of 417, which can increase up to six times during the summer
holiday period [21].
 Omaha’s location on the northeast New Zealand coast exposes it to a range of coastal inundation
hazards, including local, regional and distant source tsunamis. Indeed, geological evidence for a
potential 14th century event has been reported at Omaha Beach [22]. More recently, a maximum peak‐
to‐trough height of ~2.5 m was observed for the 1960 Chile tsunami in Leigh Harbour, 6km north of
Omaha Beach. [23]. No observed run‐up or building damage was reported at Omaha Beach, though
the sandspit was still largely used for pastoral production. However, numerical modelling for a range
of tsunami scenarios suggests the possibility of severe inundation at Omaha Beach [24], indicating
there is a significant tsunami hazard in this rapidly developing area.

2.2. Loss Modelling
 Loss modelling was performed using RiskScape software (Version 0.2.84). RiskScape is an open‐
access software application built on a generic loss model framework that relates spatial information
about natural hazard intensity (e.g. tsunami) and assets at risk (e.g. buildings) to vulnerability
functions that estimate direct and indirect economic loss [25]. The software is configured for multiple
hazard, asset, vulnerability and loss types, including tsunami. The system’s modularity supports
interchangeable spatial layers, which allows for estimating the direct economic loss to buildings for
each tsunami scenario in each study year. The loss model inputs used in this study are described in
Sections 2.3 to 2.5.

2.3. Tsunami Hazard
 The regional source tsunami inundation scenarios modelled in [24] for Omaha Beach provided
the underpinning hazard data used in this study. Whilst Omaha Beach is potentially exposed to local,
regional and distant source tsunami hazards [22,23], regional source tsunamis pose the greatest
inundation threat to buildings in the area. The Kermadec Trench subduction zone was identified as
the most likely source for regional tsunamis impacting Omaha Beach in [26,27]. Uncertainty in the
seismic parameters was systematised using a logic tree. The Kermadec Trench was broken into unit
sources (100 km by 50 km patches), and offshore tsunamis were calculated based on 1 m slip for each
source. An arbitrary offshore tsunami time series was then rapidly calculated, assuming linear
superposition following [26]. A Monte Carlo method assuming a truncated Gutenburg–Richter
relationship with a ‘b’ value of 1 was then used to calculate 100,000‐year synthetic time series for each
branch of the logic tree. Based on offshore Auckland wave height, the logic tree branch for the 84th
percentile (mean plus one standard deviation) was selected, and the 100 largest tsunamis from that
were selected for inundation modelling. See [28] for further details on the selection of events. The
hydrodynamic River and Coastal Ocean Model (RiCOM) [29–33] was then used to model the
inundation of these 100 ‘worst’ events, assuming bare‐earth LiDAR topography gridded into a digital
elevation model (DEM) at a spatial resolution of 10 m [24]. Maximum inundation depths, which
provide the hazard intensity used in this study, were calculated on land for each of these ‘worst’ 100
events, and the results were represented as digital raster (.asc) layers (Figure 2). These layers for each
tsunami scenario were intersected with building feature locations in each study year to extract the
intensity measure for vulnerability function estimation of direct economic loss.
Geosciences 2019, 9, 113 5 of 17

 Figure 2. Modelled maximum tsunami inundation extent at Omaha Beach.

2.4. Buildings at Risk
 The features of buildings at Omaha Beach were obtained from a spatial building inventory
developed for New Zealand [34,35]. The inventory provides georeferenced feature locations for 2012
buildings, along with structural and non‐structural attributes. Aerial photography captured in 2012
was used to visually validate building locations using ArcGIS10.1, and approximately 10% of
building locations were corrected. In addition, a random sample of 300 buildings (~25%) was
observed on Google Street view to assess the accuracy of building construction frame and storey
attributes. Construction frame and storey attributes were updated for 5% and 2% of these buildings,
respectively.
 Aerial imagery for Omaha Beach was also acquired for 1992, 1996 and 2006. Temporal building
feature datasets representing 1992, 1996 and 2006 were created by (1) removing all features with ’year
of construction’ values that correspond or post‐date the aerial image year; (2) visually checking aerial
imagery for the feature’s presence; (3) digitising ‘missing’ features; and (4) applying ‘averaged’ or
‘proportionate’ attribute values to missing temporal building features (Table 1). Attributes applicable
Geosciences 2019, 9, 113 6 of 17

for building replacement cost estimation and vulnerability function application in the loss model
were either retained or assigned to each temporal building feature. Importantly, aerial imagery post‐
2012 was not available for Omaha Beach, thereby restricting this study to the period 1992–2012.
 Building replacement costs were estimated from 2012 construction industry valuation
guidelines [36]. Replacement cost rates ($/m2) were assigned to each building feature based on
construction frame, storeys, foundation type and floor area. The applicable rate was multiplied by
floor area to estimate the total replacement cost. Replacement costs for 1992, 1996 and 2006 building
features were adjusted for inflation based on New Zealand’s capital goods price index [37]. The index
provides temporal capital asset cost changes for residential and non‐residential building
constructions. This informed replacement cost inflation adjustments for 1992 (−93.5%), 1996 (−70.4%)
and 2006 (−26.6%) buildings relative to 2012.

 Table 1. Statistics relating to building attribute for the Omaha Beach urban settlement in each study
 year.

 Year
 Building Attributes
 1992 1996 2006 2012
 Count 568 669 1096 1303
 Buildings
 Missing 43 30 54 58
 Residential 448 557 956 1147
 Use Category Count
 Non‐Residential 120 112 140 156
 Count 557 658 1068 1270
 Timber
 % 98.1 98.4 97.4 97.5
 Construction Frame
 Count 11 11 28 33
 Concrete Masonry
 % 1.9 1.6 2.6 2.5
 Count 380 432 609 677
 1
 % 66.9 64.6 55.6 52
 Count 173 219 451 587
 Storeys 2
 % 30.5 32.7 41.1 45
 Count 15 18 36 39
 3
 % 2.6 2.7 3.3 3
 Mean 120 132 155 168
 Floor Area (m2)
 SD 71 74 85 91
 Mean 0.49 0.52 0.42 0.4
 Floor Height (m)
 SD 0.21 0.22 0.2 0.2
 Count 436 493 737 812
 Piles
 % 76.8 73.7 67.2 62.3
 Foundation
 Count 132 176 359 491
 Slab
 % 23.2 26.3 32.8 37.7
 Sum 68,245,310 115,458,809 330,457,661 509,361,845
 Replacement Cost ($NZD) Mean 120,150 172,584 301,512 390,914
 SD 93,999 122,573 203,527 256,619

2.5. Vulnerability Functions
 Damage curves estimate the economic loss value of a single building for a given hazard intensity
[38]. This approach enables comparative building damage estimates from multiple tsunami
inundation scenarios. Few building damage curves have been developed for tsunamis [39,40], and
an absence of local empirical damage data meant ‘synthetic’ damage curves were developed for
buildings at Omaha Beach.
 Synthetic damage curve development requires three steps: (1) classify buildings based on
construction frame material and number of storeys; (2) estimate the structure, external finishes,
internal finishes and services component construction cost ratios (i.e. component construction
cost/total construction cost) for each building class; and (3) estimate component damage ratios based
on material susceptibility to damage and replacement in response to increasing tsunami inundation
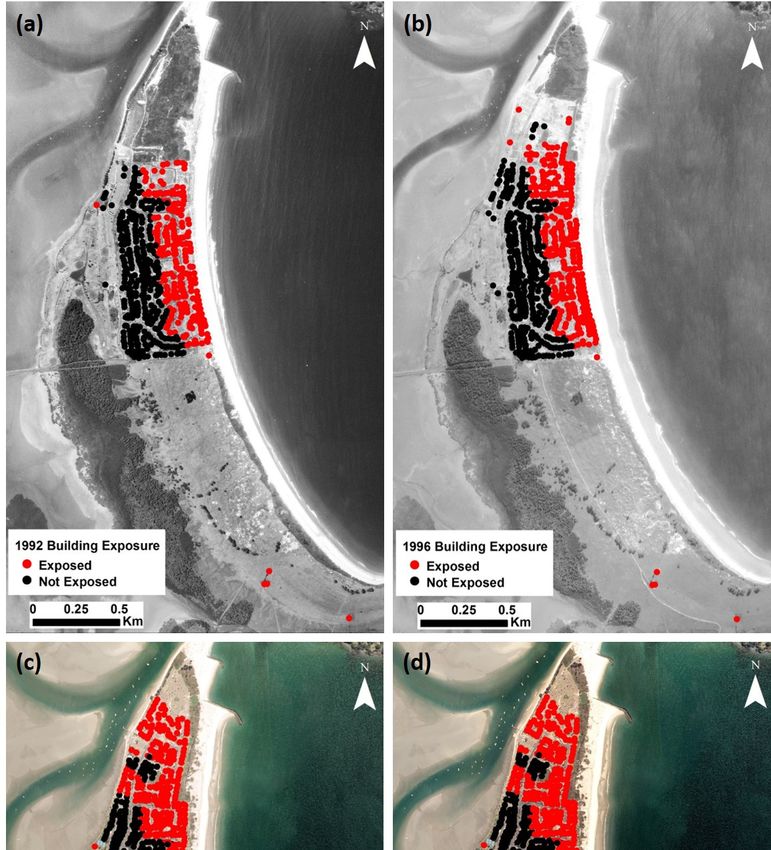
Geosciences 2019, 9, 113 7 of 17

depths. Six building classes were identified at Omaha Beach. Building class component cost ratios
and 2012 replacement cost rates were estimated from construction industry valuation guidelines [36]
and are presented in Table 2.

 Table 2. Building class replacement costs, component cost ratios and synthetic tsunami depth–
 damage functions applied in this study.

 Replacement Component Cost Ratio
 Building Synthetic Depth–
 Cost (NZD External Internal R2
 Class Structure Services Damage Function
 2012$/m2) Finishes Finishes
 Timber—1 DRB = −0.0329 × DFlr2 +
 1850 0.19 0.31 0.39 0.11 0.99
 Storey 0.3761 × DFlr
 Timber—2 DRB = −0.0129 × DFlr2 +
 2050 0.17 0.30 0.41 0.12 0.98
 Storey 0.214 × DFlr
 Timber—3 DRB = −0.0111 × DFlr2 +
 3900 0.16 0.25 0.33 0.25 0.96
 Storey 0.1829 × DFlr
 Concrete
 DRB = −0.0396 × DFlr2 +
 Masonry 1850 0.19 0.31 0.39 0.11 0.97
 0.3638 × DFlr
 —1 Storey
 Concrete
 DRB = −0.0103 × DFlr2 +
 Masonry 2050 0.17 0.30 0.41 0.12 0.96
 0.1712 × DFlr
 —2 Storey
 Concrete
 DRB = −0.0083 × DFlr2 +
 Masonry 3900 0.16 0.25 0.33 0.25 0.96
 0.1372 × DFlr
 —3 Storey
 DRB: building damage ratio; DFlr: inundation depth above first finished floor level.

 Component damage ratios are derived from estimates of material damage response to tsunami
inundation depth above the first finished floor level. Internal finishes, services and some external
finishes (e.g. doors, windows) require replacement upon water contact. Distribution of these
components across multiple finished building levels reduces their overall damage susceptibility [41].
Structures and durable external finishes (e.g. concrete masonry wall cladding, roof cladding) are less
susceptible to water‐contact damage, with damage occurring at higher inundation depths when
hydrodynamic forces may exceed building demand strength [4].
 Damage curves estimate total component damage ratios (i.e. repair cost/replacement cost) at
increasing inundation depth intervals until either a maximum component damage ratio or a complete
building replacement is reached. For each building class, total component damage ratios were
summed at intervals of 0.5 m depth, then 2nd order polynomial functions (Table 2) were heuristically
fitted to produce simple continuous damage curves (Figure 3). The polynomial functions interpolate
component damage ratios between depth intervals, representing a general trend of building damage
in response to increasing inundation depth. Depth (DFlr) was measured from the first finished floor
level up (the damage ratio (DRB) was assumed to be zero below this level). Damage curves were
applied when depths above ground exceeded a building’s first finished floor level (DR = 0) until a
depth corresponding with expected maximum damage (DR = 1) or complete building replacement
was reached. Once the tsunami depth above floor, DFlr, reached 3 m, complete destruction was
assumed for both the one‐storey building classes, and the damage ratio was set to 1.
Geosciences 2019, 9, 113 8 of 17

 Figure 3. (a) ‘Timber—1 Storey’ building class component damage ratios with simplified ‘fitted’
 synthetic depth–damage curve. (b) Synthetic depth–damage curves representing mean expected
 damage ratios for timber and concrete masonry building classes at Omaha Beach, New Zealand.

 In general, concrete masonry building classes are assumed to have a lower damage susceptibility
compared with their timber counterparts. Complete replacement damage states (i.e. damage ratios
>0.85) for these building constructions correspond well with published fragility curve mean
inundation depth estimates for similar timber [42–45] and concrete masonry building classes
[40,45,46].

2.6. Risk Estimation
 In this study, risk is defined as a conditional relationship between hazard intensity and
vulnerability of elements at risk. Risk (Rie|t) is conceptually described in [47] as follows:
 Rie|t = f(Hi, Ve)|t (1)
where losses for the element at risk (e.g., people, buildings, infrastructure) can be expressed as a
vulnerability function, Ve, dependent on the hazard reaching or exceeding a given intensity at the
element at risk location, Hi, and attributes of the risk element, e, characterising its ability to resist
damage from exposure to the hazard intensity. Rie|t is the risk of loss sustained by an element
sustaining loss due to a hazard event reaching or exceeding a given intensity over the time period, t.
 Risk of direct economic loss to buildings at Omaha Beach from the modelled regional source
tsunami hazard scenarios was calculated using the following equation in [47]:
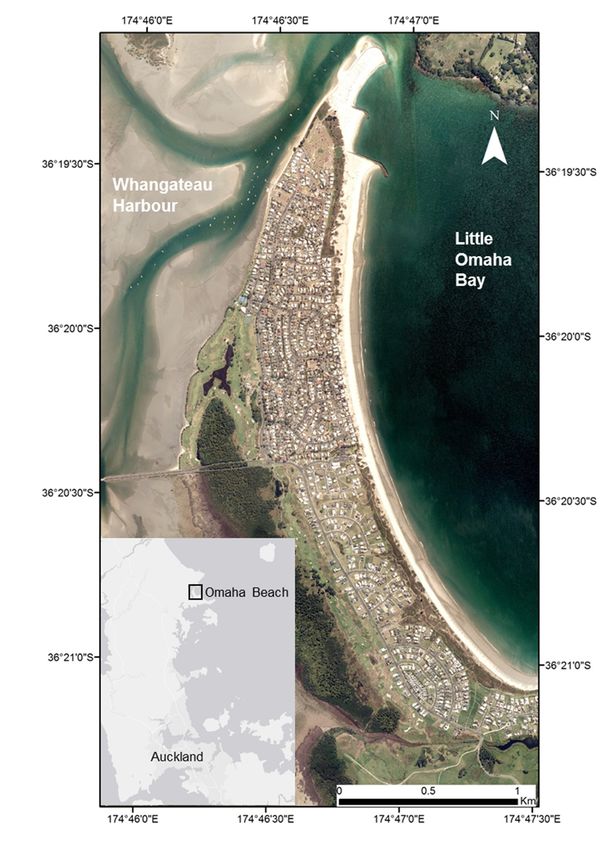
Geosciences 2019, 9, 113 9 of 17

 Pr | (2)

where v(p) is the exceedance rate of loss, p; FA(Eventi) is the Eventi annual frequency of occurrence;
and Pr(P > p|Event i) is the probability of loss being greater than or equal to p, conditioned by the
occurrence of the Eventi. The equation describes the loss exceedance (LE), a metric relating the
expected loss for each annual return interval (ARI) (alternately, the annual rate for each loss to be
reached or exceeded). Probable maximum loss (PML) is estimated from the maximum loss for a
specified return interval. In addition, average annual loss (AAL) is obtained from a weighted average
of all possible loss values, p. The AAL is calculated from the integral of v(p):
 AAL = (3)

The AAL and LE were estimated for specified return intervals within the modelled regional source
tsunami hazard scenario during the 100,000‐year time series for Omaha Beach. PML is reported as
the maximum tsunami inundation scenario loss estimate and is the highest loss exceedance (LE).

2.7 Limitations in Estimating Direct Economic Losses
 In addition to the limitations in modelling the tsunami hazard provided in [24,28], the
methodology to estimate temporal changes in economic loss has inherent limitations. Assumptions
were made to identify assets at risk and transition through intervals between study years. Most
building features were derived from a spatial inventory with accurate year of construction attributes
[34,35]. Aerial photography resolution supported validation of building features. Digitising missing
features can lead to overestimates of habitable floor areas and replacement costs as roof eaves and
parapets can protrude beyond external walls by up to one metre. New Zealand residential buildings
are required to have eave‐overhangs from external walls between 0.45 and 0.75 m [48]. An average
overhang of 0.6 m was assumed for missing features. Overhang areas were calculated from external
length and then subtracted from digitised floor area.
 Building replacement costs were estimated for each building class using construction industry
valuation guidelines [49]. The industry guidance provides cost rates ($/m2) for generalised building
types, corresponding to the building classes in Table 2. Individual buildings rates can vary
considerably within these classes depending on building design specifications. Industry guidance
suggests the average rates could differ up to 4 to 5 times between low and high specification buildings
[36]. Replacement costs assigned to each building class were therefore assumed as average values.

3. Results and Interpretation
 Results and interpretations are presented in three sections: (1) spatial distribution and building
development patterns in each study year; (2) changes in tsunami exposure for each study year; 3)
detailed descriptions and analysis of direct losses to buildings.

3.1. Building Development
 The distribution of buildings at Omaha Beach in 1992, 1996, 2006 and 2012 are illustrated in
Figure 4a–d. Total building numbers increased from 568 to 1303 over the study period. The average
annual construction rate was 39 buildings/year, with rates per year doubling from 25 building/year
between 1992 and 1996 to 52 buildings/year between 2006 and 2012. Over this period, residential
buildings experienced a considerably higher total construction increase (256%) than non‐residential
buildings (31%). Rapid building development after 1996 is demonstrated in Figure 4b–d, following
pastoral and scrub land subdivision for urban land use north and south of the pre‐1996 urban area.
 Residential building attributes changed as new construction proliferated the area after 1996.
Average building size expanded, as indicated by increases in ‘floor area’ and multi‐storey buildings
(Table 1). Multi‐storey (>1) building construction increased by 300% over the study period and, by
2012, formed a higher proportion of new residential buildings than single‐storey construction.
Geosciences 2019, 9, 113 10 of 17

Similarly, mean floor area increased by 23%. After 1996, mean floor area for new building
constructions was 202 m2 (c.f., 132 m2 for the existent building stock), increasing to 241 m2 in 2012
(c.f., 168m2 for the existing building stock). Floor areas for pre‐1992 buildings were on average 40%
smaller than new buildings constructed after 2006. Foundation type and floor height changes indicate
the design of larger residential buildings with concrete slab foundations becoming prevalent. This
foundation type increased between 1992 and 2012 by 337% for new building constructions. After
1996, concrete slabs occurred in just under 50% of buildings, corresponding with a mean floor height
reduction of 0.12 m for all buildings at Omaha Beach. During this period, mean floor heights for
concrete slab and pile foundations were 0.22 m (SD 0.09 m) and 0.6 m (SD 0.14 m).
 Total building replacement costs for all buildings in the study area rose from NZD$68.2 M in
1992 to NZD$509.3 M in 2012. Land subdivision within and immediately north of the urban area in
1992 encouraged new residential building development. This growth added NZD$11.7 M of total
building replacement cost annually, reaching NZD$115.4 M in 1996. Over the next 10 years, new
building construction worth NZD$214.9 M occurred on pastoral and scrub land beyond the 1996
urban area. A further NZD$178.9 M worth of buildings were constructed after 2006. Peak building
construction during this period contributed nearly NZD$30 M in total replacement cost annually.
Residential buildings accounted for 98% of total replacement costs for all buildings constructed since
1992.

3.2. Exposure of Buildings to Tsunami Hazards
 Tsunami inundation scenarios were used to identify changes to a range of hazard exposure
metrics for the study years, including inundation frequency and inundation depth. The spatial
distribution of buildings constructed since 1992 showed an increase in building numbers exposed to
tsunami inundation (Figure 4b–d). Within the modelled maximum tsunami inundation extent, 281
buildings were identified in 1992, including 219 residential. Building construction on land exposed
to this inundation scenario increased by 28 per year on average between 1992 and 2012. By 2012, 841
buildings (750 residential) were exposed to inundation (Table 3). The highest construction rates
observed on inundated land were between 1996 and 2006, reaching 35 buildings per year. During this
period, rural‐to‐urban land conversion and residential building construction commenced.
Geosciences 2019, 9, 113 11 of 17

 Figure 4. Urban settlement development in Omaha Beach in (a) 1992, (b) 1996, (c) 2006 and (d) 2012.
 Buildings exposed to modelled maximum regional source tsunami inundation are identified (red).

 Although total inundation frequency for all exposed buildings increased during the study
period, the inundation frequency of individual buildings decreased after 1996 (Table 3). In 1996, the
mean inundation frequency for exposed buildings was 56 times out of 100 modelled scenarios.
Inundation frequency decreased to 48 times in 2006 and further to 46 times in 2012. This suggests
Geosciences 2019, 9, 113 12 of 17

that, on average, the new buildings constructed since 1996 had a lower inundation frequency than
the existing buildings. This occurrence is notwithstanding an additional 474 new buildings
developed on land within the modelled maximum inundation extent.
 On average, inundation depths decreased for individual buildings after 1996. The mean
inundation depths for individual buildings was 1.79 for all modelled tsunami scenarios in 1996, with
over half exceeding 1.86 (Table 3). New building constructions after 1996 corresponded to a mean
inundation depth reduction to 1.45 m in 2006 and a further 1.4 m by 2012. In 2012, approximately 420
buildings were exposed to inundation depths exceeding 1.4 m, which was over 300 more than in 1992.

 Table 3. Summary of building inundation for all 100 modelled tsunami inundation scenarios.

 Building Inundation Descriptive Statistics
 Year Inundation Metric
 Max. Min. Mean Median SD
 Inundation frequency (all buildings) 281 1 149 182 97
 1992 Inundation frequency (individual buildings) 100 1 53 62 24
 Inundation depth (metres above ground) 5.99 0.18 1.73 1.71 1.10
 Inundation frequency (all buildings) 357 3 203 254 128
 1996 Inundation frequency (individual buildings) 100 1 56 69 23
 Inundation depth (metres above ground) 5.99 0.19 1.79 1.86 1.05
 Inundation frequency (all buildings) 707 8 340 363 239
 2006 Inundation frequency (individual buildings) 100 1 48 50 24
 Inundation depth (metres above ground) 5.99 0.18 1.45 1.50 0.89
 Inundation frequency (all buildings) 831 9 344 398 276
 2012 Inundation frequency (individual buildings) 100 1 46 47 24
 Inundation depth (metres above ground) 5.99 0.18 1.40 1.45 0.88

3.3. Temporal Changes in Direct Economic Loss
 The loss model results showed a considerable increase in direct economic loss between 1992 and
2012 (Table 4). Importantly, the results demonstrated increasing potential loss with building
expansion at Omaha Beach over this period. The probable maximum loss represents the highest direct
economic loss expected over a given time period. This was calculated for a range of time periods and
for each study year. PML was estimated to increase from NZD$22.9 M in 1992 to NZD$193.9 M in
2012 (Table 4), i.e. an increase of +846%. On average, PML increased annually by NZD$8.5 M over
the 20‐year study period. Although PML rose year upon year, variations in average annual rates were
observed between construction periods. Lowest average annual PML rates of NZD$5 M/year were
observed between 1992 and 1996. Rapid building construction during the 1996 to 2006 period added
NZD$101.7 M to overall PML at a rate of NZD$10 M/year. After 2006, this rate reduced slightly to
NZD$8.2 M per year over six years to 2012, i.e. an additional NZD$49.2 M. Mean PML for all tsunami
hazard scenarios was NZD$81,602 in 1992, increasing to NZD$120,352 in 1996, NZD$204,664 in 2006
and NZD$233,380 in 2012. These results demonstrate a maximum direct economic loss increase for
individual buildings of almost three times over the 20‐year study period.

 Table 4. Estimated building loss exceedance (LE) and average annual loss (AAL) for each study year
 in $NZD. Probable maximum loss (PML) is the equivalent of the 100,00‐year LE value.

 1992 1996 2006 2012
 ARI
 LE AAL LE AAL LE AAL LE AAL
 100,000 22,930,041 9262 42,965,498 18,188 144,697,181 51,034 193,938,461 64,544
 50,000 21,315,706 9040 40,176,812 17,772 136,281,684 49,631 180,478,055 62,676
 20,000 20,495,108 8410 38,665,837 16,585 129,105,059 45,679 169,861,649 57,451
 10,000 18,751,854 7423 36,369,891 14,701 115,386,284 39,548 151,007,601 49,419
 5000 17,383,859 5616 33,715,826 11,193 103,798,281 28,686 134,108,116 35,345
 2500 12,143,002 2584 24,300,622 5241 59,836,295 11,618 75,042,091 13,865
 1000 0 0 0 0 0 0 0 0
Geosciences 2019, 9, 113 13 of 17

 Loss exceedance (LE) provides a probability or likelihood of direct economic loss being reached
or exceeded for each tsunami inundation scenario. Across all inundation scenarios, mean LE
increased by +760% between 1992 and 2012, from NZD$9.3 M to NZD$64.1 M. The likelihood of mean
LE estimates in each study year corresponded to 2000–2200 year ARI. Relative to 1992, mean LE
increased 96% by 1996, a further 444% by 2006 and a further 220% by 2012. Median LE corresponded
to a 2000 ARI. A minor difference was observed between the mean and median LE estimates for 1992
and 1996 (± NZD$1.4 M), although the mean LE was NZD$5.9 M to NZD$10 M higher for 2006 and
2012, respectively. No losses were observed in any year for the 1000‐year ARI despite the inundation
exposure of only nine buildings in 2012.
 Estimates of tsunami loss exceedance at a building scale were higher for buildings constructed
after 1992. Mean LE over all damaged buildings increased by NZD$71,968 (260%) between 1992 and
2012. This estimate rose to $119,218 (364%) during this period when only considering new buildings.
The highest increases in annual mean LE rate of new buildings (NZD$6,439) were observed between
2006 and 2012, corresponding with mean LE estimates per building rising from NZD$125,952 to
NZD$164,595. Relative to 1992, a considerable increase in mean building PML (i.e. maximum LE)
occurred in the construction period 2006–2012, reaching NZD$266,469 (+591%).
 The average annual loss increased by 6.6 times on average between 1992 and 2012. Mean AAL
for all years studied translated to a 2500–2700 year ARI, roughly 500 years higher than the LE
estimates for the corresponding building years. The largest AAL increase rates occurred in the 1996
to 2006 period. The mean AAL increase over this period was NZD$795, rising to NZD$3,284 for the
PML scenario. From 1992 to 1996, mean AAL for all scenarios was NZD$653, slightly higher than the
NZD$503 between 2006 and 2012. Low AAL estimates relative to LE for individual inundation
scenarios resulted from the 100,000‐year regional tsunamigenic earthquake time series used to
simulate tsunami inundation hazards.

4. Discussion
 Urban settlement at Omaha Beach is distinguished by rapid residential building growth between
1992 and 2012. Reconstruction of settlement patterns identified building distribution and attribute
changes over this period that increased potential direct economic loss in modelled regional source
tsunami hazard scenarios. Rural‐to‐urban land‐use conversion since 1996 promoted residential
building construction on land at risk to tsunami inundation. Over 97% of construction frames for new
buildings were timber, a framing material highly susceptible to tsunami damage, particularly when
inundation depths exceed 2 m [42,43,45,46]. On average, the number of storeys and floor area size
also increased during the study period as a consequence of a growing permanent and semi‐
permanent resident population, creating demand for larger buildings to support these living
arrangements. Changing building attributes to support permanent occupation is indicated by
increased multi‐storey buildings (332%) and average floor area by 59 m2 between 1996 and 2012.
Omaha Beach resident population grew by almost 50% between 2006 and 2013 [19].
 Modern residential building construction in New Zealand has observed an increase in concrete
slab foundations [49]. At Omaha Beach, this trend was observed with a 337% increase in concrete slab
foundations for buildings constructed after 1992 and just under 50% of new buildings between 2006
and 2012. The low floor heights above ground, typically 0.2 to 0.3m, increase damage potential for
highly susceptible internal finishes and services. Despite a mean inundation depth decrease for
exposed buildings from 1.73 m in 1992 to 1.4 m in 2012, concrete slab foundations offset potential
inundation depth reduction and internal building damage at new residential building locations.
 The urban settlement at Omaha Beach in 1992 had encroached onto coastal foredunes. Settlement
expansion since 1996 has been predominantly located on land fronted by relatively intact foredunes.
During the 2004 IOT, coastal barriers such as sand dunes were observed to offer land protection
against tsunami inundation in Sri Lanka [50]. Foredune protection at Omaha Beach may have
contributed to an observed decrease in mean building inundation depth and frequency for the
exposed building distribution since 1996. New building developments after 1996 mostly occurred on
land opposite foredunes and were both less frequently exposed to lower magnitude tsunami
Geosciences 2019, 9, 113 14 of 17

inundation events and affected by lower inundation depths in higher magnitude events. However,
as tsunami inundation was not modelled using a representative high‐resolution DEM for each study
year, further detailed investigation is required at the study location to better understand the potential
role of foredunes in reducing exposure and risk for new building developments. Although relative
exposure to tsunami hazard metrics decreased at a building scale over the study period, risk metrics
analysed to estimate direct economic loss, such as probable maximum loss and loss exceedance, all
demonstrate a considerable increase of more than 300% in response to increasing number, size (i.e.
number of storeys and floor area) and replacement values for new building developments on land
exposed to tsunami.
 The changing risk trends presented in this study can be observed in the context of recent coastal
settlement development on coastlines vulnerable to tsunami hazards. Analysis of settlement growth
and susceptibility to direct damage from tsunami inundation informs risk mapping and potential
strategies to mitigate economic loss to current and future building developments. Land‐use
conversion from rural to urban in an area with high amenity values has an important influence on
increased risk of direct economic loss from regional source tsunami hazards. However, the low
likelihood of tsunami hazard and loss recurrence may influence decision‐makers in selecting
appropriate mitigation strategies based on risk. Estimating risk using a range of metrics, including
probable maximum loss, event loss exceedance and average annual loss, provides options to assess
avoidance or the effectiveness of mitigation measures for different scenarios to a given annual return
interval event. This enables land‐use or emergency managers to identify coastal settlements where
risk of direct economic loss has increased over time and assess community risk tolerance to help
identify appropriate mitigation measures. The methods and information presented in this study
informs cost–benefit analysis for community decisions on whether to ’do nothing’ or manage future
economic risk in tsunami hazard zones through mitigation measures, such as avoiding new building
development, adopting more tsunami‐resilient building designs or maintaining or enhancing the
protective capability of coastal barriers.
 In the present study, only direct economic loss for buildings exposed to regional source tsunami
hazards were considered. Future studies could improve this information by including additional
direct (e.g. residential building contents) or indirect (e.g. clean‐up cost, temporary accommodation)
economic losses for affected buildings and infrastructure. In addition, threat to human life should
also be considered where urban settlement expansion on coastal land at risk to tsunami hazards
results in temporal population changes. Extending tsunami hazard scenarios to include local and
distant source tsunami would give a complete analysis of economic risk from the tsunami hazard.
 This study only examined the change in risk that occurred over a 20‐year period. However, the
same methodology could be used in predictive models, where potential future settlements could be
considered and their influence on the risk profile of the built environment assessed. In that way,
planners could decide whether the increased risk due to increased building density or attributes was
acceptable or whether such changes should be avoided due to an unacceptable increase in risk.

5. Conclusions
 This study demonstrates changing risk of direct economic loss to buildings from tsunami hazard
at Omaha Beach, New Zealand. Over a 20‐year period between 1992 and 2012, probable maximum
loss and mean loss exceedance for modelled regional source tsunami inundation scenarios increased
by +846% and +760%, respectively. Reconstruction of urban settlement patterns indicates that risk
increased in response to rapid residential building growth since 1996, following rural‐to‐urban land‐
use conversion. New urban land development exposed a higher number of buildings to tsunami
hazard, while relatively larger residential building constructions increased the replacement value of
assets at risk to tsunami damage. Although mean tsunami inundation depth and frequency over
exposed buildings were observed to have decreased since 1996, this was only because more buildings
are now exposed. Furthermore, the prevalence of concrete slab foundation use in new building
designs has offset potential inundation depth reduction and internal building damage at new
residential building locations.
Geosciences 2019, 9, 113 15 of 17

 The spatio‐temporal method presented in this study to estimate the changing risk of direct
economic loss to buildings is replicable for other coastal settlements. Mapping urban settlement
patterns can be performed using GIS and aerial imagery to identify buildings at risk to tsunami
hazards at different periods of time. In the absence of local empirical data, estimating direct building
damage and loss for specific buildings at risk can create synthetic damage function information
obtained from the knowledge of building component damage response to tsunami inundation. This
approach enables a range of risk metrics to report direct economic loss to buildings, including
probable maximum loss, event loss exceedance and average annual loss, for regional source tsunami
inundation hazards. This information supports cost–benefit analysis and community decisions on
implementing mitigation measures to manage future economic risk in tsunami hazard zones. While
only direct economic loss to buildings was considered in this study, the methodology can be extended
for a more comprehensive risk analysis, including a broader range of direct and indirect losses to
buildings and infrastructure as well as the threat to human life. With risk information, planners can
decide whether a potential increase in economic or social risk with land‐use changes is acceptable or
whether the risk is unacceptable and should be avoided or mitigated.

Author Contributions: Conceptualization, R.P. and E.L.; Data curation, R.P., E.L. and W.P.; Formal analysis,
R.P.; Funding acquisition, R.P.; Methodology, R.P. and S.W.; Project administration, R.P. and S.W.; Resources,
R.P. and S.W.; Validation, E.L. and W.P.; Writing—original draft, R.P.; Writing—review & editing, E.L., S.W.
and W.P.

Funding: This research was funded by NIWA Taihoro Nukurangi through the New Zealand Government’s
Science Strategic Investment Fund (SSIF), grant number CARW1802, and the APC was funded through grant
number CARW1901.

Conflicts of Interest: The authors declare no conflict of interest. The funders had no role in the design of the
study; in the collection, analyses, or interpretation of data; in the writing of the manuscript; or in the decision to
publish the results.

References
1. Neumann, B.; Vafeidis, A.T.; Zimmermann, J.; Nicholls, R.J. Future Coastal Population Growth and
 Exposure to Sea‐Level Rise and Coastal Flooding—A Global Assessment. PLoS ONE 2015, 10, e0118571,
 doi:10.1371/journal.pone.0118571.
2. Twigg, J. Disaster Risk Reduction: Good Practice Review 9; Overseas Development Institute: London, UK, 2015.
3. Suppasri, A.; Muhari, A.; Ranasinghe, P.; Mas, E.; Shuto, N.; Imamura, F.; Koshimura, S. Damage and
 reconstruction after the 2004 Indian Ocean tsunami and the 2011 Great East Japan tsunami. J. Nat. Disaster
 Sci. 2012, 34, 19–39.
4. Berryman, K. Review of Tsunami Hazard and Risk in New Zealand; GNS Science Client Report 2005/104; GNS
 Science: Lower Hutt, New Zealand, 2005.
5. United Nations International Strategy for Disaster Reduction (UNISDR). 2009 UNISDR Terminology on
 Disaster Risk Reduction; UNISDR: Geneva, Switzerland, 2009.
6. Global Facility for Disaster Reduction and Recovery (GFDRR). Understanding Risk in an Evolving World:
 Emerging Best Practices in Natural Disaster Risk Assessment; The World Bank: Washington, DC, USA, 2014.
7. Dominey‐Howes, D.; Dunbar, P.; Varner, J.; Papathoma‐Köhle, M. Estimating probable maximum loss
 from a Cascadia tsunami. Nat. Hazards 2010, 53, 43–61.
8. Weibe, D.M.; Cox, D.T. Application of fragility curves to estimate building damage and economic loss at a
 community scale: A case study of Seaside, Oregon. Nat. Hazards 2014, 71, 2043–2061.
9. Goda, K.; Song, J. Uncertainty modeling and visualization for tsunami hazard and risk mapping: a case
 study for the 2011 Tohoku earthquake. J. Stoch. Environ. Res. Risk. Assess. 2016, 30, 2271–2285.
10. Fukutani, Y.; Suppasri, A.; Imamura, F. Quantitative assessment of epistemic uncertainty in tsunami hazard
 effecting on building risk assessment. Geosciences 2018, 8, 17; doi:10.3390/geosciences8010017.
11. Merz, B.; Kreibich, H.; Schwarze, R.; Thieken, A. Assessment of economic flood damage. Nat. Hazards Earth
 Syst. Sci. 2010, 10, 1697–1724.
Geosciences 2019, 9, 113 16 of 17

12. Tarbotton, C.; Dall’Osso, F.; Dominey‐Howes, D.; Goff, J. The use of empirical vulnerability functions to
 assess the response of buildings to tsunami impact: Comparative review and summary of best practice.
 Earth Sci. Rev. 2015, 142, 120–134.
13. Smith, D. Flood damage estimation—A review of urban stage damage curves and loss function. Water S.A.
 1994, 20, 231–238.
14. McBean, E.; Fortin, M.; Gorrie, J. A critical analysis of residential flood damage estimation curves. Can. J.
 Civ. Eng. 1986, 13, 86–94.
15. Gallina, V.; Torresan, S.; Critto, A.; Sperotto, A.; Glade, T.; Marcomini, A. A review of multi‐risk
 methodologies for natural hazards: Consequences and challenges for climate change impact assessment. J.
 Envt. Manage. 2016, 168, 123–132.
16. Browning, J.; Thomas, N. An assessment of the tsunami risk in Muscat and Salalah, Oman, based on
 estimations of probable maximum loss. Int. J. Disaster. Risk. Reduct. 2016, 16, 75–87.
17. Madani, S.; Khaleghi, S.; Jannat, M.R.A. Assessing building vulnerability to tsunami using the PTVA‐3
 model: A case study of Chabahar Bay, Iran. Nat. Hazards 2017, 85, 349–359.
18. Rose, A.; Wing, I.S.; Wei, D.; Wein, A. Economic Impacts of a California Tsunami. Nat. Hazards Rev. 2016,
 17, 04016002, doi:10.1061/(ASCE)NH.1527‐6996.0000212.
19. Hannah, J.; Bell, R.G.. Regional sea level trends in New Zealand. J. Geophys. Res. 2012, 117, C01004,
 doi:10.1029/2011JC007591.
20. Schofield, J.C. Sand movement at Mangatawhiri Spit and Little Omaha Bay. N.Z. J. Geol. Geophys. 1967, 10,
 697–721.
21. Statistics New Zealand—Omaha. Available online: http://archive.stats.govt.nz/Census/2013‐
 census/profile‐and‐summary‐reports/quickstats‐about‐a‐
 place.aspx?request_value=13221&parent_id=13171&tabname=#13221 (accessed on 8 January 2018).
22. Goff, J.; Walters, R.; Lamarche, G.; Wright, I.; Chagué‐Goff, C. Tsunami Overview Study; Technical
 Publication No.280; Auckland Regional Council: Auckland, New Zealand, 2005.
23. Downes, G.; Barberopoulou, A.; Cochran, U.; Clark, K.; Scheele, F. The New Zealand Tsunami Database:
 Historical and Modern Records. Seismol. Res. Lett. 2017, 88, 342–353, doi:10.1785/0220160135.
24. Lane, E.M.; Gillibrand, P.A.; Wang, X.; Power, W. A Probabilistic Tsunami Hazard Study of the Auckland
 Region, Part II: Inundation Modelling and Hazard Assessment. Pure Appl. Geophys. 2013, 170, 1635–1646.
25. Schmidt, J.; Matcham, I.; Reese, S.; King, A.; Bell, R.; Smart, G.; Cousins, J.; Smith, W.; Heron, D.
 Quantitative multi‐risk analysis for natural hazards: a framework for multi‐risk modelling. Nat. Hazards
 2011, 58, 1169–1192.
26. Titov, V.V.; Gonzalez, F.I.; Bernard, E.N.; Eble, M.C.; Mofjeld, H.O.; Newman, J.C.; Venturato, A.J. Real‐
 time tsunami forecasting: Challenges and solutions. Nat. Hazards 2005, 35, 41–58.
27. Power, W.L.; Wang, X.; Wallace, L.; Reyners, M. Tsunami hazard posed to New Zealand by the Kermadec
 and Southern New Hebrides Subduction Margins: An Assessment Based on Plate Boundary Kinematics.
 Pure Appl. Geophys. 2012, 169, 1–36.
28. Power, W.; Wang, X.; Lane, E.; Gillibrand, P. A probabilistic tsunami hazard study of the Auckland region,
 part I: propagation modelling and tsunami hazard assessment at the shoreline. Pure Appl. Geophys. 2013,
 170, 1621–1634.
29. Lane, E.M.; Gillibrand, P.A.; Arnold, J.R.; Walters, R.A. Tsunami inundation modelling using RiCOM. Aust.
 J. Civ. Eng. 2011, 9, 83–98.
30. Walters, R.A. Numerical Simulation of Tsunami Generation, Propagation, and Runup; American Society of Civil
 Engineers: New York, NY, USA, 2004.
31. Walters, R.A. Coastal ocean models: two useful finite element methods. Continent. Shelf Res. 2005, 25, 775–
 793.
32. Walters, R.A. A semi‐implicit finite element model for non‐hydrostatic (dispersive) surface waves. Int. J.
 Num. Methods Fluids 2005, 49, 721–737.
33. Walters, R.A. Design considerations for a finite element coastal ocean model. Ocean Modelling 2006, 15, 90–
 100.
34. Bell, R.; King, A. RiskScape Project: 2004–2008; NIWA Science Report 2009/75; NIWA: Auckland, New
 Zealand, 2009.
Geosciences 2019, 9, 113 17 of 17

35. Lin, S.‐L.; Cousins, J.; King, A. Development of New Zealand exposure dataset for use in loss modelling.
 In Proceedings of the Australian Structural Engineering Conference: ASEC 2016, Barton, ACT: Engineers
 Australia, Brisbane, Australia, 22–25 November 2016; 476–485.
36. Giddens, C. Rawlinson’s New Zealand Construction Handbook 2012; Rawlinson Media Ltd: Auckland, New
 Zealand, 2012.
37. Statistics New Zealand—New Zealand Consumer Price Index. Available online:
 https://www.stats.govt.nz/topics/consumers‐price‐index (accessed on 8 January 2018).
38. Messner, F.; Penning‐Roswell, E.; Green, C.; Meyer, V.; Tunstall, S.; van der Veen, A. Evaluating Flood
 Damages: Guidance and Recommendations on Principles and Methods; Report Number T09‐06‐01; FLOOD Site
 Project Report. HR Wallingford: Oxfordshire, UK, 2007.
39. Reese, S.; Cousins, W.J.; Power, W.L.; Palmer, N.G.; Tejakusuma, I.G.; Nugrahadi, S. Tsunami
 vulnerabilityof buildings and people in South Java–field observations after the July 2006 Java tsunami. Nat.
 Hazards Earth Syst. Sci. 2007, 7, 573–589.
40. Valencia, N.; Gardi, A.; Gauraz, A.; Leone, F.; Guillannde, R. New tsunami damage functions developed in
 the framework of SCHEMA project: Application to European‐Mediterranean coasts. Nat. Hazards Earth
 Syst. Sci. 2011, 11, 2385–2846.
41. Neubert M.; Naumann, T.; Deilmann, C. Synthetic water level building damage relationships for GIS‐
 supported flood vulnerability modelling of residential properties. In Flood Risk Management: Research and
 Practice; Samuels, P., Huntington, S., Allsop, W., Harrop, J., Eds.; Taylor and Francis Group: London, UK,
 2009; pp. 1717–1724.
42. Amakuni, K.; Terazono, N.; Enomoto, T.Y.T. Basic analysis on building damages by tsunami due to the
 2011 Great East Japan Earthquake Disaster using GIS. In Proceedings of the 15th World Conference on
 Earthquake Engineering, Lisbon, Portugal, 24–28 September 2012; p.10.
43. Mas, E.; Koshimura, S.; Suppasri, A.; Matsuoka, M.; Matsuyama, M.; Yoshii, T.; Jimenez, C.; Yamazaki, F.;
 Imamura, F. Developing tsunami fragility curves using remote sensing and survey data of the 2010 Chilean
 Tsunami in Dichato. Nat. Hazards Earth Syst. Sci. 2012, 12, 2689–2697.
44. Murao, O.; Nakazato, H. Vulnerability functions for buildings based on damage survey data in Sri Lanka
 after the 2004 Indian Ocean tsunami. In Proceedings of the 7th International Conference Sustainable Built
 Environment, Kandy, Sri Lanka, 13–14 December 2010; pp. 371–378.
45. Suppasri, A.; Mas, E.; Charvet, I.; Gunasekera, R.; Imai, K.; Fukutani, Y.; Abe, Y.; Imamura, F. Building
 damage characteristics based on surveyed data and fragility curves of the 2011 Great East Japan tsunami.
 Nat. Hazards 2013, 66, 319–341.
46. Reese, S.; Bradley, B.A.; Bind, J.; Smart, G.; Power, W.; Sturman, J. Empirical building fragilities from
 observed damage in the 2009 South Pacific tsunami. Earth Sci. Rev. 2011, 107, 156–173.
47. Velásquez, C.A.; Cardona, O.D.; Mora, M.G.; Yamin, L.E.; Carreño, M.L.; Barbat, A.H. Hybrid loss
 exceedance curve (HLEC) for disaster risk assessment. Nat. Hazards 2014, 72, 455–479.
48. Department of Building and Housing, 2010 Simple House Acceptable Solution. Available online:
 https://www.building.govt.nz/assets/Uploads/building‐code‐compliance/specific‐buildings/simple‐
 house/asvm/simple‐house‐acceptable‐solution‐1st‐edition.pdf (accessed on 10 January 2018).
49. Rosevear, M.; Curtis, M. Physical Characteristics of New Houses 2015; BRANZ Study Report SR367; BRANZ
 Ltd: Judgeford, New Zealand, 2017.
50. Morton, R.A.; Goff, J.R.; Nichol, S.L. Impacts of the 2004 Indian Ocean tsunami on the southwest coasts of
 Sri Lanka. In Coastal Sediments’07: American Society of Civil Engineers: New Orleans, LA, USA, 2007;
 Volume 2, pp. 1061–1074.
 © 2019 by the authors. Licensee MDPI, Basel, Switzerland. This article is an open access
 article distributed under the terms and conditions of the Creative Commons Attribution
 (CC BY) license (http://creativecommons.org/licenses/by/4.0/).
You can also read