CHAPTER 1:BACKGROUND & ANALYSIS - Greenwood ...
←
→
Page content transcription
If your browser does not render page correctly, please read the page content below
CHAP TE R 1: BACKGROUND & ANALY SIS
GENERAL FEATURES
Location
Greenwood is the county seat of Leflore County, Mississippi and is located at the eastern edge of the
Mississippi Delta, approximately 96 miles north of Jackson, Mississippi and 130 miles south of Memphis,
Tennessee.
Natural Features
The city has a total area of 9.5 square miles, of which 9.2 square miles is land and 0.3 square miles of it is
water (3.15%). Greenwood is located where the Tallahatchie and Yalobusha rivers join to form the Yazoo
River. In fact, Greenwood is one of the few places in the world where you can stand between two rivers,
the Yazoo and the Tallahatchie Rivers, flowing in the opposite direction.
The flood plain of the Mississippi River has long been an area rich in vegetation and wildlife, feeding off
the Mississippi and its numerous tributaries. Long before Europeans migrated to America, the Choctaw
and Chickasaw Indian nations settled in the Delta's marsh and swampland. In 1830, the Treaty of
Dancing Rabbit Creek was signed by Choctaw Chief Greenwood Leflore, opening the swampland to
European settlers.
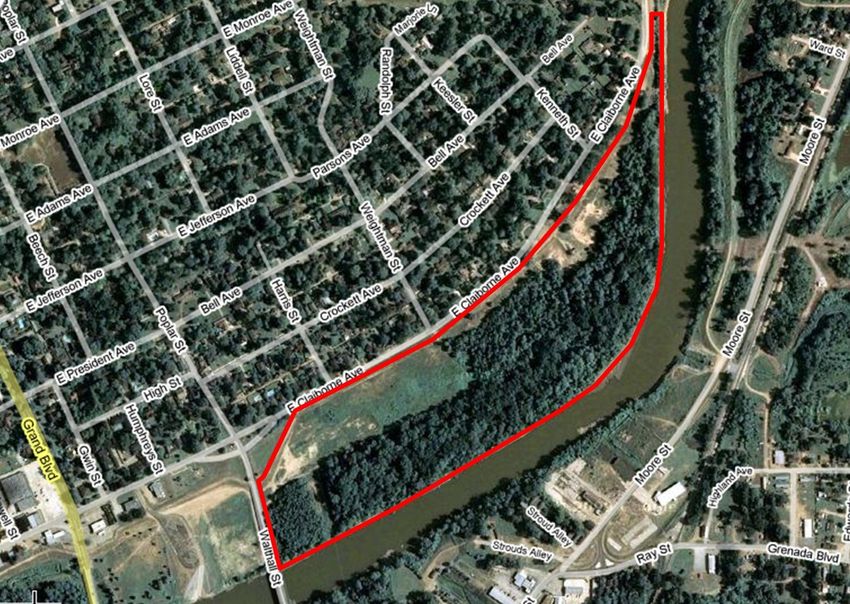
Picture: Greenwood's Grand Boulevard once named one of America's ten most beautiful streets
by the U.S. Chambers of Commerce and the Garden Clubs of America.
History
The first settlement on the banks of the Yazoo River was a trading post founded by John Williams in 1830
and known as Williams Landing. The settlement quickly blossomed, and in 1844 was incorporated as
“Greenwood,” named after Chief Greenwood Leflore. Growing into a strong cotton market, the key to
the city’s success was based on its strategic location in the heart of the Delta, on the easternmost point of
the alluvial plain and astride the Tallahatchie River and the Yazoo River. The city served as a shipping
Greenwood Comprehensive Plan: 2010–2040 | 13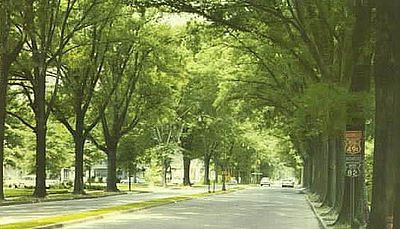
point to New Orleans, Louisiana; Vicksburg, Mississippi; Memphis, Tennessee and St. Louis, Missouri.
Greenwood continued to prosper until the latter part of the American Civil War.

During the war, Greenwood played an important, if little-known, role in the famous Siege of Vicksburg.
In early 1863, a hastily constructed Confederate fort was placed between the two rivers at Fort
Pemberton. Here the Confederates met the oncoming Union flotilla with fierce resistance and the sinking
of the paddle wheeler "Star of the West" in the channel of the Tallahatchie River, successfully stopping
their advance. As a result, Grant abandoned the Yazoo Expedition and retreated north to the Mississippi
River to assault Vicksburg by another route.

The end of the Civil War in the mid-1860s and the following year of Reconstruction severely diminished
the cotton industry and crippled the city's previously thriving economy. Greenwood saw very little
growth during these years of hardship.

The arrival of railroads in the 1880s saved the city, with two lines running directly through downtown
Greenwood, close to the Yazoo River. As a result, Greenwood once again emerged as a prime shipping
point for cotton. Downtown's Front Street bordering the Yazoo bustled with cotton factories and other
related businesses, earning that section the name Cotton Row. The city continued to prosper in this way
well into the 1940s. Recent years have seen a decline in cotton planting in favor of corn and soybeans.

From 1962 through 1964, Greenwood was a center of protests and voter registration struggles during the
Civil Rights Movement. Due, in part, to history made during the Civil Rights Movement, the African-
American contribution to the Greenwood region is invaluable and continues today.

The Delta has exported as much music as cotton, sprouted from the spirit of the people. The spirit was
fed by the town and country churches, including the area's oldest African-American church, Wesley
United Methodist in downtown Greenwood, organized in 1870. The spirit was shaped by centers of
learning such as Mississippi Valley State University, which has borne generation of historic figures, from
sports stars and Olympians to civil rights leader and present-day civic leaders.

Leflore County has produced extraordinary music stars, from the early bluesmen such as Mississippi
John Hurt from nearby Teoc, Mississippi, and Walter “Furry” Lewis to the talent of today including B.B.
King, Hubert Sumlin and Denise LaSalle. Another famous blues musician, Robert Johnson, has three
memorial gravestones in the Greenwood area.

Greenwood Today
Greenwood is experiencing a cultural renaissance with physical improvements being made in its
downtown area. Its historic downtown boasts dozens of completed renovations with several others in
progress. There are upscale shops, unique dining experiences, a boutique hotel, galleries and museums.
All the while, Greenwood has retained its small-town beauty, Delta personality and deep-South
hospitality.

The establishment of Greenwood as a tourist destination came with the revitalization of Howard Street in
historic Downtown Greenwood. Because of Viking Range Corporation’s investment in downtown
Greenwood, the city has become a culinary destination, including the opportunity to stay at a four
diamond boutique hotel, enjoy fine dining, participate in a cooking class or demonstration, as well as
purchase from the upscale Viking line of kitchen products, all within a few city blocks.

Mississippi Blues Trail Markers
Radio station WGRM on Howard Street was the location of B.B. King's first live broadcast in 1940. In
dedication to this event, the Mississippi Blues Trail has placed its third historic marker in this town at the
14 | Greenwood Comprehensive Plan: 2010–2040
site of the former radio station. Another Mississippi Blues trail marker is placed near the grave of blues
singer Robert Johnson just one mile north of Greenwood. There is also a Blues Trail marker at the Elks
Lodge in south Greenwood, as well as one in the Baptist Town neighborhood at McKinley Chapel.

Greenwood Culture
Greenwood hosts many annual events. The numerous festivals, productions, parades, celebrations, and
concerts all bring an element of family fun that draws people from all over the world. From the largest
Christmas parade in the southeastern United States to a community-wide Independence Day celebration,
Greenwood prides itself on playing host to a variety of community and cultural events.

Museums & History
       Greenwood Blues Heritage Museum & Gallery
       Cottonlandia Museum
       Fort Pemberton and Star of the West

Media & Publishing
Newspapers, Magazines and Journals
    The Greenwood Commonwealth
    Leflore Illustrated

Television
     WABG – ABC Affiliate
     WMAO –TV – PBS Affiliate

Radio
       WABG, 960 AM and 87.7 FM (ABC Broadcasting)
       WGNG, 106.3 FM (Hip-Hop, Urban Contemporary)
       WGNL, 104.3 FM (Adult Contemporary/Blues)
       WMAO-FM, 90.9 FM (NPR)
       WYMX, 99.1 FM (Top 40/Popular Music)

Education
Post-Secondary Educational Institutions
     Mississippi Valley State University – Greenwood Center
     Mississippi Delta Community College – Greenwood Branch

Greenwood Public Schools
    Greenwood High School
    Greenwood Middle School
    Greenwood Career and Technical Center
    Greenwood Alternative School
    Threadgill Elementary School
    Davis Elementary School
    W. C. Williams Elementary School
    Bankston Elementary School

Private Schools
     Pillow Academy
     North New Summit School
                                                                   Greenwood Comprehensive Plan: 2010–2040 | 15
Parochial Schools
St. Francis of Assisi
Transportation
Railroads
Greenwood is served by two major rail lines, the Canadian National (north south) and Columbus and
Greenville. (east-west) lines. Amtrak, the national passenger rail system, provides twice-daily service to
Greenwood, connecting New Orleans to Chicago from the Greenwood railway station.
Air Transportation
Greenwood is served by Greenwood-Leflore Airport which is located midway between Jackson,
Mississippi and Memphis, Tennessee and about halfway between Dallas, Texas and Atlanta, Georgia.
The Greenwood-Leflore Airport, located at 502 A-Airport Road, has 45,000 aircraft operations annually,
ranging from Boeing 747s to Cessna 172s. Approximately 80 aircraft call the airport home, including
recreational aircraft, helicopters, and multi-million dollar business aircraft. The military routinely uses
Greenwood-Leflore Airport to conduct training flights from a multi-state area.
With Funding from the U.S. Department of Transportation and the Mississippi Department of
Transportation, Division of Aeronautics, The Greenwood Leflore Airport is building a new air traffic
control tower that is expected to open in early 2011.
Existing ALP Airport Land Use Plan
Highways
U.S. Highway 82 runs through Greenwood on its way from Alamogordo, New Mexico east to Brunswick,
Georgia, connecting with Interstate 55 just 30 miles east of Greenwood in Winona. U.S. Route 49 passes
through Greenwood as it stretches between Piggott, Arkansas south to Gulfport, Mississippi. Highway 7
connects Greenwood with the neighboring community of Grenada, also at Interstate 55.
Sidewalks and Trails
Greenwood’s older area has a good system of sidewalks following the city’s traditional grid system of
streets, making these areas amenable to walking. Most of the areas enjoy a nice mature tree canopy that
provides the shade needed for an enjoyable walk for recreation or transportation. Newer residential and
commercial areas do not have the same kind of sidewalk network due to an almost exclusive emphasis on
the automobile after World War II.
16 | Greenwood Comprehensive Plan: 2010–2040Greenwood has a chance to accomplish many goals with the re-establishment of a sidewalk network and
a nature trail system. Connecting the proposed Greenwood-Yazoo River Natural Area with the
downtown and other commercial areas will bring nature tourists to restaurants and shops. The
proximity of this 45-acre nature reserve in the heart of the city provides a tremendous opportunity to
develop a new tourism/recreation focus for Greenwood.
Greenwood’s older part of town already boasts a walkable/bikeable development pattern that is the envy
of communities that have been sprawling for years. Reconnecting this network, and connecting it to
other parts of the city can provide another form of transportation, as well as a favorable built
environment for exercise in a state that, unfortunately, is the fattest in the nation.
Nature trails can also become part of the city’s green infrastructure, helping with stormwater control and
recharging important potable water aquifers.
Greenwood has also received grant funds for a trail project along the rail line in the downtown area of the
city. This critical pedestrian way can connect pedestrians to the Amtrak station, restaurants, shops,
lodging and parks.
Figure 1. The Greenwood-Yazoo River Natural Area is a great location for hiking and enjoying nature.
Source: City of Greenwood
Greenwood Comprehensive Plan: 2010–2040 | 17POPULATION ANALYSIS
City of Greenwood
Greenwood is the principal city within the Greenwood Micropolitan Statistical Area and the seat of
Leflore County.
In April of 2000 (2000 Census date), there were 18,425 people, 6,916 households, and 4,523 families
residing in the city. The population density was 1,997.8 persons per square mile, and there were 7,565
housing units.
The racial makeup of the city was 32.82% White, 65.36% Black, 0.11% Native American, 0.91% Asian,
0.08% Pacific Islander, 0.24% from other races, and 0.48% from two or more races. Hispanic or Latino
persons of any race were 1.03% of the population.
Of the 6,916 households, 34.0% had children under the age of 18 living with them. Thirty-three and four
tenths percent (33.4%) of those households had married couples living together, 27.4% had a female
householder with no husband present, and 34.6% were non-families. Thirty-one and four tenths of all
households were made up of individuals and 12.7% had someone living alone who was 65 years of age or
older. The average household size was 2.59 and the average family size was 3.29.
The median income for a household in the city was $21,867, and the median income for a family was
$26,393. Males had a median income of $27,267 versus $18,578 for females. The per capita income for the
city was $14,461. Thirty-three and nine tenths percent (33.9%) of the population and 28.8% of families are
below the poverty line. Out of the total population, 47.0% of those under the age of 18 and 20.0% of those
65 and older were living below the poverty line.
Table 1 shows the recent history of Greenwood’s population change. Table 2 indicates Leflore County’s
historic population change. Table 3 compares the City of Greenwood’s population change with that of
other Mississippi cities of similar size.
A new census of the population is currently being conducted and will be released in February 2011.
City Pop. Est. – 16,084, July 1, 2008
18,425 population in 2000/18,906 in 1990
Median age –31.7 years in 2000 (state was 33.8)
Total households 6,916 (occupied housing units) – in 2000
49.3 % owner occupied housing units
50.7 % renter occupied housing units
75 % of homes are single-family detached/attached
23% are multi-family (duplex and above)
2 % mobile homes
Labor force 7,338/ 6,489 employed (2000 Census)
Almost 80% of the housing stock (2000 Census Data) was constructed before 1970 compared to
60% for the state.
Median Household Income – $21,867/$31,330 State
Per Capita Income - $14,461/15,853 State
18 | Greenwood Comprehensive Plan: 2010–2040Table 1. Population Change
Greenwood and Leflore County, 1930-2000
Year Greenwood Leflore County
1930 11,123 53,506
1940 14,767 53,405
1950 18,061 51,813
1960 20,436 47,142
1970 22,400 42,111
1980 20,115 41,525
1990 18,906 37,341
2000 18,425 37,947
Source: U.S. Bureau of the Census, 1930-2000.
Chart 1. Population Change
Greenwood and Leflore County, 1930-2000
60,000
50,000
40,000
Population
30,000
20,000
10,000
0
1930 1940 1950 1960 1970 1980 1990 2000
Greenwood Population Leflore County population
Source: U.S. Bureau of the Census, 1930-2000.
Greenwood Comprehensive Plan: 2010–2040 | 19Table 2. Population Estimates
Greenwood and Leflore County, 2000-2008
Year Greenwood Leflore County
2000 18,441 37,831
2001 18,060 37,043
2002 17,711 35,138
2003 17,588 35,791
2004 17,394 35,791
2005 16,834 35,303
2006 16,446 35,190
2007 16,112 35,173
2008 16,084 36,185
Source: U.S. Bureau of the Census, Estimates 2000-2008.
Chart 2. Population Estimates
Greenwood and Leflore County, 2000-2008
40,000
35,000
30,000
25,000
Population
20,000
15,000
10,000
5,000
0
2000 2002 2002 2003 2004 2005 2006 2007
Greenwood Leflore County
Source: U.S. Bureau of the Census, Estimates 2000-2008.
20 | Greenwood Comprehensive Plan: 2010–2040Other Leflore County Communities
It does not appear that Greenwood is losing population to other communities in Leflore County but to
areas outside of Leflore County and somewhat to the unincorporated portion of the county (14% increase
from 1990 to 2008). Itta Bena, Morgan City, Schlater, and Sidon all lost population or saw gains from 1990
to 2000, only to see losses in 2008 estimates
Special Report: Mississippi Valley State University
A look at Mississippi Valley State University’s growth potential is important to the City of
Greenwood. Its proximity to Greenwood means that the student population can be a market for retail
and housing outlets in the city. The Delta Research and Cultural Institute can be a draw for industries
wishing to avail themselves of the applied research being carried out at the University.
Mississippi Valley State University, located in Leflore County, is a Carnegie Master's I institution that
has historically drawn the majority of its students from throughout the Mississippi Delta. MVSU
offers concentrated study in the arts, business, education, humanities, public services, pre-professional
services, social sciences, sciences, social work, and technology. Master's level programs are offered in
criminal justice, business administration, teaching, elementary education, special education,
environmental health and rural public policy.
MVSU emphasizes the study and applications of technology, basic and applied research, service
learning, health and wellness, and economic and cultural affairs. The Delta Research and Cultural
Institute provides an avenue for faculty and students to engage in theoretical and applied research on
subject matter related to the cultural, social, economic and political concerns of the Delta.
Student enrollment trends are important because the students at MSVU can have a large impact on
many facets of life in Greenwood, including retail sales. Enrollment had been steadily increasing to a
high of 3,621 students in 2004 and then began a slow decline.
Table 3. Ten-Year Enrollment Trend by Total Headcount
Mississippi Valley State University, 1998-2008
Year Enrollment
1998 2,354
1999 2,409
2000 2,569
2001 2,822
2002 3,170
2003 3,506
2004 3,621
2005 3,165
2006 3,162
2007 3,009
2008 2,929
Source: Mississippi Institutions of Higher Learning, Fall Enrollment Book, 2008.
Greenwood Comprehensive Plan: 2010–2040 | 21Comparative Population Growth
Most cities of comparable size to Greenwood saw population increases in the twenty-year period from
1980 to 2000. Greenwood, Clarksdale, Laurel, Natchez, and Columbus saw declining growth rates over
that 20-year period. All of the declining cities continued to show declines even to 2008 estimates of
population, except Laurel, which showed a slight increase in population growth. The largest increases in
growth were seen in two of the state’s three metropolitan areas, and in a university community.
Table 4. Comparative Population Growth
Greenwood and Other Like-Size Communities in Mississippi, 1980-2000
City 1980 2000 # Change % Change
Columbus 27,383 25,944 -1,439 -5.25%
Clinton 14,660 21,847 7,187 49.02%
Vicksburg 25,434 26,407 973 3.83%
Natchez 22,015 18,464 -3,551 -16.13%
Starkville 15,169 21,869 6,700 44.17
Laurel 21,897 18,393 -3,504 -16.00%
Clarksdale 21,137 20,645 -492 -2.33%
Pearl 20,778 21,961 1,183 5.69%
Ridgeland 5,461 20,173 14,712 269.40%
Olive Branch 2,067 21,054 18,987 918.58%
Greenwood 20,115 18,425 1,690 -8.40%
Source: U.S. Bureau of the Census, 1980-2000.
Natural Increase and Migration
The migration study indicates what is generally known, that Greenwood is losing population due to out-
migration. There is growth associated with natural increase (births minus deaths). Public meeting and
stakeholder input indicates that outmigration is due primarily to the perceived lack of quality of the
public education system in Greenwood, as well as post secondary education scholarship opportunities in
neighboring counties.
Table 5. Natural Increase and Migration Components
Greenwood
2000 Population 18,425
1990 Population 18,906
Difference -481
Growth due to natural increase (births minus deaths) 1,781
Loss due to out-migration -2,262
Population added due to annexation N/A
Source: U.S. Bureau of the Census, 1990, 2000; Mississippi Department of Health - Statistics.
Population Projections
Population growth is important because people are markets for businesses, and more people and
businesses help spread the tax burden around. Greenwood’s growth depends upon the city’s willingness
and ability to adapt to changing economic realities. Communities will have an advantage over other
communities if they can quickly mobilize the best people, resources, and capabilities required to turn
22 | Greenwood Comprehensive Plan: 2010–2040innovations into new business ideas and commercial products. The competition for these people is
strong and communities who will win are those who are willing to create attractive and sustainable high
quality places. The strategies for doing this are located in the analysis of implementation tools.
Transition from the Old Economy to the New Economy
Old Economy New Economy
Slow and linear Fast and unpredictable
Fossil fuel, auto oriented Multi-modal transportation
Disposable New energy, Reuse, Recycle
Mono-skilled workforce Multi-skilled, flexible workforce
Large industrial firms Innovative, entrepreneurial, knowledge-based firms
The transition from the old economy to the new economy means that Greenwood needs to place more
emphasis on community amenities that attract entrepreneurial people and firms, the quality of the
workforce and a faster and more flexible way of doing business. In addition, agencies with economic and
community development responsibilities need to work together from one strategic plan. Greenwood will
continue to lose population to neighboring communities unless it responds to these changes. Becoming a
destination of choice means the city is responsive to entrepreneurs, the creative class, and young people.
These groups are the future and their demands are specific. They want a livable city—walkable, bikeable,
environmentally sound, great schools, good housing, personal safety, and activities (many of them
centered on the outdoors).
These projections of population for Greenwood reflect the latest Census projections for Leflore County as
they are based upon the city’s percent of the county’s population and historic trends for Greenwood.
Table 6. Population Projections
Greenwood and Leflore County, 2010–2030
2010 2015 2020 2025 2030
Greenwood 15,629 15,273 15,134 14,979 14,947
Leflore County 35,522 34,712 34,396 34,043 33,970
City % of County 44% 44% 44% 44% 44%
Source: Center for Policy Research and Planning, Mississippi Institutions of Higher Learning, 2010-2020, Leflore County.
Greenwood, 2010-2030; Leflore County 2025-2030, Johnstone & Associates.
Greenwood Comprehensive Plan: 2010–2040 | 23Age Characteristics
Table 7 presents population composition by age. The table illustrates several important trends in the
characteristics of the population.
Table 7. Composition of the Population by Age
Greenwood, State of Mississippi, and U.S., 2000
Age Category Greenwood Mississippi United States
2000 % of Total 2000 % of Total 2000 % of Total
Under 5 1,488 8.1% 204,364 7.2% 19,175,798 6.8%
5-9 years 1,645 8.9% 216,920 7.6% 20,531,152 7.3%
10-14 years 1,589 8.6% 218,742 7.7% 20,528,072 7.3%
15-19 years 1,556 8.4% 233,188 8.2% 20,219,890 7.2%
20-24 years 1,336 7.3% 212,947 7.5% 23,112,088 8.2%
25-34 years 2,376 12.9% 381,798 13.4% 39,891,724 14.2%
35-44 years 2,544 13.8% 425,372 15.0% 45,148,527 16.0%
45-54 years 2,119 11.5% 361,981 12.7% 33,561,641 11.9%
55-59 years 721 3.9% 132,202 4.6% 13,469,237 4.8%
60-64 years 593 3.2% 113,621 4.0% 10,805,447 3.8%
65-74 years 1,146 6.2% 185,710 6.5% 18,390,986 6.5%
75-84 years 915 5.0% 114,922 4.0% 12,361,180 4.4%
Over 85 years 397 2.2% 42,891 1.5% 4,239,587 1.5%
TOTAL 18,425 100.0% 2,844,658 100.0% 281,435,329 100.0%
Median Age 31.7 33.4 35.3
Source: U.S. Bureau of the Census, 2000
According to the 2000 Census, 31% of the population was under the age of 18, 10% were from 18 to 24
years of age, 27% from 25 to 44, 19% from 45 to 64, and 13% were 65 years of age or older. The median
age was 31.7 years of age. For Mississippi, the median age was 33.4 year of age. For every 100 females,
there were 84.2 males. For every 100 females age 18 and over, there were 75.9 males.
Greenwood is a young city, being one year on average younger than the state as a whole. This is a
reflection of the fact that the city has more females of childbearing age, which has led to a large natural
increase component in population change. The percent of children is higher than both the state and the
nation.
Despite a younger than average median age, it is important to not forget the impact of the general trend
in aging in this country on Greenwood. The country’s and the state’s median age is the oldest it has ever
been and will continue to increase as the baby boomers age. During the next 50 years, the five to one
ratio of working Americans to retired Americans will decline to two to one. Most of this older population
is expected to remain living where they currently reside.
These baby boomers have dictated market and cultural trends because of their huge numbers and will
continue to do so. They generally have comfortable incomes and have accumulated wealth. They tend to
own their own homes, they will often leave their jobs with good retirement packages, financial assets,
fairly good health and expectations of continuing to work and participate in the community. Expect them
24 | Greenwood Comprehensive Plan: 2010–2040to call for increased efficiencies in government and school consolidation. Their household incomes are
currently $10,000 to $15,000 higher than the median for all households in the nation.
Moreover, with this older group, housing will be the major concern. The aging baby boomer will own,
and often be looking for small units with amenities—a quiet and quality living environment, wired for
high speed Internet access, and offering fitness centers, swimming pools, walking trails, etc.
On the other hand, the oldest baby boomer will turn retirement age in 2011. Although the group is
healthier than those that came before it, they will still require health and recreation facilities nearby.
Smart communities will beef up local healthcare facilities and develop recreation/cultural programs
designed to attract this demographic bubble to its community.
Greenwood will want to continue its efforts to become a Certified Retirement Community (funding issues
at the state level). There is no state income tax on qualified retirement income, including Social Security
and there is a bonus exemption on property taxes for people 65 and over. These, along with the state’s
mild winter climate, casinos, and natural outdoor amenities are attractions for retirees.
Composition by Sex
Table 8 provides data on the population by sex for Greenwood, Leflore County and the State of
Mississippi. As indicated, females comprise a larger percent of the population in Greenwood, Leflore
County and the State of Mississippi. The percent of females has decreased in all geographies noted from
1990 to 2000. The statistical significance of having more females than males is reflected in the age analysis
(higher percentage of children) and generally means that there are more children born in the community.
Table 8. Composition of the Population by Sex
Greenwood, Leflore County, and Mississippi, 1990-2000
Greenwood Leflore County Mississippi
1990 2000 1990 2000 1990 2000
Male 45.2 45.7 46.3 48.0 47.8 48.3
Female 54.8 54.3 53.7 52.0 52.2 51.7
Source: US Bureau of the Population, 1990 and 2000.
Educational Attainment
Sixty-six percent (66%) of those 25 years of age and older in Greenwood have completed high school.
This compares to 80% for the nation and 73% in the state of Mississippi. Only 18% have completed a
Bachelor’s degree or higher, compared to 24% for the nation and 17% for the State of Mississippi. The
relationship between education and poverty is well documented.
According to a white paper on solving the poverty problem in Mississippi by Marianne Hill, Ph.D.,
Mississippi Institutions for Higher Learning, “education is basic to well-paid employment: high school
graduation is required for most jobs that pay a living wage.” She continues, “…heads of households are
likely to find that earning certificates and degrees beyond a high school diploma is the most feasible
means of enhancing employability and earning ability.”
Mississippi has a net loss of over 1,000 college graduates per year to outmigration. To meet the goals for
the changing economy, the state and its communities must stem this tide. Mississippi is making
investments in resources that are then leaving, a double blow to the state. To turn this around,
Greenwood Comprehensive Plan: 2010–2040 | 25Mississippi’s communities need to become places that attract Mississippi college graduates to live, work,
raise families, and otherwise contribute to the local and state economy.
Table 9. Educational Attainment
Greenwood, State of Mississippi, and U.S., 2000
Greenwood Mississippi United States
High School Graduate or Higher 65.6% 72.8% 80.4%
Bachelor's Degree or Higher 18.1% 16.9% 24.4%
Source: U.S. Bureau of the Census, 2000
Chart 3. Educational Attainment
Greenwood, State of Mississippi, and U.S., 2000
120
100
80
%
60
40
20
0
Greenwood Mississippi US
High school graduate or higher Bachelor's degree or higher
Source: U.S. Bureau of the Census, 2000
26 | Greenwood Comprehensive Plan: 2010–2040Table 10. Dollar Amount Returned to State by Level of Education
State of Mississippi
Costs Dropout High School Some Bachelor's Graduate or
Diploma College or Degree Professional
AA Degree
K-12 Education $44,014 $52,702 $52,702 $52,702 $52,702
Cost
Medicaid & $38,712 $19,766 $17,595 $6,497 $5,775
Incarceration
School Cost $8,612 $24,120 $37,520
Beyond H.S.
Total Cost to State $82,726 $72,468 $78,909 $83,319 $95,997
Tax Returns to the $59,097 $87,412 $117,696 $177,445 $229,810
State
Net Returns to the -$23,629 $14,944 $38,787 $94,126 $133,813
State
Returns Per $1 $0.71 $1.21 $1.49 $2.13 $2.39
Invested
Source: Mississippi Institutions of Higher Learning
Other Growth and Performance Indicators
Building Permits
Building permits show the trends in new buildings as well as renovations, additions, demolitions and
signs by type (commercial, residential and industrial). The first number before the slash is residential and
the number after the slash is commercial. There was only one industrial construction permit issued, and
that was in 2005, as well as a sign for an industry in 2007 and an industrial addition in 2009. Two cell
towers were constructed in 2008.
Like the rest of the nation, Greenwood saw a drop off in new construction permits after 2008. The
recession has hit new residential construction hard and commercial is slated to follow unless there is a
turn-around in the economic situation. Greenwood continues to have an active code enforcement
program with regard to dilapidated housing as evidenced by the number of demolitions. A good
housing conservation program, however, as well as strong redevelopment strategies requiring a
sympathetic response to the existing neighborhood could help the city retain its significant historic
architectural fabric. Strong enforcement of the city’s Property Maintenance Code can help preserve
valuable affordable single-family housing, keep the city’s grid system development pattern intact, and
avoid problems associated with vacant lots.
Greenwood Comprehensive Plan: 2010–2040 | 27Table 11. New Construction Building Permit Trends by Type
City of Greenwood
Year Repair/ Addition New Demo Sign
Alteration
2005 54/16 40/10 21/9 6/1 0/20
2006 59/30 30/3 8/14 16/3 0/19
2007 64/28 37/3 9/12 15/2 0/20
2008 62/38 39/6 76/10 8/2 0/12
2009 64/23 32/7 3/15 20/1 0/12
2010 (to date) 26/7 12/1 5/2 3/2 0/7
Source: City of Greenwood Inspection Division.
ECONOMIC ANALYSIS
An understanding of Greenwood’s existing economy and its potential for economic growth is essential to
formulation of sound planning decisions. The growth of the City is primarily dependent upon its
economic potential. The amount of land required by different types of uses will be governed in a large
measure by the relative importance of various segments of the economy and by the number and character
of the city’s labor force. Similarly, the potential for expanding manufacturing, trade, and service activities
is the major determinant of the city’s future population, land use and traffic patterns.
The economic analysis contributes to a better understanding of the city’s ability to expand economic
development, and create additional sources of revenue. The analysis is essential to sound fiscal planning
as well as development of the physical plan for community growth. Sectoral components of the local
economy are examined here and these sectors have been identified as being either positive, near
equilibrium, or requiring imports.
Pull Factor
A common method for analyzing the health of a local retail sector is called the ‘pull factor’. Pull factors
measure the size of a local retail sector in relation to the local population it serves. They are calculated by
dividing a local area’s per capita sales by the statewide per capita sales, adjusting for local income
differences. A pull factor of greater than one (1) indicates that the local retail sector is selling to people
outside the local area. Conversely, a pull factor less than one (1) implies that local citizens are traveling
outside the city/county (area) to do some of their retail shopping, commonly known as retail ‘leakage’.
Table 12. Pull Factor by Geography
Greenwood and Mississippi
Population as FY 2008 Total 2007 Per Trade Area Pull Factor
of July 20071 Retail Sales2 Capita Capture
Income3
Mississippi 2,938,608 $47,087,215,758 $27,028 2,938,608 1.00
Greenwood 18,425 $381,778,975 $25,308 25,445 1.38
Source: 1U.S. Bureau of Census, Estimates of the Population of Counties, 2Mississippi State Tax Commission, Annual Report, FY 2008,
3Regional Economic Information System, Bureau of Economic Analysis, U. S. Dept. of Commerce (County level data).
28 | Greenwood Comprehensive Plan: 2010–2040Table 13. Pull Factor by Economic Sector
Greenwood and Mississippi
FY 2008 Retail Sales Trade Area Pull
Greenwood Mississippi Capture Factor
Automotive 84,387,412 6,083,872,883 43,531 2.36
Machinery, Equip, Supplies 33,379,807 2,962,977,289 35,355 1.92
Apparel & General Merch. 78,151,019 7,339,220,395 33,418 1.81
Misc. Retail 38,442,457 3,743,748,953 32,226 1.75
Food & Beverage 73,098,029 7,502,427,799 30,577 1.66
Public Utilities 34,773,872 4,225,267,647 25,828 1.4
Misc. Services 23,129,032 2,823,848,983 25,705 1.4
Furniture and Fixtures 7,062,232 959,992,238 23,087 1.25
Recreation 304,302 134,763,029 7,086 0.38
Lumber & Bldg Materials 6,658,886 3,423,567,374 6,104 0.33
Contracting 2,391,209 7,887,529,164 951 0.05
Total 381,778,260 47,087,215,758 25,445 1.38
Source: Mississippi State Tax Commission, Annual Report, FY 2008
A Special Look at Agriculture
The needs of agricultural enterprise created the conditions for the formation and development of
Greenwood. In addition to its role as the county seat, and as a regional shopping center, Greenwood still
relies on its role as an agriculture center that dominated its early economic life. Though employing far
fewer people than it once did, the income generated from agriculture and the spin off and support
enterprises still heavily influence the city today. As such, a brief orientation to current trends is helpful to
understanding the local economy.
Land and Production
Table 14 summarizes the trends related to land devoted to agricultural use. From 1997 to 2007, the
number of farms, land in farms and average size of farms increased in Leflore County.
Table 14. Agricultural Statistics
Leflore County, 1997 and 2007
1997 2001
Farms 246 296
Land in Farms 267,357 314,989
Average Size Farm 1,087 1,064
Farms by Size
1-9 acres 0
10-49 acres 26
50-179 acres 62
180-499 acres 71
500-999 acres 45
1000 acres + 92
Market Value of Ag Products Sold ($1,000) 162,062
Greenwood Comprehensive Plan: 2010–2040 | 29Selected Crops Harvested (acres)
Corn for grain 59,995
Corn for silage -
Wheat for grain 622,977
Oats for grain -
Sorghum for silage 3,154
Soybeans for beans -
Cotton, all 87,111
Forage 63,900
Rice 968
Sunflower seeds 10,375
Peanuts for nuts -
Vegetables harvested -
Land in orchards 171
Source: USDA, 1997, 2007 Census of Agriculture
Labor Force and Employment
Historical trends in labor force and employment in Leflore County from the US Bureau of the Census are
noted on Tables 15 and 16. More recent data for Leflore County is noted in the analysis.
Table 15. Employment by Occupation by Percent of Employed
Greenwood and Leflore County, 1999
Greenwood Leflore County
# % # %
Civilian population 16 years + 13,375 27,964
Management, professional, and related 2,085 32.1% 3,493 28.1%
Service 1,034 15.9% 2,005 16.1%
Sales and office 1,508 23.2% 2,919 23.5%
Farming, fishing, and forestry 59 0.9% 386 3.1%
Construction, extraction, and maintenance 367 5.7% 979 7.9%
Production, transportation, and material moving 1,436 22.1% 2,648 21.3%
Not in the labor force 6,037 45.2% 13,167 47.1%
Employed 6,489 48.5% 12,430 44.5%
Unemployed 841 6.3% 2,353 8.4%
Total 13,367 100.0% 27,950 100.0%
Source: US Bureau of the Census, 2000.
30 | Greenwood Comprehensive Plan: 2010–2040Table 16. Employment by Industry
Greenwood and State of Mississippi 1990
Category Greenwood Mississippi
# % # %
Agriculture, Forestry, Fishing, Hunting, Mining 153 1.4% 39,473 3.4%
Construction 428 3.8% 88,818 7.6%
Manufacturing 943 8.5% 215,203 18.3%
Transportation, Warehousing, Utilities 273 2.5% 63,189 5.4%
Information 148 1.3% 21,449 1.8%
Wholesale Trade 147 1.3% 39,717 3.4%
Retail Trade 1,150 10.3% 138,646 11.8%
Finance, Insurance, Real Estate, Rental, and Leasing 399 3.6% 55,744 4.8%
Professional, Scientific, Management, Administrative, 655 5.9% 60,557 5.2%
Waste Management
Educational, Health, Social Services 4,648 41.7% 236,382 20.1%
Arts, Entertainment, Recreation, Accommodation, Food 861 7.7% 97,698 8.3%
Services
Other Services 358 3.2% 56,215 4.8%
Public Administration 970 8.7% 60,223 5.1%
Source: US Bureau of the Census, 2000.
Manufacturing numbers continue to decline in Leflore County, and unemployment rates are on the
incline. The latest reported measure of unemployment from the Mississippi Department of Employment
Security is March of 2010 at 15.1%. The annual average unemployment rate for 2009 was 12.7%. The
civilian labor force in Leflore County is half of what it was in the last census. While manufacturing is
decreasing, retail trade, government, and agriculture, forestry and fishing are sectors that show slight
increases. The message in these numbers is that the city needs to look at the way in which wealth is now
generated in communities. With the omnipresence of the internet and a flexible population, commerce
can be conducted almost anywhere. Startup companies are looking for community amenities and an
educated workforce. Out of the box thinking is a must.
Greenwood Comprehensive Plan: 2010–2040 | 31Chart 4. Mississippi Employment by Major Industry
1990-2008
Thousands of Jobs
MFG Trade, Trans. & Utilities Services Gov.
Source: Mississippi Department of Employment Security..
Table 17. Top 12 Employers in the Greenwood Area Based on Employment
2003
Employer Type of Business # of Employees
Greenwood Public Schools Education 475
Greenwood-Leflore Hospital Health Care 1041
City of Greenwood Government 250
Viking Range Manufacturing 900
Mississippi Valley State University Education 500
Heartland Catfish Agriculture 400
America's Catch Catfish Agriculture 380
John Richard Manufacturing 250
Milwaukee Electric Tool Corp. Manufacturing 400
J.J. Ferguson Sand and Gravel Mining 260
CCA Prisons 240
Leflore County School District Education 475
Source: Mississippi Development Authority, Greenwood Leflore County Economic Development, 2009
Sales Tax
Sales tax revenue is the lifeblood of most general revenue budgets for cities in Mississippi, and
Greenwood is no exception. It is important to note that sales tax revenue is sensitive to the fluctuations in
the economy and should be treated as such. Sales tax revenue is also cash flow for cities because the
funds are received monthly as opposed to annually as is the case for property tax revenue.
From a development perspective, cities can make the mistake of trying to cure cash problems with
development at all cost, not factoring in the price of poor planning and development. Hoping to raise
32 | Greenwood Comprehensive Plan: 2010–2040revenue to help solve the problems caused by development (need for new infrastructure, increased
maintenance costs, etc.), cities rush to approve any development (and particularly those in outlying areas)
that will bring sales tax revenue into the city. This is shortsighted and should be avoided. Good quality
developments result in sustainable communities.
While finding new sources of revenue is important, Greenwood should make the most of its sales tax
gains by limiting the amount of investment is must make it servicing new businesses. The best way to do
this is to encourage infill development in those areas that already have city services. Offering property
tax abatements in areas needing redevelopment (downtown areas and historic districts are covered by
statutory ability to do this) could bring more sales tax income in without huge investments in new
infrastructure.
Table 18. Gross Sales by Industry Group
Greenwood, 2009
$ Amount # of Establishments
Apparel and General Merchandise $83,623,534 65
Food and Beverage $72,883,550 160
Automotive $65,311,491 107
Machinery, Equipment, and Supplies $36,665,810 40
Miscellaneous Retail $36,061,184 192
Public Utilities $35,217,238 4
Miscellaneous Services $20,386,005 46
Furniture and Fixtures $6,340,595 16
Lumber and Building Materials $5,987,352 27
Contracting $2,710,011 19
Total $365,186,770 676
Source: Sales and Tax by Industry Group, Mississippi State Tax Commission, 2009.
Personal Income
Table 19 indicates that median family, household and per capita incomes in Greenwood, and the State of
Mississippi. Greenwood has underperformed the state in all income categories for 1989 and 1999.
Table 19. Income Trends (MFI, MHI, PCI)
Greenwood and State of Mississippi, 1989 and 1999
Greenwood Mississippi
1989 1999 1989 1999
Median Family Income $21,311 $26,393 $24,448 $37,406
Median Household Income $15,398 $21,867 $20,136 $31,330
Per Capita Income $10,749 $14,461 $9,648 $15,853
Source: US Bureau of the Census, 1990-2000.
Note: Median Family Income refers to the median family income for all families. A family includes one
adult household member (the householder) and one or more persons living in the same household who
are related to the household owner by birth, marriage, or adoption. Per Capita Income is the mean
Greenwood Comprehensive Plan: 2010–2040 | 33income computed for every man, woman and child. Household income is the sum of money income
received in the calendar year by all household members 15 years old and over, including household
members not related to the householder, people living alone, and other nonfamily household members.
Included in the total are amounts reported separately for wage or salary income; net self-employment
income; interest, dividends, or net rental or royalty income or income from estates and trusts; Social
Security or Railroad Retirement income; Supplemental Security Income (SSI); public assistance or welfare
payments; retirement, survivor, or disability pensions; and all other income.
The percent of households receiving public assistance in Greenwood is one and a half times the percent
for the state as a whole. Movement from reliance on public assistance to earned income is critical to a
community moving its citizens from poverty to well functioning, economically. The impact is circular
and affects all social factors, including education, housing, etc.
Table 20. Public Assistance Income by Percent of Households
Greenwood and State of Mississippi, 1989 and 1999
Greenwood Mississippi
1989 1999 1989 1999
With public assistance 21.1% 6.4% 13.0% 3.5%
Without public assistance 78.9% 93.6% 87.0% 96.5%
Source: US Bureau of the Census, 2000
Income is an important indicator of how well a community is performing. The correlation between
Greenwood’s education levels and income levels are important to note. Table 21 shows the relative value
of having advanced degrees to earning more income in the state of Mississippi.
Table 21. Relationships of Median Earnings to Education Level
State of Mississippi
Education Level Median Earnings % Employed
Not a high school graduate $20,285 48.2%
High school graduate $23,381 67.0%
Some college $26,850 74.2%
Bachelors degree $34,411 82.2%
Advanced degree $41,816 85.9%
Total working full time, age 21-61 $26,285 68.4%
Source: US Bureau of the Census, 2000
34 | Greenwood Comprehensive Plan: 2010–2040General Land Use in Greenwood
Residential
Residential use occupies the largest segment of Greenwood’s land. According to the 2000 Census,
approximately 50.8% of the housing units in the city are rental and 49.2% owner-occupied. The city has
numerous multi-family developments, and this can be a concern as more stable communities tend to have
higher percentage of home ownership.
Commercial
Commercial uses appear (1) in the Central Business District, (2) in “strip” developments along the city’s
major arterials, and (3) in scattered areas, including neighborhoods, throughout the city.
Development of measures to eliminate commercial activities where they are incompatible with the
healthy development of the surrounding area is an important goal of the Comprehensive Plan. In
addition, because of the scope of vacant, deteriorating and dilapidated structures, it is critical that the city
create policies that encourage infill development and rehabilitation of buildings. Mixed uses are a good
alternative and help create a more walkable and bikeable community. They should generally be part of
an overall strategy or master plan, and accompanied by good design standards.
Future expansion of the Central Business District probably will occur through property conversions and
rehabilitation of existing properties. Any adjacent land slated to transition commercial around the CBD
should be zoned for that type of commercial (as opposed to a highway commercial type zone). It is
recommended that buildings stay as much the same as possible to retain the fabric of this community
through design standards and the existing and expanded Historic Preservation ordinance/districts as
well as through the Main Street Program.
Strip commercial patterns should be avoided for any new commercial areas. For already established
commercial strip areas, like Highway 82, infill commercial developments should be master planned, if
possible.
Industrial
Heavy industrial uses comprise those uses that generate smoke, noise, odors, and fumes or have other
similar objectionable qualities. Light industries are more compatible with business and other industrial
uses in terms of objectionable characteristics.
Although most of the city’s industry is now located in clusters in the industrial park, there are scattered
sites throughout the city (some obviously just storage areas) that should become non-conforming uses,
especially if the prospect of them being used for industrial production activities is doubtful. Given the
projections for manufacturing employment in the state, county and city, it is not anticipated that there
will be a need for additional land for manufacturing. However, Mississippi Valley State University may
provide some possibilities for applied research and manufacturing activities. The city should focus on
luring corporate headquarters to Greenwood, but must first deal with recruitment issues, like improving
curb appeal in the city and improving the education system.
Public and Semi-public
Land uses in these categories include governmental uses, fire stations, public buildings, churches, and
private clubs. The total amount of land devoted to public buildings is not a particularly important
consideration. Projections for future needs for public buildings, where needed, are made in the public
facilities portion of the plan.
Greenwood Comprehensive Plan: 2010–2040 | 35According to the National Recreational Association, a city should provide one acre of land devoted to recreational uses for each 100 residents. Based on the current population of the city, parklands appear to be sufficient. With a goal of providing more open space, the city should have some scattered smaller green spaces, which might be accomplished with redevelopment efforts. These areas need not have any activities associated with them other than a walking track, seating or public garden. Flood Plains and Water Almost all of the constrained lands in the city are in the floodplain or floodway. Steep slopes are not a developmental issue for any type of development. There is ample land available for all types of development, especially if the city adopts of a policy of encouraging infill development and rehabilitation of existing buildings. Prime agricultural lands are an important part of Greenwood’s economy and should not be encroached upon for urban development while there are existing vacant lands or rehabilitation possibilities in the city. Vacant Land Two basic types of vacant lands exist in the City of Greenwood: infill lands and frontier, or outlying lands. Infill land is that land which exists in developed areas of the city and has either never been developed or has previously been occupied but now lies vacant due to removal or deterioration of structures. Infill land is usually serviced by existing municipal services and streets. Infill development is often associated with neighborhood and commercial revitalization strategies. Frontier land is that which lies at the edge of existing development on the fringes of the city. This land is eligible for development but usually requires the extension of municipal services and the construction of roads. Some infill opportunities and redevelopment possibilities exist in the older neighborhoods and commercial areas where properties have deteriorated or have been vacant for a while. There is especially a need for redevelopment attention to lots and buildings in the downtown area. If the city follows the consultant recommendation to adopt site and design standards and an amortization schedule for sign control, redevelopment could be a great tool for improving both the function and the aesthetic appeal of Greenwood. An issue of vital concern to the city is the lack of land use planning, codes and ordinances in the county. The city should place conditions on the extension of sewer to these areas and work with the county to jointly plan and control development. The city should not consider annexing unless it is to control development on the outskirts of town or if there is a revenue producing activity planned for the area. Requests for sewer and/or water service or annexation should be accompanied by requirements to develop to city standards, including site and design review, if adopted. Summary The City of Greenwood has experienced frontier development, particularly along Highway 82 West, and redevelopment in the downtown area, which is now thriving again. Continued efforts at redevelopment of some beautiful older buildings in the downtown area will pay big benefits. Other beautification efforts, as well as the adoption of strong policies to require good town design in new and redeveloping projects will increase Greenwood’s potential for economic success in the new economy. The adoption of Site and Design Standards and a Sign Ordinance will greatly improve Greenwood’s economic possibilities in the new economy. The city needs to become a destination of choice for the young, entrepreneurial and creative. Rezoning strategies to help move incompatible uses out (such as industrial that is no longer feasible) can be an effective tool to redevelop areas. 36 | Greenwood Comprehensive Plan: 2010–2040
Transportation Facilities
Automobile Circulation
The City is served by U. S. Highway No. 82 (east-west) and 49 (north-south), and Mississippi State
Highway 7, as well as a series of local arterials, collectors and local roads.

Recommended Improvements
Traffic counts on Table 22 show the changes in traffic counts in the ten-year period between 1999 and
2009. The highest traffic counts in the city are on Highway 82 in front of Greenwood-Leflore Hospital,
Highway 82 east in front of Greenwood Country Club, between the river and Park Avenue and in front of
Wal-Mart.

It is recommended that the city adopt policy that promotes a grid system of streets with many options for
route choices. Reducing choice, particularly in neighborhood streets, causes undue traffic congestion. In
addition, Greenwood can put some of its streets, like Robert E. Lee, on a “road diet.” These wider streets,
once thought to be necessary to carry ever-increasing volumes of traffic, are too wide and promote
speeding. Bike lane striping

Lighting along Highway 82 should be reviewed with MDOT, as it is unnecessarily dark around the
overpass area and certain entrances into town, including Main Street and Highway 7.

Changes in traffic volume over the last two years are noted in the following table:

                     Table 22. Traffic Volume Trends by Selected Studied Roadways
                                         Greenwood, 1997 & 2008
         Name of Street                                                              1997                     2008
         Highway 82 East                                                             8,800                   24,000
         Highway 82 East (Greenwood CC)                                             17,000                   19,000
         Highway 49 East (S. of 82)                                                  8,600                    7,200
         Highway 82/7/49E                                                           21,000                   24,000
         Highway 82/7/49E (between Claiborne and Park)                              23,000                   19,000
         Highway 82/7/49E (Walmart)                                                 16,000                   17,000
         Park Street                                                                12,000                   13,000
         Claiborne Street                                                           57,000                    6,700
         Highway 7                                                                   9,800                   11,000
         Grenada Street                                                              6,900                    6,900
         Carrollton Street                                                           8,700                    6,200
         Fulton Street                                                               8,900                    8,100
                     Source: Average Daily Traffic Counts, Mississippi State Department of Transportation.

                                                                                Greenwood Comprehensive Plan: 2010–2040 | 37
Functional Classification of Streets and Highways
Streets and highways serve two separate and conflicting functions, one to carry traffic and the other to
provide access to abutting property (land use). The more traffic a road carries, the greater the difficulty
in accessing property directly from the road. As the number and density of access points increases, safety
is compromised and speed limits need to be lowered, reducing the traffic carrying capacity of the street or
highway. Streets and highways are classified by function. This ranges from the sole purpose of carrying
traffic to that of primarily providing access to property. Classification is important as it is used as a
reference point in the Zoning Ordinance and the Subdivision Regulations. Future streets may be
provided by several methods. First, land for future streets may be acquired by condemnation and
eminent domain proceedings in which the City purchases property for street construction. Secondly,
future streets may be mapped on the Future Land Use and Transportation Plan. This method permits
reservation of rights of way. No development may occur on planned rights of way. Enforcement of this
legislation is accomplished using the Subdivision Regulations and by refusing building permits that
encroach in mapped rights of way.
New streets will be constructed primarily in association with new private development. The location and
function of these streets should strictly adhere to the design standards for streets contained in the
subdivision regulations. Traditional Neighborhood Developments and other planned developments may
have narrower streets, especially if some of the transportation is handled via walking and biking. It is
recommended that alleys be permitted in neighborhoods to help carry out other policies. Narrower
streets will not need extensive rights-of-way, as they are not intended to become larger streets in the
future. The narrower roads will have an added benefit of reducing the amount of impervious surface,
reducing storm water runoff and associated pollutant loads. They will also be less expensive to build and
to maintain. Narrower streets also tend to lower the speed of vehicles and act as traffic calming devices.
When designed properly, they can easily accommodate emergency vehicles.
Following is a generally accepted classification and functional characterization of highways and streets:
Major Thoroughfare—A street or highway designed and given preference to carry traffic, but also
providing access to abutting property. Cross traffic is accommodated at at-grade, signalized intersections
for streets with high traffic levels, and at at-grade intersections without signals, for streets with moderate
or low traffic levels. If intersections do not have signals, through traffic flow is given preference to the
principal arterial.
Access Controlled—A fully access-controlled highway designed for high-speed travel with the
sole purpose of facilitating non-stop traffic flow without obstruction from cross traffic. Access is
not provided to abutting property and access is only provided to other streets or highways at
grade-separated interchanges. Freeways are a design type of Major Thoroughfare.
Limited Access—A partially access controlled highway designed for high-speed travel for the
sole purpose of facilitating traffic flow with minimal obstruction from adequately spaced cross
traffic. No access is provided to abutting property and access is provided to other streets or
highways at grade-separated interchanges for streets with high traffic levels, at at-grade,
signalized intersections for streets with moderate traffic levels and at at-grade intersections
without signals, for streets with low traffic levels. Limited access roads are a design type of
Major Thoroughfare.
Major Street—A street or highway designed to both carry traffic and provide access to abutting property.
Cross traffic is accommodated at at-grade intersections without signals for streets with low traffic levels.
The primary purpose of the major street is to serve moderate length neighborhood trips and to channel
traffic from collectors and local streets to major thoroughfares.
38 | Greenwood Comprehensive Plan: 2010–2040You can also read