THEORETICAL FRAME WORK OF LOGISTICS INDUSTRY IN INDIA - AN OVERVIEW - Shodhganga
←
→
Page content transcription
If your browser does not render page correctly, please read the page content below
36

                               CHAPTER 3

       THEORETICAL FRAME WORK OF LOGISTICS
             INDUSTRY IN INDIA – AN OVERVIEW

3.1      INTRODUCTION

         In olden days logistics was local, involving storage and material
movement from one city to another city by train or truck. The lowering of
trade barriers by various countries, combined with rapid advances in global
transportation and information technology, has led to the proliferation of
global manufacturing networks. Now manufacturing and services are global
to take advantage of low cost wage structures and also to reach the local
markets. In global manufacturing of this kind, components may be sourced
from several countries, assembled in yet another country, and distributed to
the customers all over the world. Information transfer regarding the location
and status of moving inventory, payments and also the customs paper work
plays a big role in efficient logistics. These networks are not generally under
single ownership but are group formations of independent companies in
alliance for a specific and special purpose. They compete with similar
cooperating networks. Such networks are common in all industrial sectors
including the automobile, pharmaceutical, aero-space, electronics, computer,
food, and apparel industries. Thus, logistics and supply chain management are
of fundamental importance to any economy.

         Since logistics involves global movement of materials, information
and funds from country to country, it requires excellent state – of - the - art
37

country infrastructure such as Airports, Seaports, Internet and other IT and
finance related facilities. Having good logistics infrastructure culture becomes
a prerequisite for attracting global manufacturing and service companies in
the country.

          Increasing globalization and competitive pressures have forced
businesses in all the sectors of global economy to focus on the improvement
of their operations. Logistics aims not only to reduce their costs but also to
attain greater differentiation in their service offerings. In fact, the success of
today’s market leaders such as Wal-Mart, Dell, Cisco and Toyota is primarily
based on their superior operational and logistics capabilities. Also, several
successful countries have developed world class infrastructural facilities in
terms of physical facilities such as airports and sea ports and also in terms of
the IT infrastructure. India should proactively attract investments by
following the Supply Chain Cluster Paradigm, where in all the stakeholders in
the supply chain such as manufacturers, logistics providers, financial
institutions, etc., are co located in the region, creating a value chain of
excellence which is difficult to replicate. The facilities in the cluster can be
built simultaneously through careful planning rather than sequentially.

          Logistics is defined as the broad range of activities concerned with
effective and efficient movement of semi-finished or finished goods from one
business to another and from manufacturers/distributors/retailers to the end
consumers. The activities within the sphere of logistics include freight
transportation, warehousing, material handling, protective packaging,
inventory control; order processing, marketing, forecasting, and customer
service. The Council of Logistics Management (CLM) has also formulated
the following definition of logistics with a flow and process orientation.
38
“The process of planning, implementing, and controlling the
efficient, cost-effective flow and storage of raw materials, in-process
inventory, finished goods, and related information and financials from point
of origin to point of consumption for the purpose of conforming to customer
requirements”
3.2 COMPONENTS OF LOGISTICS SYSTEM
Components of Logistics System (CLS) provide an overview of the
logistics system. Logistics services, information systems and
infrastructure/resources are the three components of this system and these are
closely linked. The interaction of these three main components in the
Logistics system is interpreted as follows. Logistics services support the
movement of materials and products from inputs through production to
consumers, as well as associated waste disposal and reverse flows. They
include activities undertaken in-house by the users of the services (e.g.
storage or inventory control at a manufacturer’s plant) and the operations of
external service providers. Logistics services comprise physical activities (e.g.
transport, storage) as well as non-physical activities (e.g. supply chain design,
selection of contractors, freightage negotiations). Most activities of logistics
services are bi-direction. Information systems include modeling and
management of decision making. The important issues which are concluded
in the information system are tracking and tracing. They provide essential
data and consultation in each step of the interaction among logistics services
and the target stations. Infrastructure comprises human resources, financial
resources, packaging materials, warehouses, transport and communications.
Most fixed capital is for building those infrastructures. They conantrate on
foundations and basements within logistics systems. Figure 3.1 Overview of
Logistics System (source: BTRE, 2001).39
Figure 3.1 Overview of Logistics System (source: BTRE, 2001)
3.3 LOGISTICS INDUSTRY CHARACTERISTICS
1. The Indian logistics sector is fragmented. Two-third of the
total trucks are owned and operated by transporters with fleets
smaller than five trucks. The result is intense competition, low
freight rates and thin profitability.
2. The logistics cost in India is still high when compared with
developed markets owing to a non-conducive policy40
environment, extensive industry fragmentation and
infrastructure inadequacy.
3. The sector employs (directly and indirectly) about 40 million
people.
4. The sector sees on increased productivity through growing
investments in GPS tracking, radio frequency identification,
online analytics and new supply chain tools.
5. The entry of global logistics players in India is helping local
companies to benchmark against global standards.
3.4 CATEGORIES OF LOGISTICS INDUSTRY
The logistics industry in the country is divided into across the
following categories:
3.4.1 Express Cargo
The need for quick service has catalyzed the growth of India’s $1.6
billion express service cargo industry, growing at a rate of 20-25% and is
expected to be more than double by 2012. Globalization has prompted Indian
companies to integrate their supply chains with international markets,
increasing the demand for relevant logistics services. According to the
Planning Commission, India’s air cargo movements would grow at over
CAGR of 11.5% from 2007-08 to 2011-12.
3.4.2 Multimodal Transport Operator
The annual size of India’s multimodal transportation segment is
around three million containers, still considered to be nascent with an41
attractive potential. This industry is considered attractive as it is not capital
intensive, does not require considerable working capital and generates a
reasonable return-on-employed capital.
3.4.3 Warehousing
Warehousing accounts for about 20% of the Indian logistics industry
and occupies around 40 million sq. ft. The development of the modern retail
sector, escalating growth in commodity markets and a paradigm shift in
consumer preference from fresh to processed foods have necessitated storage
expansion. Special Economic Zone (SEZ) development is an another primary
warehousing driver as modern warehouses have moved beyond traditional
stocking and loading to other value-added services (packaging, labeling,
bundling and cross docking). The warehousing business, growing at 35-40%
annually, is expected to become a $55 billion industry in three to four years
with more than 50 million sq. ft in warehousing space and more than a
hundred logistics parks.
3.4.4 Third Party Logistics
Thirty Party Logistics manages the logistics activities of the third
parties. The $58-million Indian 3PL industry caters to around 55% of Indian
companies that outsource logistic services like supply chain management and
warehousing. 3PL reinforces supply chain management, widens market share,
reduces conventional logistic costs and makes it possible for companies to
expand into new markets, increasing logistics challenges. India’s outsourcing
of third party logistics (3PL) is expected to grow into a $90 million business
by 2012.42
3.4.5 Road Transportation
A railway has remained a dominant mode of transport in India over
the past few decades, but recently a roadway has gained a significant share
(more than 60% - inland transportation), while railways has lost its market
share due to the following reasons:
Greater coverage when compared to any other mode of
transport.
Higher flexibility in terms of door-to door delivery, giving it
an edge despite higher effect.
Lower risk of handling loss, due to lesser loading and
unloading of goods investments made by the government in
the National Highway Development Projects (NHDP).
3.4.6 Railways
Indian Railways moved around 850 million tones of freight in 2008
compared to 785 million tones in 2007 and targets 1,100 million tones by the
end of the Eleventh Plan. Although railways are more energy-efficient and
environment-friendly, they face stiff competition from the road sector.
3.4.7 Air Cargo
The air transport sector contributes over 0.2% to India’s GDP at
constant prices (1999-2000). The air cargo business expanded at nearly 19%
during the 2006-08 period, overtaking ocean freight (10.3%) and rail freight
(9.2%). India’s leading trading partner regions are Europe, Asia, the Middle
East and North America. India’s air cargo movement is expected to grow at
over 11.5% CAGR from 2007-08 to (13.5%) 2011-12, owing to rapid
international air cargo traffic growth fuelled by a growth in export of gems43
and jewellery, special chemicals and high-value pharmaceuticals (Source:
Planning Commission). The IATA predicts that 57% of the world's air freight
would move to Asia by 2011, India playing a major role..
3.4.8 Ocean Cargo
The Indian shipping industry is the backbone of the country’s EXIM
trade. With 12 major and 187 minor ports as well as a 750-km coastline,
ocean freight is an important economy driver. In turn, this has impacted the
country’s port development, leading to the global ownership and management
of port terminals. The surging Asian and Indian economies have grown up
containerised vessel demand in recent years, bolstered by a strong demand for
shipping raw materials and the export of finished goods in the world’s second
fastest growing economy. According to recent estimates, the growth rate of
Indian ports would be around 160% in 2011-12. Cargo handling in major
ports is expected to grow at 7.7 per cent till 2011-12 and cargo movement is
estimated to reach 877 million tons by 2011-12.
3.4.9 Growth drivers
India’s logistic services sector is expected to develop on account of
growth in the organized retail, manufacturing and infrastructure sectors.
Besides, new generation companies outsource reverse logistics, inventory
management; order processing, distribution and labeling and packaging,
widening logistics service requirements.
3.5 ORIGIN AND DEVELOPMENT OF LOGISTICS INDUSTRY
Logistics was initially a military activity, concerned with getting
soldiers and munitions to the battlefront in time for flight, but it is now seen
as an integral part of the modern production process. The main background of44
its development is that, the recession of America in the 1950’s caused the
industry to place importance on goods circulations. The term, logistics, was
initially developed in the context of military activities in the late 18th and
early 19th centuries and it launched the military logistics of World War II. The
probable origin of the term is from Greek logistikos, meaning ‘skilled in
calculating’. (BTRE, 2001) Military definitions typically incorporate the
supply, movement and quartering of troops in a set. And now, a number of
researches were taken and made logistics applications from military activities
to business activities. Business logistics was not an academic subject until the
1960s. A key element of logistics, the trade-off between transport and
inventory costs, was formally recognized in economics at least as early as the
mid-1880s. (BTRE, 2001) Based on the American experience, the
development of logistics could be divided into four categories, viz, showing
the following Figure 3.2.
Figure 3.2 Logistics historical development
Before the 1950S, logistics was under the dormant condition.
Production was the main part of the managers concerned, and industry
logistics was once regarded as “necessary evil” in this period. During the
1950s to and 1960s, applying new ideas of administration on business was a
tendency. Drucker (2001), who thought Logistics was The Economy’s Dark
Continent, regarded the procedure of physical distribution after producing
products as the most possible development area in American businesses but45
also the most neglected area. Lewis’s study (cited in Chang, 1998) in 1956 on
the role of air transportation in physical distribution was the application of
“total cost concept” and it pointed out the notions of trade-off between
inventory and transportation. From 1970s onwards, more and more
applications and researches of logistics appeared. Due to petroleum price rise
in 1973, the effects of logistics activities on enterprises grew. Slow growth of
market, pressure of high stagflation, release of transportation control, and
competitions of the third world on products and materials all increased the
significance of logistics system on planning and business at that time. The
further tendency of logistics in the early 21st century is Logistics Alliance,
Third Party Logistics (TPL) and Globalised Logistics. Logistics circulation is
an essential of business activities and sustaining competitiveness. However, to
conduct and manage a large company is cost consuming and not economic.
Therefore, alliance of international industries could save working costs and
cooperation with TPL could specialize in logistics area.
3.6 GLOBAL LOGISTICS INDUSTRY
Currently the annual logistics cost of the world is about $ 3.5
trillion. For any country, the annual logistics cost varies between 9% and 20%
of the GDP, the figure for the US being about 9%. The global logistics market
sizes in 1992, 1996 and 2000 were US$ 10 billion, $ 25 billion and $ 56
billion, respectively. In 2003 and 2004, the corresponding figures were $ 270
billion and $ 333 billion, registering high growth rates. Though, most of the
large LSPs are headquartered in Europe, the US logistics market is the largest
in the world capturing one-third of the world logistics market. In 2003, it was
about $ 80 billion. In 2004, it grew up to $ 89 billion, and in 2005, it
registered an impressive growth rate of 16% to cross the $ 100 billion mark
for the first time and reach $ 103.7 billion (Foster and Armstrong, 2004, 2005,
2006). However, considering the fact that the logistics market in the US is46
about 10% of its annual logistics cost (Foster and Armstrong, 2006), there is
still immense potential for the growth of 3PL in the US in particular, and in
the world in general.
3.7 THE LOGISTCS INDUSTRY IN INDIA
Logistics is fundamental to the performance of the economy and is
crucial in matching the production of goods to the industrial demand
(as inputs) and households (as private consumption). Logistics activities
represent a substantial value added economic process. The competitive supply
of logistics services is also critical in to contributing the efficient and effective
industrial activity through innovative logistical solutions and reducing the
cost of goods and services to households. The major logistics functions for the
Indian industries include transportation, warehousing, freight forwarding and
other value-added operations like Management Information Systems (MIS).
Of these functions, transportation and freight forwarding have been
traditionally outsourced to external service providers with relevant expertise
and infrastructure. Apart from the traditional transport service providers who
provide transportation services to the industry, the fast emergence of 3PL and
4PL which provide end-to-end logistics solutions indicates that companies are
leaving the logistics functions to the experts and focus on their core
competencies. The warehousing and MIS functions have been mostly
managed in-house by the industries. The spread of organised retail industry
necessitates the specialised logistics functions, specialised transportation like
refrigerated vehicles, operation of hub and spoke model for distribution, JIT
logistics, etc. Therefore, delivering the right product at the right time, at the
right place and at the right cost helps to achieve better logistics efficiency.
The logistics performance or efficiency can be measured by the cost, time and
service quality.47
Logistics has been becoming efficient only since the globalization
wave of the early 1990s and hence, the businesses supported by it, worldwide,
have been pushed for competitive balance-sheets, providing consumers a
better product/service and yet adding value to its investors. Triggering intense
competition, globalization coupled with liberalization, forced both private and
public firms to commit themselves to make available to their customers the
right material of right condition, at the right time and place at the lowest cost.
The World Bank, in a recent survey Connecting to Compete: Trade
Logistics in the Global Economy, has developed a Logistics Performance
Index (LPI) that can serve as a benchmarking tool for measuring performance
of businesses along a country‘s logistics supply chain. The Bank study asserts
that countries that are able to connect to the global logistics web would not
only have access to vast new markets but also remain a part of the global
trade growth. The report avers that it is not the income of nations but their
undergoing trade expansion that determines their logistics efficiency, as the
survey shows that nations with increasing trade (imports and exports) to GDP
emerged as the out-performers on the LPI scale relative to their income levels.
It also warns that those countries whose links with the global logistics chain
are weak are bound to face large and growing costs of exclusion from
international trade. India trails behind China on important indices such as
customs procedures, overall infrastructure quality, international shipment,
logistics competence and tracking of shipments, but is ahead of the latter on
the domestic logistics efficiency front. Healthy economic growth in India is
increasingly supported by robust industrial growth. One of the relatively
lesser known but significant sectors that support almost all industrial activity -
the logistics sector - is also witnessing this growth as a follow through.
However, not withstanding its importance and size ( 4 trillion), it has
traditionally not been accorded the attention it deserves as a separate sector in
itself.48
Extensive fragmentation meant the incapacity of industry players to
develop the industry as a whole and poor support infrastructure, such as roads,
ports and telecom, led to a situation where the opportunity to create value is
limited. However, much of this is changing with the government now
demonstrating a strong commitment towards providing an enabling
infrastructure and creating conducive regulations. There is a significant
current and planned investment in infrastructure to the tune of ( 15 trillion)
over the next few years and an increased emphasis on public-private
partnership. At the same time, regulations around rationalization of tax
structures and prevention of overloading for example are creating an
environment of positive change. Players now gave the opportunity to leverage
economics of scale, complemented with better infrastructure, to provide
integrated logistics solutions which are cost effective. In addition, the
evolving business landscape and increasing competition across industries, is
creating the need for more efficient and reliable logistics services than what
exist today. For example, rapid growth of organized retail and the need to
reach out to the large untapped rural markets in India are necessitating
development of strong back end and front end supply networks.
Fundamentally, a fragmented industry with low average scale - and
consequent limited investment and market development capability - is worst
placed to serve these needs. It is not surprising, therefore, there is a frantic
pace of consolidation and organic growth that the industry is witnessing while
logistics service providers are struggling to keep pace with the growth,
logistics service users with limited or no outsourcings are finding it
increasingly difficult and or undesirable to manage this non-core activity in
house. The result is a wide need gap that is seemingly widening much faster
than it is being filled. It is in this context that capability development of
logistics service providers assumes critical importance. While rapid
development across all dimensions of organizational capability will be49
required to achieve and sustain demand growth, Logistics, being a service
industry, manpower capabilities assumes utmost 5 importances. The sector
currently employs about 40 million people, a number that will rise rapidly
with exponential growth expectations in the sector. A look at the financials of
a set of 80 logistics companies in India across sectors reveals that manpower
spends comprise 8-10 percent of overall sales of the sector. This roughly
translates to about an INR 500 billion spend on logistics manpower in the
country annually. Only about 13 -14 percent of the overall manpower costs
are spent on non salary, manpower development items (welfare, training etc.).
This share for the unorganized companies would expectedly be much less. As
against this leading global logistics companies spend around 20 percent of
their employee expenditure on non-salary items. This lack of focus on
developing manpower and skills for the logistics sector has resulted in a
significant gap in the numbers and quality of manpower in the sector. This
gap, unless addressed urgently, is likely to be a key impediment in the growth
of the logistics sector in India, and in consequence, could impact growth in
industry and manufacturing sectors as well. This underscores the need for
identifying areas where such manpower and skill gaps are critical, and
developing focused action plans to improve the situation. In the next section,
we analyze each segment of the Logistics sector in India to identify the skill
gaps that exist in each. These gaps are then prioritized to identify key focus
areas, and the action that needs to be taken to bridge the gaps.
3.8 SIZE OF THE LOGISTICS MARKET IN INDIA
Indian Supply Chain and Logistics Industry is more than $ 100
Billion in size and is the backbone of Indian Economy. Our industry is
growing at a rate of 8-10% annually and has been a crucial contributor for the
growth and development of the Indian economy. In the near future,
Traditional Logistics Services like Transportation and Warehousing would50
continue to grow at a good rate. However, the big ticket growth would come
from the Value Added Logistics Services (VALS) in the near future. At
present, Outsourced Logistics accounts for only one-third of the total
Logistics market in India, which is a significantly lower proportion vis-à-vis
the developed markets. Growth in this industry is currently being driven in
India by over $ 300 billion worth of infrastructure investments, the phased
introduction of Value Added Tax (VAT), the development of organized Retail
and Agro-processing industries, along with a strong manufacturing growth. In
addition, we expect strong Foreign Direct Investment (FDI) inflows in the
Indian markets, which would lead to increased market opportunities for the
providers of Third-Party Logistics in India. Therefore, India possesses
substantial opportunities for growth in the Supply Chain & Logistics industry
in the coming years.
3.9 MAJOR PARTICIPANTS IN THE INDIAN LOGISTICS
INDUSTRY
The major participants in the Indian logistics industry are listed out
below
3.9.1 TNT Express
This company is a key leader in the international market in the
sector of global express services. The company ensures safe and on time
delivery of documents, freight and parcels. The company offers time and day
definite delivery in about 200 nations across the world. It operates 47 jet
freighter aircraft and 26,000 road vehicles and has a network of 2,300
companies.51
3.9.2 AFL
One among the acknowledged leaders among the logistics
companies in India is AFL. Through its domain of logistics services, the
company has delivered world class service in India. In 1979, the company
introduced the first ever courier service by forming an alliance with DHL
World Wide Express. The company offers services like Logistics and
warehousing, Courier Company and Custom Consultant.
3.9.3 DHL
This company is one among the major logistics companies in India.
It is globally a market leader in overland transport, air freight and
international express. The company ranks No.1 in the world in the contract
Logistics and Ocean Freight. The biggest Logistics and express network in the
world has a network in about 220 territories and countries, 72,000 vehicles,
350 Aircrafts, 36 hubs and 4,700 bases.
3.9.4 Blue Dart
This Logistics Company is South Asia's top integrated express, a
Package Distribution and Courier Company. The domestic network of the
company covers about 21,340 locations and provides service to 220 countries
sales alliance with DHL. It provides the best service like Free Pick up from
the location, regulatory clearances, real time tracking, free computerized
proof of delivery etc.
3.9.5 GATI
The company is a key leader in the arena of express cargo delivery
and a significant one in the supply chain management solutions and52
distribution in India, since 1989. This company provides services like Ware
Housing and Express Cargo. Logistics Solutions of the company are
Warehousing and Supply Chain Management. The Distribution Solutions of
the company are Gati Surface Express, Gati Coast to Coast and Gati Air
Express etc.
3.9.6 Self-Express
It is one of the largest express companies in India. This company
offers the best and integrated logistics solutions. In 2002, the Limca Book of
Records declared the company as the Largest Logistics Service Provider in
India. The company has a network over 550 locations in 28 states and in 7
countries.
3.9.7 Ashok Leyland
The leading provider of logistic vehicles for the Indian Army is
Ashok Leyland. It is a key leader in the tractor-tailers and multi axle trucks.
This company manufactures buses, trucks, engines and special application
vehicles in India. It is promoting a new company called Ashley Transport
Services Ltd., for exchange of information and integrated services related to
logistics in order to tackle the business of freight contractors.
3.9.8 Agarwal Packers and Movers
This popular Indian logistics company provides logistic services like
the home shifting, car packing etc. across India. The company believes in
keeping technology and people and of course heart and soul in the movement
of the individuals respective items. It offers quality service in transportation
and packing.53
3.9.9 DTDC
The biggest Domestic Delivery Network Company is DTDC. It
offers high class delivery service in about 3700 Indian locations and 240
international locations. It dispatches about 10 million parcels in a month. It
also offers low cost for bigger parcels to US, UK, India, Nepal, Dubai and
other places across the world.
3.9.10 First Flight
This logistics company in India specializes in courier services
worldwide. The multi-tracking programs of the company are Domestic,
International, First Wheels, First Wings and many others. The overseas
offices of the company are in Malaysia, Singapore, UK, US, UAE, Quatar and
Oman.
3.10 REASONS FOR THE DEVELOPMENT OF LOGISTICS
Logistics has forced the business organization to revaluate their
business process and the way of delivering the products and services to their
customers. The intense competition and facing the worldwide competition,
the improvement of logistics system should be advanced by both private and
government companies. Weeld and Roszemeijer (Ho, 1997) discerned three
revolutions in business that have substantial impacts on the purchasing and
supply strategies of the manufacturing sectors. These three revolutions are:
(1) the globalisation of trade; (2) the upcoming of the information era;
(3) more demanding consumers and their continuously changing consumer
preferences.54
The main characteristics of future logistics development are:
Government role: To keep competitiveness of industries, the
government has to lead the way to assist the logistics
industries. For instance, the idea of freight village of city
logistics provides the environment to promote logistics
efficiency and to reduce operation costs. However, it involves
large amount of investments and some problems relating to
laws and national policies. Without the lead and support of
government, achieving the plan is difficult.
Growth of international goods transport: The up-growth of
international freight transport is contributed by several factors.
Firstly, the blossoming of E-commerce pushes ahead the
international business activities. Secondly, the change of
production strategy needs international cooperation, e.g.
importing the semi-finished products from countries with
cheaper human resources to those with higher technology to
assemble the final goods. Thirdly, the pressure of globalised
market, such as World Trade Organization (WTO), pushes
local industries to promote themselves to reach an
international standard and face the worldwide competition.
Improvement of services: Providing a good customer service
becomes a necessary requirement or business operation facing
the intense competition with the global market. The quality of
services is the main factor to affect consuming behavior
among the enterprises with high similarity. The service
systems, at present involve several developed techniques, such
as Efficient Consumer Response (ECR) and Quick Response55 (QR). In the near future, more new techniques would be applied in providing better services for customers. Revolution of logistics operation: IT techniques and its products bring efficiency and fluency to the logistics systems. Radio Frequency ID (RFID) is one of these techniques. The main difference between the bar-code system and the RFID is that RFID does not need the action of scanning the barcode on goods whereas it is necessary to scan barcode in the barcode system. RFID could save manual operation time dramatically. RFID systems could sense the amount of goods input in the tags automatically and immediately when the costumers push their trolley through the exit (Carroll, 2004). Shorter product life cycle: With the current trend, the merchandise design is changing day by day. Therefore the product life cycle becomes outdated within a short period especially with the products related to computer science technology. To confront the impacts, logistics system must improve its efficiency and reliability of goods delivery. Otherwise an inappropriate logistics system would hinder the competitiveness of new products and the business profits. Improvement of logistics facilities: The advancement and development of logistics are based on several techniques and complete theories. High-tech facilities and systems, e.g. ITS, could bring more possibilities and advantages to logistics. For example, the improvement of related facilities, e.g. Forklift Trucks, is necessary for transport efficiency. In the future, factory automation is the main target for the whole supply-
56

chain procedures. It could help to improve efficiency and also
reduce the operation costs.

Channel cooperation between companies: In order to save
the logistics costs, a key concept is necessary to maximize the
usage of available transport capacity. Integrating the logistics
demands between numerous departments helps to achieve this
purpose. In practice, a conglomerate could develop its own
logistics service for the branches. For some medium size
companies, they could co-operate transport channels with
others.

Specialized logistics delivery: One of the notable trends of
logistics industries is the specialized delivery service. For
instance, delivering fresh food from the place of origin needs
low-temperature containers. Computer chips, gases and
petroleum need particular conveyances to carry. These
demands are rising since the products became more and more
delicate.

Logistics centres: The development of logistics centres is
good      for   promoting   Logistics   industry   and   for   the
development of national economic system. As the Logistics
centres could successfully shorten the distance between
production and marketing vertically it can integrate various
industries horizontally as well as it can decrease the costs.
Governments can propose special areas for storehouses and
logistics to reduce land acquisition. The future logistics will
co-operate e-commerce, the Internet and the newly door-to-
door service to create new business prospects.
57

               Freight transport: The alliance between middle and small
               size delivery companies is an important trend in the future.
               The strategy could help to expand service areas and increase
               service quality, and meanwhile raise the loads of single trips
               to reduce delivery costs.

3.11     CHALLENGES OF LOGISTICS INDUSTRY

         The following problems which are existing in the Indian Logistics
Industry make it unattractive for investments and also create entry barriers for
the new entrants.

               Logistics is a high-cost, low-margin business. The problem
               and the real threat to the organized players is the unfair
               competition with unorganized players, who are all exempted
               from paying taxes and following operating norms stipulated in
               the Motor Vehicles Act such as quality of drivers and
               vehicles, volume and weight restrictions, etc.

               Economies of scale is absent in the Indian logistics industry.
               Even the organized sector that contributes to more than 1% of
               the logistics cost, the marketing system of Logistics Industry
               highly fragmented. Existence of the differential sales tax
               structure is also brought in diseconomies of scale. Though
               VAT (Value Added Tax) has been implemented since April 1,
               2005, failure in implementation of a uniform VAT structure
               across different states in India has let the problem persist even
               today.

               Apart from the non-uniform tax structure, Indian LSPs have to
               pay numerous other taxes, octrois, and face multiple check
58 posts and police harassment. High costs of operation and delay are involved in compliance with varying documentation requirements of different states of India which make the business unattractive. On an average, a vehicle on Indian road loses 24-48 hours in complying with paperwork and formalities at different check posts en route to a destination. Fuel worth $ 2.5 billion is spent on waiting at check posts annually. A vehicle that costs $ 30,000 pays $ 7,500 per annum in the form of various taxes, which include the excise duty on fuel. This is why freight cost is a major factor of increasing the cost of a product in India. There is a lack of trust and awareness among Indian shippers with regard to outsourcing logistics. The volume of outsourcing by Indian shippers is presently 10% low compared to the same for the developed countries. The unwillingness to outsource logistics on part of Indian shippers may be attributed to skepticism about the possible benefits, perceived risk, losing control of sensitive organizational information, and vested interest in keeping Logistics activities in-house. Indian shippers expect LSPs to own quality assets to provide more value-added services to act as an integrated service provider, to institute world-class information systems for more visibility and to be in real-time tracking of shipments. Though, they pay little attention to timely payments that leave LSPs short of adequate working capital, they are unwilling to match the same with increased billings.
59

Indian freight forwarders face stiff competition from multi-
national   freight   forwarders   for   International   Freight
Movement. MNCs, because of their size and operations in
many countries, are able to offer low freight rates and to
extend credit for long periods. Indian freight forwarders, on
the other hand, because of their smaller size and lack of access
to cheap capital, are not able to match the same. Moreover,
clients of MNCs often want to deal with a single service
provider especially for FOB (Free on Board) shipments which
most of the time happens with the multi-national freight
forwarders. This is a sort of non-tariff barrier imposed on
Indian freight forwarders.

Poor physical and communications infrastructure is an another
deterrent which discourages the Indian investors’ interest to
invest in the Logistics sector. Road transportation accounts for
more than 60% of inland transportation of goods, and
highways that constitute 1.4% of the total road network carry
40% of the freight movement by roadways. Slow movement
of cargo due to bad road conditions, multiple check posts and
documentation requirements, congestion at seaports due to
inadequate infrastructure, bureaucracy, red-tappizm and delay
in government clearances coupled with unreliable power
supply and slow banking transactions, make it difficult for
exporters to meet the deadlines for their          international
customers. To expedite shipments, they have to book
airfreight, which along the cost of shipments, make them
uncompetitive in international markets. Moreover, many large
shipping liners avoid Indian ports for its high cost and long
turnaround times which causes delays in loading/unloading
60

the products and hence Indian exporters have to resort to
transshipments at ports such as Singapore, Dubai and
Colombo.

Low penetration of IT and lack of proper communications
infrastructure result in delays, lack of visibility and real-time
tracking ability. Unavailability and absence of a seamless flow
of information among the constituents of LSPs create a lot of
uncertainty, unnecessary paperwork and delays, lack of
transparency in terms of cost structures and service delivery.
For example, a shipper has to pay a higher freight rate if it
cannot ensure return load. At present, there is no real-time
process by which a shipper may know about the availability of
the trucks and going rates at the destination marketed,
therefore it has to pay more. The market information available
to both the shipper and the service provider, the service
provider’s cost structure would have been transparent to the
shipper and it would have ended paying the actual market rate.

Since most of the LSPs are of relatively small in size, they
cannot provide the entire range of services. However, shippers
would like the service providers to offer more value-added
services and a single-stop solution to all their logistical
problems. The inability of service providers to go beyond
basic services and provide value-added services such as small
repair work, kitting/dekitting, packaging/labeling, order
processing, distribution, customer support, etc. has not been
able to motivate shippers to go for outsourcing in a big way.
61

               Service tax levied on logistics service fees (currently 12.36%
               with educational cess) may make outsourcing costly and
               outweigh the possible benefits.

               There is a lack of skilled and knowledgeable manpower in the
               logistics sector. Management graduates do not consider
               logistics as a prime job. To improve the status of the industry,
               service providers have to move beyond the level of brokers
               and truckers to attract and retain talent.

3.12     MARKET FOR LOGISTICS INDUSTRY

The business is expected to grow for the following reasons:

         India is the only economy projected to grow at over 5% annually
through to 2050 (Source: Goldman Sachs) India’s overall retail sector is
expected to grow at a 10% CAGR to $833 billion by 2013 and $1.3 trillion by
2018 (Source: IBEF). Many Japanese, French and American automobile
companies have established manufacturing bases in India for onward export.
India’s cumulative exports grew 3.4% in 2008-09: from $163,132 million to
$168,704 million which is 16.9% in rupee terms. Cumulative 2008-09 imports
increased 14.3% in dollar terms from $251,654 million to $287,759 million
which is 29% in rupee terms. The country's share in global trade is expected
to grow from 1.5% to 5% by 2020, indicating opportunities in the logistics
industry. With the government’s infrastructural development initiatives like
Golden Quadrilateral Project (investment in East-west and North-south
Corridors, connecting four major metros), Rail Freight Corridor, Free Trade
and Warehousing Zones (FTWZ) with 100% FDI and PPP in infrastructure
development in ports and roads, it is expected that investments in the logistics
sector will increase. The cumulative incidence of the excise duty and State
62
VAT works out from 22% to 24% of the retail sales price. With the
introduction of GST in 2010, the aggregate incidence of tax will be lower,
strengthening the logistics industry, especially warehousing.
Businesses are emphasizing their core competencies and
outsourcing support and incidental activities, increasing the demand for 3PL.
The population of the country increased by 1.6 crore to 115.4 crore in 2008-
09. The per capita growth income from 12.2% to 25.3% in 2008-09, indicates
an increase in disposable income, which will lead to a higher demand of
eatables/food, which, in turn, will propel the demand for warehousing and
supply chain solutions. India’s freight industry is expected to grow at 10
percent by 2014 and the air freight sector is set to expand by 8.5 percent by
2020. India’s Logistics Sector is projected to grow from Rs 4,000 billion to
Rs 5,000 billion by 2010 and to Rs 7,500 billion by 2012 (Source:
Assocham). It is supported by a rapid growth in the manufacturing and
service sectors, substantial domestic and international freight growth,
consumption proliferating in Tier II and Tier III cities and the government’s
proposal to invest $17 billion in the transportation infrastructure by 2010.
3.13 LOGISTICS INDUSTRY – A PARADIGM SHIFT
In the new millennium, globalization is making national economy
more and more integrated into the global economy. World trade is expanding
at an exponential rate. Technologies are advancing and becoming an
integrating force. Customer demand value for their money. Marketers are
experiencing Competitive pressure. Businesses are struggling not only for
growth but also for survival. This has forced business organization around the
world to re-evaluate their business processes and the way they deliver the
products and services to their customers. The intense competition and
proliferation of the product and service varieties have resulted in volatility in63 market demand, and hence it has become necessary for companies to manage uncertainty. Business firms around the world have started looking beyond the organizational boundaries to improve upon cost, quality, reliability, responsiveness, and relationships to manage uncertainty. In order to survive and remain profitable, both manufacturing organization and trading companies worldwide concentrate on the core competencies and are outsourcing peripheral processes and intermediate products. Global buying and sourcing practices have undergone total change over the past few years. This has resulted in international supply chains and innovative logistics management practices that are vastly superior, both qualitatively and in terms of scale economics. Products today are sourced from different parts of the world. They are assembled at different locations, shipped to various destinations to ensure greater customer satisfaction and to eliminate unnecessary time and cost from the supply chain cycle. These trends resulted in numerous marketing opportunities worldwide through expanded global supply chains and enhanced competitiveness. The pursuit of growth and the need to access new markets have been propelling companies around the world to search for a sustainable competitive advantage. This has led the companies to greater customer consciousness and to the need for cost effectiveness. The global nature of business has forced companies to recognize critical role of back-end operations of a logistics supply chain in today’s dynamic business environment. As business firms are focusing on production, marketing, finance, a greater attention is required to achieve customer satisfaction through effective and efficient logistics. Due to advancement in information and communication technologies, logistics has become an integral part of e- commerce and e-business. Like an army on a war front, the business warriors on a market front are powerless without a proper logistics backup. Logistics is a source for core competency and a tool for developing competitively advantaging today’s customer-driven, market-oriented economies. Hence,
64
business firms today cannot afford to ignore the crucial role of logistics in the
supply chain of a business. If this is ignored, there will be a trouble for the
business firm not only for the growth but also for survival.
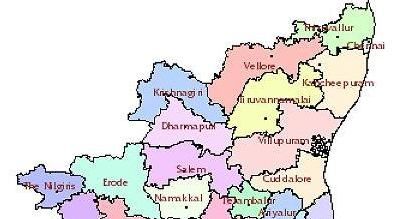
3.14 PROFILE OF THE STUDY AREA
Tamilnadu State is situated at the South Eastern extremity of the
Indian Peninsula bounded on the north by Karnataka and Andhra Pradesh, on
the east by Bay of Bengal, on the South by the Indian Ocean and on the West
by Kerala State. The State can be divided broadly into two natural divisions
(a) the Coastal plains of South India and (b) the hilly western area. Parallel to
the coast it is gradually rising from the broad strip of plain country. It can
further be subdivided into coromandel plains comprising of the districts of
Kancheepuram, Thiruvallur, Cuddalore and Vellore.
The alluvial plains of the Cauvery Delta extending over Thanjavur
and part of Tiruchirapally districts, and dry southern plains in Madurai,
Dindigul, Ramanathapuram, Sivaganga, Virudhunagar, Tirunelveli and
Tuticorin districts. It extends a little beyond Western Ghats in Kanyakumari
District. The Cauvery Delta presents some extremely distinctive physical and
human features. Its power being a main factor in the remarkable growth, the
towns of Tamilnadu have witnessed. It is associated intimately with the life of
all its border regions. In the east, the low country 500 feet below, varies from
50 to 80 miles in width. This plain extends almost up to the feet of the Ghats
and only minor elevation can be found here and there. For instance the
Valanad hills. The Eastern Ghats enters the State from Andhra Pradesh in the
north cuts across the State and merge with The Nilgiris Hills on the Western
Ghats. The region is bounded on South-West by the crest of the Cardamom
hills and on the North-West by the slopes of the plateau. The region is in the
form of a Rhombus and the longer diagonal of its stretches from the Pulicat
lake in the north to Cape Comorin in the South and the shorter diagonal from65
the Palghat in the west to point calimere in the east. The State has an
uninterrupted coastline of 922 Kms. It includes the coastline of Pondicherry
and Karaikkal. The coastline has a lengthy boundary on the east. Not a single
natural harbour capable of accommodating ocean - going vessels can be found
on the coast. Madras City has an artificial harbour. While it is a major Port
and Tuticorin a medium one, several smaller ports like Cuddalore,
Nagapattinam and Colochel are also found in Tamil Nadu.
3.14.1 Location
The State Tamil Nadu is geographically located between 8°5' and
13°35' North latitude and between 76°14' and 80°21' East longitude. It is
situated at the South Eastern extremity of the Indian Peninsula bounded on the
north by Karnataka and Andhra Pradesh on the east by Bay of Bengal, on the
South by the Indian Ocean and on the West by Kerala State.
3.14.2 Soil and Rainfall
The soil of the state varies from red sandy to black and alluvial. The
state in general has a semi arid climate with scanty rainfall. The normal
rainfall of the state is 945.0 mm.
3.14.3 Climate
Tamilnadu has an equatorial, tropical climate in the inland and an
equatorial, maritime climate in its coastal regions. In the inland, the
temperature may go to extreme in some places while it tends to be moderate
in the coastal areas. By and large, the average temperature for most parts of
the state ranges between 28°C and 40°C in the summer season and between
18°C and 26°C in the short-lived winter seasons. In the more hilly terrain, the
maximum temperature may be as low as 26°C and the minimum temperature
may go down to 3°C.66
3.14.4 Administrative Set – Up
Tamil Nadu State has at present 32 Districts, which in turn are
further bifurcated into smaller divisions and sub-divisions, including a total of
16,317 villages. The state capital, Madras now renamed, as Chennai is the
fourth largest city in the Indian Sub-continent and 30th largest city in the
world. It extends over an area of 174 sq. km. District Collector is the Head of
the District Administration. Districts are divided into Taluks for the purpose
of Revenue Administration. Tahsildar is the Head of Taluk Level
Administration. Taluks consist of a group of Revenue Villages. Development
administration in a district is co-ordinated by the Panchayat Unions (also
called as Blocks) for the rural areas. Panchayat Unions consist of a group of
Panchayat Villages. In the case of urban areas, the development
administration is taken care by the urban local bodies. The urban local bodies
are called as Municipal Corporations. Municipalities and Town Panchayats
depend on the size of the town. The names of the districts are as follows:
Table 3.1 The Name of the Districts
Sl. District No.of No.of No.of Town No.of Municipal
No. Name Taluks Blocks Panchayats Municipalities Corporations
1 Ariyalur 3 6 2 2 -
2 Chennai Nil
(TN State HQ) 5 (Urban - - Chennai
District)
3 Coimbatore 6 12 44 7 Coimbatore
4 Cuddalore 6 13 16 5 -
5 Dharmapuri 5 8 10 1 -
6 Dindigul 8 14 24 3 -
7 Erode 5 14 53 11 Erode
8 Kancheepuram 8 13 24 10 -
9 Kanniyakumari
4 9 56 4 -
(HQ at Nagercoil)67
Table 3.1 (Continued)
10 Karur 4 8 11 4 -
11 Krishnagiri 5 10 7 2 -
12 Madurai 7 13 12 6 Madurai
13 Nagapattinam 7 11 8 4 -
14 Namakkal 4 15 19 5 -
15 Perambalur 3 4 4 1 -
16 Pudukkottai 9 13 8 2 -
17 Ramanathapuram 7 11 7 4 -
18 Salem 9 20 33 4 Salem
19 Sivaganga 6 12 12 3 -
20 Thanjavur 8 14 22 3
21 The Nilgiries
(HQ at 6 4 11 4 -
Udhagamandalam)
22 Theni 5 8 22 6 -
23 Thiruvallur 8 14 13 12 -
24 Thiruvarur 7 10 7 4 -
25 Thoothukudi 8 12 19 3 -
26 Tiruchirappalli 8 14 17 3 Tiruchirappalli
27 Tirunelveli 11 19 36 7 Tirunelveli
28 Tiruppur 6 13 17 7 Tiruppur
29 Tiruvannamalai 7 18 10 4 -
30 Vellore 8 20 22 14 -
31 Villupuram 8 22 15 3 -
32 Virudhunagar 8 11 9 7 -
3.14.5 Demographic profile of Tamil Nadu State
As per 2011 census, the total population of the Tamilnadu state was
72, 138,958 which constitutes about 6.07 percent of the total population of
India. The density of population is around 555 persons per sq. km as against
the 679 in the nation. The decadal growth rate of population of Tamil Nadu is
11.7% as against 21.5% for the country. Of Tamil Nadu’s total population of
62.41 million, 56% reside in the rural areas. The population of scheduled68
caste and scheduled tribes constitutes 36.04 percent of the total population of
the state. As per the 2011 census, the occupational pattern of the state shows
that there are 47,38,819 cultivators and 60,62,786 agricultural labours. Out of
the total 2,787,8282 workers, 2574844 workers have been engaged in the
allied agricultural activities and 1,269,5119 workers have been engaged in
non- agricultural industries such as cottage and household industries, trade
and commerce.
3.15 RIVERS
The agricultural activity in the state is well supported by some
perennial rivers. The Western Ghats form complete water shed and no river
pierces through them. The main stream viz., Paralliyar and Vattaseri
Phazhayar are 37 and 23 miles respectively in length and fall in the Arabian
Sea. All the other rivers are east flowing rivers. The Eastern Ghats are not a
complete watershed and as a result the river pierces through them and notable
among them is the river Cauvery.
3.15.1 Cauvery
The river is 475 miles long and drains an area of 28,000 square
miles. It takes its origin on the Brahmagiri in Coorg in the Western Ghats.
After travelling some distance in Karnataka State, the river enters Tamil
Nadu. Across the river a huge reservoir called the Mettur Dam has been
constructed. Near Tiruchirapalli, there is a Dam called “Grand Dam”. The
Cauvery has been so well utilised that its drainage channel, the Coleroon is
always dry. The tributaries of the river Cauvery are Bhavani, Amaravathi and
Noyal.69
3.15.2 Vaigai
This is the second most important river in Tamil Nadu. It originates
process from Varushanad hills and receives much of the drainage from the
upper and lower plains. The river has been dammed in Madurai close to Theni
and there is also a dam at Anaipatti in Manamadurai.
3.15.3 Thamiraparani
This river which is 70 miles long, rises in the southern portion of the
Western Ghats and drains an area equal to 1937 Square miles. The valley of
the river contains some of the richest lands in the State. The chief tributaries
of the river are Ramanadhi, Ghatana, Pachaiyar and Chittar.
3.15.4 Palar
The river Palar rises in Nandi Hills of Kolar, Karnataka State. It is
182 miles long and runs through Chingleput and North Arcot districts. Its
chief tributaries are Cheyyar and Ponni.
3.15.5 Ponniyar
This river rises very near to Nandi Hills in Karnataka State. It enters
Tamil Nadu near Dharmapuri and rust 200 miles before joining sea near
Pondicherry with a drainage area of 620 square miles. The river has no delta
on its mouth.
3.15.6 Vellar
This river raises in Kalrayan hills flows in the eastern districts and
joins the Sea near Port- Nova. The length of the river is 134 miles and drains
an area of 266 square miles.70
3.15.7 Small Rivers
Among the small rivers worth mentioning in the context is
Couralayar, which flows from the surplus waters of Kaveripakkam tank. The
river runs through Chennai City and joins the sea.
3.16 AGRICULTURE
Agriculture and allied activities, the single largest sector, act as a
growth engine by ensuring food and nutritional security to the masses besides
providing raw-materials to agro-based industries and also providing
employment and thereby income to the rural folk of the State and Indian
Economy. Agriculture in TamilNadu has undergone major structural changes
in terms of the share of allied sectors in agriculture. The Share of Agriculture
and allied activities in Gross Domestic Product (GDP) accounted for 17.1
percent during 2008-09. Agriculture and logging alone had shared 16.3
percent and the share of Forestry and Fishing accounted for 0.7 percent and
0.8 percent respectively. The share of agriculture sector in providing
employment accounted for 52 percent at the national level and the
performance of agriculture sector is a helping hand for the growth engine of
the Indian Economy. Tamil Nadu shares about 4 percent in respect of the
geographical area, 7 percent of population and 3 percent of water resources of
the country. The gross cropped area in 2008-09 accounted for about 39
percent of the total geographical area, of which 56 percent of the land was
irrigated. The contribution of agriculture (including allied activities) of the
State to the Gross State Domestic Product (GSDP) at Constant prices
accounts for 9.4 percent in 2008-09. However, the agriculture sector ensures
household food security and brings forth equity in distribution of income and
wealth which would result in the reduction of poverty. For achieving the
target of 4 percent of agricultural growth as envisaged in the XI Five Year71
Plan Period (2007-2012), agriculture is being focused on the State since 2007-
08. Following table summaries the agricultural production in Tamilnadu:
Table 3.2 Types of Crops Grown
Index No. of Crops
Crops
Area Production Productivity
I Food Crops
A . Cereals
1 Paddy 93.1 77.6 83.3
2 Cholam 63.2 45.5 72.1
3 Cumbu 36.2 37.4 103.1
4 Ragi 64.0 42.4 66.4
5 Maize 530.5 390.2 73.6
6 Korra 26.2 29.2 111.3
7 Varagu 15.2 14.7 96.2
8 Samai 38.1 30.8 80.9
A: Total Cereals 86.0 76.1 82.7
B . Pulses
9 Bengal Gram 84.3 88.2 104.7
10 Red gram 35.2 35.8 101.7
11 Green Gram 112.1 85.2 76.1
12 Black Gram 83.1 56.3 67.7
13 Horse Gram 48.7 37.5 77.1
Total Pulses 73.6 58.4 71.2
Total Food Grains
84.0 75.3 82.2
(A+B)
C. Spices & Condiments
14 Chilly 66.6 77.1 115.7
15 Garlic 41.5 42.2 101.8
16 Coriander 46.0 60.1 130.4
17 Turmeric 163.2 161.1 98.8
18 Tamarind 134.6 139.8 103.8
19 Arecanut 176.6 243.0 137.6You can also read