Chapter 4: Air quality - LONDON ENVIRONMENT STRATEGY - Greater London Authority

Page created by Ruby Quinn
 
CONTINUE READING
Chapter 4: Air quality - LONDON ENVIRONMENT STRATEGY - Greater London Authority
LO N D O N E N V I R O N M E N T S T R AT E G Y                 37

                                                  Chapter 4:
                                                  Air quality
Chapter 4: Air quality - LONDON ENVIRONMENT STRATEGY - Greater London Authority
LO N D O N E N V I R O N M E N T S T R AT E G Y                                                                                                                                                                                       39

AIM                                               INTRODUCTION                                Two pollutants remain a specific concern.
                                                                                              These are particulate matter (PM 10, PM 2.5
                                                                                                                                                                      These actions reflect the importance
                                                                                                                                                                      of taking immediate action to protect
London will have                                  Since the passage of the Clean Air Act
                                                  over sixty years ago, there has been
                                                                                              and black carbon) and nitrogen dioxide
                                                                                              (NO 2). London is failing to meet the
                                                                                                                                                                      public health and of raising awareness
                                                                                                                                                                      amongst Londoners. A City Hall
the best air quality                              huge progress in improving air quality
                                                  in London. The city now meets legal
                                                                                              legal limit for NO 2. Particulate matter is
                                                                                              damaging to health at any level and must
                                                                                                                                                                      commissioned report estimated that
                                                                                                                                                                      over 9,000 Londoners died prematurely
of any major world                                limits set by the national Air Quality
                                                  Regulations 3 for most pollutants.
                                                                                              be reduced.                                                             from long-term exposure to air pollution
                                                                                                                                                                      in 2010. 4 The Mayor is committed to
city by 2050, going                               There have been historic reductions in
                                                  the levels of benzene, lead and sulphur
                                                                                              Improving London’s air quality requires
                                                                                              the following actions:
                                                                                                                                                                      improving air quality as soon as possible,
                                                                                                                                                                      but recognises pollution will still be
beyond the legal                                  dioxide pollution, which has greatly
                                                  improved health and quality of life.        • reducing exposure of Londoners
                                                                                                                                                                      unacceptably high for a number of years
                                                                                                                                                                      due to historic policy failure and inaction,
requirements                                      This underlines the ability of effective
                                                  and coordinated action to improve the air
                                                                                                to harmful pollution across London
                                                                                                – especially at priority locations like
                                                                                                                                                                      which have contributed to the scale of
                                                                                                                                                                      the problem. It is therefore necessary to
to protect                                        we breathe if we are bold enough to take
                                                  strong action.
                                                                                                schools – and tackling health inequality                              reduce exposure (for example at schools)
                                                                                                                                                                      as far as possible and address the
human health                                      While the Great Smogs of the 1950s and
                                                                                              • achieving legal compliance with UK
                                                                                                and EU limits as soon as possible,
                                                                                                                                                                      unacceptable health inequality caused
                                                                                                                                                                      by the unequal exposure to pollution by
and minimise                                      1960s are thankfully a thing of the past,
                                                  this does not mean the problem has
                                                                                                including by mobilising action from
                                                                                                the London boroughs, government
                                                                                                                                                                      different groups.

inequalities.                                     gone away. There is still much to be done
                                                  to improve London’s toxic air.
                                                                                                and other partners                                                    In parallel to reducing exposure, the
                                                                                                                                                                      Mayor will take urgent action to tackle
                                                                                              • establishing and achieving new, tighter                               pollution to achieve legal compliance
                                                                                                air quality targets for a cleaner London,                             with UK and EU limits as soon as possible
                                                                                                meeting World Health Organisation                                     and in the most effective manner.
                                                                                                (WHO) health-based guidelines by                                      This includes signature measures like
                                                                                                2030 by transitioning to a zero                                       introducing the Ultra Low Emission Zone
                                                                                                emission London                                                       (ULEZ) and transforming the bus and taxi
                                                                                                                                                                      fleets to be zero emission. This strategy

                                                                                              3
                                                                                               Air Quality Standards Regulations 2010, SI number 2010/1001: http://www.legislation.gov.uk/uksi/2010/1001/contents/made
                                                                                              4
                                                                                               Walton, H., Dajnak, D., Beevers, S., Williams, M. & Hunt, A. (2015), Understanding the Health Impacts of Air Pollution in London. Accessed
                                                                                              from: http://www.kcl.ac.uk/lsm/research/divisions/aes/research/ERG/research-projects/HIAinLondonKingsReport14072015final.pdf or on the
                                                                                              website: https://www.london.gov.uk/sites/default/files/hiainlondon_kingsreport_14072015_final.pdf
Chapter 4: Air quality - LONDON ENVIRONMENT STRATEGY - Greater London Authority
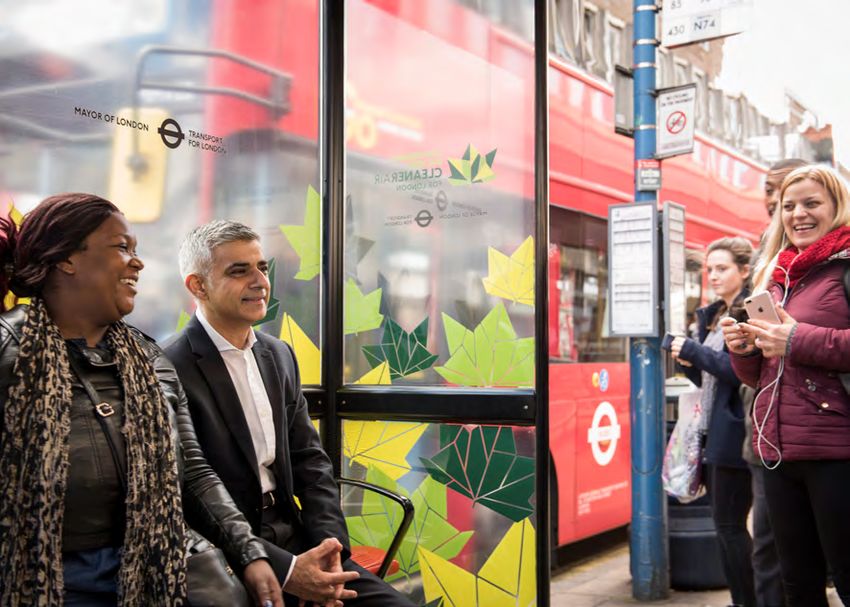
LO N D O N E N V I R O N M E N T S T R AT E G Y   41

will set out a roadmap to compliance.
However, this can only be achieved
as quickly as possible if the London
boroughs, government and others play
their full part. Where available, the Mayor
will use statutory powers to ensure this.

This strategy also recognises the need
to go beyond legal limits, as these reflect
political and economic considerations
as well as health impacts. These should
therefore be treated as a starting rather
than an end point. WHO guidelines,
meanwhile, were driven solely by the
available health evidence and as a result
are set much tighter for PM 10 and PM 2.5.
Achieving these more ambitious targets
would provide many extra health benefits
for Londoners. This strategy sets out the
timescale, and the changes needed,
to achieve these tighter targets.

Improving air quality also offers an
opportunity to address climate change.
In the past policy makers have focused
on reducing carbon emissions which has
resulted in unintended consequences
like encouraging the use of diesel,
the promotion of biomass boilers and
gas engine combined heat and power
systems being installed in areas of poor
air quality. Instead in this strategy we are
seeking to design integrated policies
which deliver multiple benefits.
Chapter 4: Air quality - LONDON ENVIRONMENT STRATEGY - Greater London Authority
LO N D O N E N V I R O N M E N T S T R AT E G Y                                                                                                                                   43

LONDON’S ENVIRONMENT NOW
                                                  B OX 1 : A I R POLLU TI ON                 BOX 1: AIR POLLUTION DE FINITIONS (C ONTINUE D)
The key evidence to support the Mayor’s           DE FI NI TI O NS
ambitions for London’s air quality is                                                        Pollutants of concern in London
summarised below. You can find out more           What’s the difference between
                                                                                             Particulate matter (PM 10 and PM 2.5):    Black carbon: This is a component
about the evidence behind the policies            emissions and concentrations?
                                                                                             Particulate matter (PM) is a complex      of fine particulate matter (PM 2.5 and
and proposals in Appendix 2.
                                                  London’s air quality is affected by        mix of non-gaseous material of            smaller). It is formed through the
                                                  a number of factors. These include         varied chemical composition. It is        incomplete combustion of fossil fuels,
The WHO has published air quality
                                                  the weather, local geography and           categorised by the size of the particle   biofuel, and biomass, and is emitted in
guidelines, which inform the EU Air
                                                  emissions sources from both within         (for example PM 10 is particles with a    both anthropogenic
Quality Directive. These standards have
                                                  and outside London. Air quality is         diameter of less than ten micrometres     and naturally occurring soot.
been transposed into UK legislation. For
                                                  measured in concentrations, which          (µm)). Most PM emissions in London        Black carbon also contributes to
more details on the legislative and policy
                                                  are specific levels of a pollutant         are caused by road traffic, with          climate change. Black carbon warms
background see Appendix 4, and for
                                                  in a given area. Legal limits are          exhaust emissions and tyre and            the planet by absorbing sunlight and
information on the main responsibilities
                                                  set in relation to concentrations.         brake wear being the main sources.        heating the atmosphere.
of various organisations see Appendix 3.
                                                  Local emissions from vehicles,             Construction sites, with high volumes
                                                  buildings, construction and other          of dust and emissions from machinery      Nitrogen dioxide (NO 2):
Box 1 provides definitions for some
                                                  sources contribute significantly to        are also major sources of local PM        All combustion processes produce
commonly used terms.
                                                  air pollution in London. This is what      pollution. Other sources include wood     Nitrogen Oxide (NO x). In London, road
                                                  the Mayor can most directly control        burning stoves, accidental fires and      transport and heating systems are the
                                                  and influence. That means we must          burning of waste. However, a large        main sources of these emissions. NO x
                                                  understand how these emissions             proportion of PM comes from natural       is primarily made up of two pollutants
                                                  are being reduced to understand            sources, such as sea salt, forest fires   - nitric oxide (NO) and nitrogen dioxide
                                                  how effective particular policies and      and Saharan dust. In addition, there      (NO 2). NO 2 is of most concern due
                                                  proposals could be. However,               are sources outside London caused         to its impact on health. However NO
                                                  there is rarely a direct relationship      by human activity. Small particles tend   easily converts to NO 2 in the air - so
                                                  between reducing emissions within          to be long-lived in the atmosphere        to reduce concentrations of NO 2 it is
                                                  London and reducing concentrations         and can be carried great distances.       essential to control emissions of NO x
                                                  given the other factors at play.           This imported PM forms a significant
                                                  This is why the strategy will refer both   proportion of total PM in London.
                                                  to concentrations and emissions.
Chapter 4: Air quality - LONDON ENVIRONMENT STRATEGY - Greater London Authority
LO N D O N E N V I R O N M E N T S T R AT E G Y                                                                                                                                                                                                                    45
                                                                                                           TYPE OF GRAPH: AIR QUALITY

                                                                                                           Reference

                                                                                                                                             Fig 2: Trends in PM10 concentrations in London – 2004 to 2016
   London’s pollution concentrations                                      metres of roads, while ‘background sites’                      Figure 2: Trends in PM 10 in London – 2004 to 2016
   London’s monitoring network offers a                                   are located away from major sources
   unique opportunity to understand trends                                of pollution.                                                                   40

   in London’s air quality. One way to view
   air quality monitoring data is to group                                Overall, there has been a gradual
   monitors based on their location and                                   reduction in NO 2, PM 10 and PM 2.5                                             30

                                                                                                                                         PM10(μg m3 3)
   distance from the roadside and look                                    concentrations at background sites in
   at average concentrations.                                             inner and outer London and at outer
                                                                          London roadside sites.                                                          20

   Figure 1, Figure 2 and Figure 3 show the
                                                                                                           TYPE OF GRAPH: AIR QUALITY
   average trend over the last decade or so                               Inner London NO 2 roadside sites have
                                                                                                                                                          10
   for NO 2, PM 10 and PM 2.5 concentrations,                             shown a more variable trend but have
   respectively, at sites in the London Air                               seen a steeper decline from 2012.
                                                                                                   Reference
   Quality Network (LAQN), grouped by                                     This decline is also reflected in the inner
                                                                                                                                                           0
   type. Roadside monitors are within five                                London PM 10 and PM 2.5 roadside sites.                                              2004             2006               2008          2010               2012     2014              2016

                                                                                                                                                                      Roadside Inner            Roadside Outer          Background Inner    Background Outer
Figure xxx: Trends in NO 2 concentrations in London – 2000 to 2016                                                                                                    London                    London                  London              London
   Figure 1: Trends in NO 2 in London – 2000 to 2016
                                                                                                                                            Source: GLA (2016), London Atmospheric Emissions Inventory (LAEI) 2013.
                 80                                                                                                                         Available at: data.london.gov.uk/dataset/london-atmspheric-emissions-inventory-2013
                                                                                                                                         Figure 3: Trends in PM                               in London – 2006 to 2016
                                                                                                                                            Fig 3: Trends in PM 2.5 concentrations in London – 2004 to 2016
                                                                                                                                                                                    2.5

                 60
 NO 2(μg m3 3)

                                                                                                                                                          20

                 40

                                                                                                                                        PM 2.5(μg m3 3)
                                                                                                                                                          15

                 20
                                                                                                                                                          10

                  0
                                                                                                                                                           5
                      2000        2002        2004          2006      2008          2010        2012         2014         2016

                             Roadside Inner          Roadside Outer          Background Inner          Background Outer
                             London                  London                  London                    London                                              0
                                                                                                                                                               2006                    2008               2010               2012          2014                2016
Source: GLA (2016), London Atmospheric Emissions Inventory (LAEI) 2013.
   Source: the London Air Quality Network and analysis by King’s College London                                                                                       Roadside Inner            Roadside Outer          Background Inner    Background Outer
                                                                                                                                                                      London                    London                  London              London
Accessed from: data.london.gov.uk/dataset/london-atmspheric-emissions-inventory-2013

                                                                                                                                         Source: the London Air Quality Network and analysis by King’s College London
                                                                                                                                             Source: GLA (2016), London Atmospheric Emissions Inventory (LAEI) 2013.
                                                                                                                                             Available at: data.london.gov.uk/dataset/london-atmspheric-emissions-inventory-2013
Chapter 4: Air quality - LONDON ENVIRONMENT STRATEGY - Greater London Authority
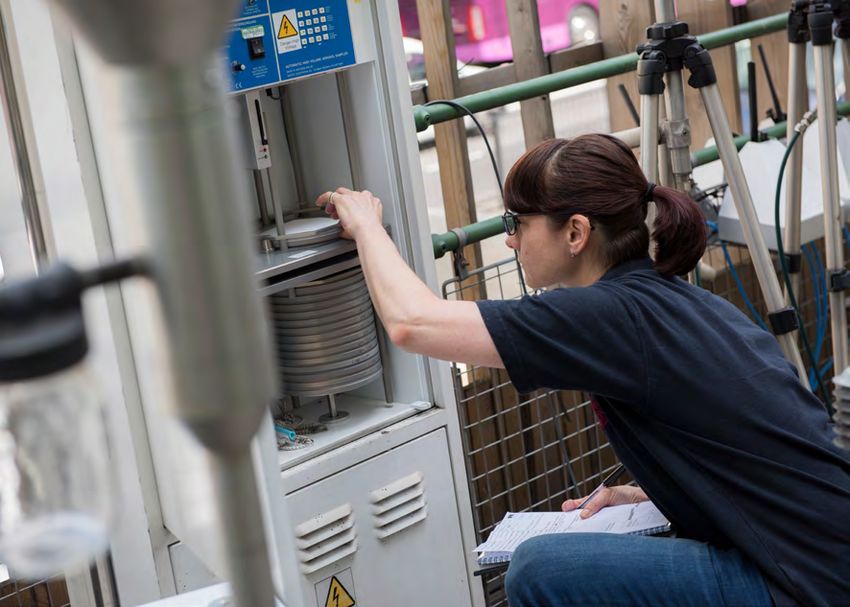
LO N D O N E N V I R O N M E N T S T R AT E G Y                         TYPE OF GRAPH: AIR QUALITY                                                                                                                        47

                                                                        Reference

These reductions are important as they            London’s emissions                                 Figure   4:Emissions
                                                                                                         Fig 4:  Emissions        trend
                                                                                                                          trend and       andcategories
                                                                                                                                    main source main source     categories– NO x 2008-2013
                                                                                                                                                        – NOx 2008-2013
show, overall, that air quality is improving      Currently around half of Nitrogen
in London. However, the NO 2 EU annual            Oxides (NO x) emissions come from
                                                                                                                                        70
mean limit value of 40 μg m 3 is being            road transport sources. The other                                                                                                   HGVs (Artic)
                                                                                                                                                                                      HGVs (Rigid)
exceeded in many places and the PM                half of emissions come from                                                                                                         Non-TfL bus and coach
                                                                                                                                        60
health based guidelines are far from              non-road transport sources, including

                                                                                                          NOx emissions (’000 tonnes)
                                                                                                                                                                                      TfL Buses

being met.                                        construction, residential and commercial                                                                                            Vans and Minibuses      Road
                                                                                                                                                                                                              Transport
                                                  buildings, river, aviation, and industrial
                                                                                                                                                                                      Diesel Cars
                                                                                                                                        50
                                                                                                                                                    50%                               Petrol Cars
                                                  emissions (Figure 4). While much of the                                                                                             Taxis

                                                  public attention remains focused on                                                   40
                                                                                                                                                                 50%
                                                                                                                                                                                      Motorcycles

                                                  vehicles, a strategy must consider how                                                                                      51%
                                                                                                                                                                                      Industry
                                                  best to tackle all of these sources.                                                                                                D&C Other Fuels
                                                                                                                                        30
                                                  A similar breakdown also applies to                                                                                                 Commercial Gas

                                                  PM 10 emissions (Figure 5).                                                                                                         Domestic Gas

                                                                                                                                        20                                            NRMM                    Other

                                                                                                                                                    50%                               Other
                                                                                                                                                                 50%
                                                                                                                                                                              49%     Rail
                                                                                                                                        10                                            River
                                                                                                                                                                                      Aviation

                                                                                                                                         -

                                                                                                                                             2008         2010         2013

                                                                                                            Source: GLA (2016), London Atmospheric Emissions Inventory (LAEI) 2013.
                                                                                                     Source: GLA at:
                                                                                                         Available (2017),  London Atmospheric Emissions Inventory (LAEI) 2013 update.
                                                                                                                     data.london.gov.uk/dataset/london-atmspheric-emissions-inventory-2013

                                                                                                     Total NO x emissions in London fell by 25
                                                                                                     per cent over the period 2008 to 2013
                                                                                                     (versus a 35 per cent target to 2015 in
                                                                                                     the previous air quality strategy).
Chapter 4: Air quality - LONDON ENVIRONMENT STRATEGY - Greater London Authority
QUALITY L O N D O N                           E N V I R O N M E N T S T R AT E G Y
                                                                                                                                TYPE OF GRAPH: AIR QUALITY                                                                                                                                    49

                                                                                                                                Reference

           Figure  5:Emissions
               Fig 5: Emissions        trend
                               trend and        andcategories
                                         main source main source     categories – PM 10, 2008-2013
                                                              – PM 2008-2013                10                                                               Figure    6: Emissions
                                                                                                                                                                Fig 6: Emissions trend and trend   and
                                                                                                                                                                                           main source   main source
                                                                                                                                                                                                       categories         categories – PM 2.5, 2008-2013
                                                                                                                                                                                                                  – PM 2008-2013 2.5

                                                                                                                Electric Cars                                                                                                                     Electric Cars
                                              6.0                                                               HGVs (Artic)
                                                                                                                                                                                                3.5                                               HGVs (Artic)
                                                                                                                HGVs (Rigid)                                                                                                                      HGVs (Rigid)
               PM10 emissions (’000 tonnes)

                                                                                                                Non-TfL bus and coach                                                                                                             Non-TfL bus and coach
                                                                                                                                                                                                3.0
                                              5.0                                                               TfL Buses                                                                                                                         TfL Buses

                                                                                                                                                               PM 2.5 emissions (’000 tonnes)
                                                                                                                                                Road                                                                                                                              Road
                                                                                                                Vans and Minibuses              Transport                                                                                         Vans and Minibuses              Transport
                                                                                                                Diesel Cars                                                                                                                       Diesel Cars
                                                                  46%                                                                                                                           2.5
                                                                                                                Petrol Cars                                                                                  49%                                  Petrol Cars
                                              4.0
                                                                                     47%                        Taxis                                                                                                                             Taxis
                                                                                                                                                                                                                          50%
                                                                                                                Motorcycles                                                                                                                       Motorcycles
                                                                                                                                                                                                2.0
                                                                                                   50%
                                              3.0                                                               Resuspension                                                                                                                      Resuspension
                                                                                                                                                                                                                                       54%
                                                                                                                Industry                                                                        1.5                                               Industry

                                                           2010           2013                                  D&C Other Fuels                                                                                                                   D&C Other Fuels

                                              2.0                                                               Commercial Gas                                                                                                                    Commercial Gas
                                                                                                                Domestic Gas                                                                    1.0                                               Domestic Gas
                                                                  54%                                           Construction/ Demolition Dust   Other
                                                                                                                                                                                                                                                  Construction/ Demolition Dust   Other
                                                                                     53%                                                                                                                     51%
                                                                                                   50%                                                                                                                    50%
                                                                                                                NRMM                                                                                                                              NRMM
                                              1.0                                                                                                                                                                                      46%
                                                                                                                Other                                                                           0.5                                               Other
                                                                                                                Rail                                                                                                                              Rail
                                                                                                                River                                                                                                                             River
                                              0.0                                                               Aviation                                                                        0.0                                               Aviation
                                                          2008           2010              2013                                                                                                       2008         2010         2013

                      Source: GLA (2016), London Atmospheric Emissions Inventory (LAEI) 2013.                                                                           Source: GLA (2016), London Atmospheric Emissions Inventory (LAEI) 2013.
           Source: GLA at:
                Available (2017),  London Atmospheric Emissions Inventory (LAEI) 2013 update.
                            data.london.gov.uk/dataset/london-atmspheric-emissions-inventory-2013                                                            Source: GLAat:(2017),
                                                                                                                                                                Available            London Atmospheric Emissions Inventory (LAEI) 2013 update.
                                                                                                                                                                            data.london.gov.uk/dataset/london-atmspheric-emissions-inventory-2013

           Total PM 10 emissions fell by 20 per cent                                              Total PM 2.5 emissions fell by 27 per cent
           over the period 2008 to 2013 (versus                                                   over the period 2008 to 2013 (there was
           a 31 per cent target to 2015 in the                                                    no reduction target in the previous air
           previous air quality strategy).                                                        quality strategy).

           The source of PM 2.5 emissions in London
           is similar to that for PM 10 but some
           sources, such as tyre and break wear
           are more significant.
Chapter 4: Air quality - LONDON ENVIRONMENT STRATEGY - Greater London Authority
LO N D O N E N V I R O N M E N T S T R AT E G Y                                                                                                                                                                                 51

Concentrations maps and exposure                  In 2013 roughly 1.9 million people, or                            Figure    8: 2013
                                                                                                                    Greater London      - Annual
                                                                                                                                   - Annual Mean PM10mean   PM 10 2013
                                                                                                                                                     concentrations concentrations            post LAEI 2013
Air quality concentration maps (Figure            23 per cent of the city’s population,
                                                                                                                                                                                      ´       Legend

7, Figure 8 and Figure 9) have been               were living in areas with average NO 2
                                                                                                                                                                                              PM10 (µg/m3)
                                                                                                                                                                                                     97

                                                                                                                                                                                          0                5            10

                                                                                                                                                                                                       Kilometres

Figure
Greater 7: 2013--Annual
        London    Annual  mean
                        Mean NO2NO 2 concentrations
                                 concentrations 2013                              post LAEI 2013

                                                                          ´       Legend
                                                                                  NO2 (µg/m3)
                                                                                         97                                                                                                         27 - 33
                                                                                                                                                                                                     > 33

                                                                              0                5            10

                                                                                           Kilometres

                                                                                                                                                                                          0                5            10

                                                                                                                                                                                                       Kilometres

Source: GLA (2017), London Atmospheric Emissions Inventory (LAEI) 2013 Update.                                      Source: GLA (2017), London Atmospheric Emissions Inventory (LAEI) 2013 Update.
Chapter 4: Air quality - LONDON ENVIRONMENT STRATEGY - Greater London Authority
LO N D O N E N V I R O N M E N T S T R AT E G Y                                                                                                                                                                            53

Transboundary pollution                                                  The EU National Emissions Ceiling                                     Figure 10: Impacts of London’s current air quality
The challenge of cleaning London’s air                                   Directive must incorporate tighter
is made more difficult because a large                                   emission limits for countries across
amount of the pollution sources are not                                  Europe to address transboundary
within London. The most recent analysis                                  pollution on a quicker timescale.
shows that sources outside London                                        It is also why international action
make the largest contribution to the                                     coordinated by the United Nations,
estimated death risk from long-term                                      including the Convention on Long-
exposure to PM 2.5 in London as a whole.                                 range Transboundary Air Pollution and

                                                                                                                                                         9000+                                      £3.7
This is also responsible for the majority                                its associated protocols, is needed to
of health effects associated with                                        improve air quality in London.
short-term exposure.
                                                                         Public health                                                                      LONDONERS                                BILLION
For example, 75 per cent of the                                          Research has shown air pollution has a                                         die early every year                  the cost of air pollution
cardiovascular hospital admissions                                       big impact on health at all life stages,                                     because of air pollution                 to London’s economy
associated with PM 2.5 result from                                       from development in the womb to the
pollution sources outside London,                                        end of life. A baby born in 2010 and
including industrial, agricultural                                       exposed to that same level of air quality
and transport emissions from other                                       for its entire life would lose around two
countries. In addition, external sources                                 years of life expectancy. Mortality is
are responsible for just under half of                                   not the only air pollution related health
the mortality risk associated with NO 2. 5                               effect. In 2010, London air pollution was
                                                                         linked to over 3,000 hospital admissions.
Even if all local emissions sources were                                 The economic cost of these health

                                                                                                                                                            20%                                       2x
removed, over half the health effects                                    impacts in London is estimated as being
linked to London’s air pollution would be                                up to £3.7bn a year (Figure 10). 6 There is
felt. This is why, even as the UK leaves                                 also strong evidence that poor air quality
the EU, working closely with European                                    affects children’s lung development,                                           PRIMARY SCHOOLS                         AS LIKELY TO DIE
partners is vital to reduce emissions                                    and emerging evidence that improving                                       are in areas that breach the             from lung diseases if you
across the continent.                                                    air quality can reverse those effects.                                   legall imit for NO 2 (air pollution)     live in deprived vs affluent
                                                                         There is also increasing evidence of                                                                                     areas of London
                                                                         the link between exposure to pollution
                                                                         and dementia. 7

                                                                                                                                               Source: King’s Report (2015).

5
  Walton, H., Dajnak, D., Beevers, S., Williams, M. & Hunt, A. (2015), Understanding the Health Impacts of Air Pollution in London. Accessed
from: http://www.kcl.ac.uk/lsm/research/divisions/aes/research/ERG/research-projects/HIAinLondonKingsReport14072015final.pdf or on the
website: https://www.london.gov.uk/sites/default/files/hiainlondon_kingsreport_14072015_final.pdf
6
  King’s report 2015
7
  https://www.nature.com/tp/journal/v7/n1/abs/tp2016280a.html
Chapter 4: Air quality - LONDON ENVIRONMENT STRATEGY - Greater London Authority
LO N D O N E N V I R O N M E N T S T R AT E G Y                                                                                                                                                                                    55

Social inequality                                                        In this strategy, the Mayor seeks to                                 Diesel vehicles, especially                  Maximising co-benefits between air
These health impacts fall                                                design integrated policies that offer                                cars and vans                                quality and climate change policies
disproportionally on the most vulnerable                                 multiple benefits.                                                   These remain the main source of road         There is a risk that unintended
communities, affecting the poorest,                                                                                                           transport pollution. A comprehensive         consequences can arise if climate and
the youngest, the oldest, those with                                     One example of this is that black carbon                             approach is required to phase out their      air quality policies are developed in
pre-existing health conditions and those                                 has a higher global warming potential                                use. Rather than a return to petrol,         isolation, for example, in relation to
from minority ethnic groups the most.                                    than CO 2. It is however possible to deliver                         mode shift to sustainable forms of           energy and planning policy. Conversely,
Perhaps most worryingly, over 438                                        quick wins to improve both air quality                               transport like walking and cycling           integrated policy design can bring
schools and 364 other educational                                        and prevent climate change. This can                                 wherever possible should be encouraged.      benefits for both air quality and climate
institutions in London are located in                                    be done by adopting tighter PM 2.5 limits,                           Any vehicles that remain will need to        change, for example, by reducing black
areas exceeding safe legal pollution                                     promoting a switch to zero emission                                  transition to zero emission technology.      carbon emissions by switching to zero
levels. People living in the most deprived                               vehicles, replacing old, inefficient                                                                              emission vehicles.
areas are, on average, more likely to be                                 boilers, increasing energy efficiency                                Tackling all sources of pollution
exposed to poor air quality than those                                   of buildings, and creating a zero carbon                             To achieve legal compliance as quickly       Further reductions are needed in
in less deprived areas. 8                                                city where energy mainly comes from                                  as possible, all sources of pollution must   PM 10 and PM 2.5, particularly from
                                                                         renewable sources.                                                   be addressed. That means significantly       transboundary pollution, tyre and
Tackling air pollution is not, therefore,                                                                                                     increasing efforts in relation to non-       brake wear and wood burning
just about the environment or about                                      A review of the previous strategy,                                   transport sources. This is vital as the      Progress in dealing with PM emissions
protecting public health. It is also about                               baseline and other evidence highlights                               proportion of total emissions from           will stall in 2020 once exhaust emissions
social justice. There is an urgent need                                  several key issues to be addressed in                                non-transport sources is expected            are significantly reduced. London is
to do more to tackle the public health                                   the strategy.                                                        to increase over the lifetime of this        currently far from achieving WHO health-
inequalities associated with air pollution                                                                                                    strategy as our efforts on transport         based limits for PM 2.5. One of the best
in London.                                                               Achieving legal compliance                                           start to have an effect.                     ways to do this would be to reduce
                                                                         as quickly as possible                                                                                            the number of vehicle kilometres by
Climate change                                                           The last strategy did not reach the                                  Government action                            supporting a mode shift to walking,
Improving air quality also offers                                        expected emission reductions. In part,                               The government controls some of the          cycling and public transport. It will also
an opportunity to address climate                                        this was due to the underperformance                                 most powerful policy levers to influence     be necessary to address wood burning-
change. In the past, policy makers have                                  of Euro engine emissions standards.                                  air quality, including fiscal incentives     related emissions, which evidence
mainly focused on reducing carbon                                        Targets in this strategy will need to                                such as vehicle excise duty. It alone        suggests are a significant source of
dioxide (CO 2) emissions. This has                                       reflect the latest evidence on vehicle                               can legislate to provide new powers          emissions, particularly on some of
resulted in unintended consequences,                                     emissions performance. It must set                                   to tackle non-transport emission             the most polluted days.
like encouraging the use of diesel,                                      out appropriate steps by all levels of                               sources. Achieving legal compliance
and promoting biomass boilers and                                        government to ensure a roadmap to                                    is dependent on further government
combined heat and power systems                                          compliance as quickly as possible.                                   action and leadership.
installation in areas of poor air quality.

8
  King, K. & Healy, S. (2013), Analysing Air Pollution Exposure in London. Accessed from: https://www.london.gov.uk/sites/default/files/
analysing_air_pollution_exposure_in_london_-_technical_report_-_2013.pdf (51 per cent of Lower Layer Super Output Areas (LSOAs) within
the most deprived 10 per cent of London have concentrations above the NO 2 EU limit value. This contrasts with 1 per cent above the NO 2 EU
limit value in the 10 per cent least deprived areas.)
LO N D O N E N V I R O N M E N T S T R AT E G Y                                                  57

ROLES AND LEGAL DUTIES                            the Mayor will operate the reformed
                                                  London Local Air Quality Management
The Mayor                                         (LLAQM) framework, which sets out
The Mayor has a legal duty to set out             clearly the action boroughs should be
policies and proposals in this strategy           taking (Box 2).
to achieve compliance with the legally
required air quality standards as quickly         The government
as possible.                                      The ultimate responsibility for achieving
                                                  compliance with the legally required
The Mayor will act to improve air                 air quality standards “as quickly as
quality, where the Mayor or bodies within         possible” lies with the government.
the control of the Mayor have relevant            The government is required to have an
powers or resources. However, the Mayor           Air Quality Plan that will achieve this.
does not have all the powers needed to
improve London’s air quality alone.               The government has unique tools
This strategy sets out the responsibilities       available to it, such as control over fiscal
of all the organisations with a role to           incentives or the ability to legislate,
play in improving London’s air quality,           which can accelerate compliance.
including the government, London                  Without a clear national plan to tackle
boroughs and the Environment Agency.              emissions, especially from vehicles,
                                                  the air in UK cities will not improve.
The Mayor will help the boroughs in
exercising their statutory duties to              The government needs to give local
improve air quality. Where needed, the            authorities across the country extra
Mayor can use powers of direction to              powers to address non-transport
require boroughs to take steps to meet            pollution sources, to help scrap older
air quality objectives. These reserve             polluting vehicles, and use fiscal and
powers can only be used following                 other incentives to encourage use of
consultation. To support the boroughs             clean vehicles.
LO N D O N E N V I R O N M E N T S T R AT E G Y                                                                                                                                       59

The London boroughs and                           • targeted measures at pollution
public sector                                       hotspots such as vehicle restrictions       BOX 2: THE LONDON LOCAL AIR QUALIT Y MANAGE ME NT
London’s boroughs have a duty                       and green infrastructure                    FR AME WORK (LL AQM)
to work towards achieving legal limits.
They have an important role to play               • supporting installation of infrastructure   Local Air Quality Management (LAQM)       London’s 32 boroughs and the City
in addressing local pollution which                 to fuel zero emission vehicles              is the statutory process by which         of London. However, it was agreed
is underpinned by the statutory                                                                 a local authority is required to review   with Defra that the relevant LAQM
LLAQM framework (Box 2).                          The statutory powers of the London            the air quality within its area.          guidance for London should differ
There are a number of levers they can             boroughs are also important to continue       This system aims to determine if air      from the rest of the UK in recognition
use to help. These include:                       to discourage antisocial burning of waste     quality objectives set within the Air     of the particular challenges the
                                                  and the illegal use of wood-burning           Quality Regulations 2000 and the Air      capital faces. London now has its own
• emissions-based parking charges                 stoves. Finally, the boroughs have            Quality (Amendment) Regulations           bespoke statutory policy and technical
                                                  extensive public health duties and can        2010 are likely to be met in a certain    documents.
• reducing pollution from new                     play an important role in mainstreaming       area. It also drives improvements
                                                                                                                                          The key LLAQM requirements
  developments through planning                   air quality into health-related activities.   to achieve those objectives.
                                                                                                                                          for boroughs are:
  (especially those not referred to                                                             The London system used to be part
  the Mayor),                                     The public sector has a wider duty            of a national framework managed           • to continue to monitor and assess
                                                  to lead by example to reduce emissions        by Defra. However, in May 2016 the          air pollution in their areas
• improving the public realm for                  and exposure to pollution, particularly       Mayor launched a bespoke system for
  walking and cycling                             in relation to its vehicle fleets, as well    the capital - London Local Air Quality    • to ensure an Air Quality Management
                                                  as to raise awareness.                        Management (LLAQM).                         Area (AQMA) is declared and in
                                                                                                                                            place for any locations that are
                                                                                                This scheme was designed to                 exceeding air quality objectives
                                                                                                encourage close working to help             and EU Limit Values
                                                                                                address this vital issue. This renewed
                                                                                                focus on LAQM in London should help       • to ensure that a current and relevant
                                                                                                ensure that local authority air quality     Air Quality Action Plan is in place for
                                                                                                resources are protected, or where           all AQMAs. The Action Plan should
                                                                                                possible increased.                         be updated every five years at a
                                                                                                                                            minimum, and progress against this
                                                                                                The basic statutory framework for           should be reported annually
                                                                                                local air quality management is via
                                                                                                national Air Quality Regulations and      • to complete the annual monitoring
                                                                                                Part IV of the Environment Act 1995.        and Action Plan update reports
                                                                                                This remains in place and applies to
LO N D O N E N V I R O N M E N T S T R AT E G Y                                                                                                                                                     61

LONDON WILL HAVE THE BE ST AIR QUALIT Y
OF ANY MAJOR WORLD CIT Y BY 2050
Current emissions sources                          Zero emission London 2050                                                                                         London Environment
                                                                                                                                                                     Strategy Objectives
                                                    TRANSPORT
NOx
                                                                                                                                                                         E M POWE R PEOPLE
Road Transport		                        51%        Strict new emission requirements across London (e.g. ULEZ, zero emission zone)
Non-road transport		                    11%
                                                                                                                                                                         TO RE D UCE THE IR
Built Environment		                     37%                                                                                                                                 E XPOSURE TO
Other				                               1%                                                                                                                                     POOR AIR
                                                                                                                                                                               QUALIT Y

                                                                                                                                                                             M E E T UK AND
PM10
                                                   Mode shift to walking, cycling & public transport   All vehicles zero emission by 2050                                  E U A IR QUALIT Y
Road Transport		                        50%
Non-road transport                      3%
                                                                                                                                                                           L IM IT S AS SOON
Built Environment                                                                                                                                                             AS POS SIBLE
& Industry 			                          19%
Resuspension                            23%
                                                                                                                                                                           SE T & ACHIE V E
Other				                               4%
                                                                                                                                                                         N E W, T IGHTE R AIR
                                                                                                                                                                         QUA L IT Y TARGE T S
                                                                                                                                                                          FO R A CLE ANE R
                                                   Zero emission bus fleet by 2037 and                 Reduce emissions from rail, river
                                                   all taxis zero emission by 2033                     and aviation transport                                                  LOND ON
PM2.5
Road Transport		                        54%
Non-road transport		                    6%
Built Environment
& Industry			                           30%
Resuspension                            2%
Other				                               8%
                                                    N O N –T R A N S P O R T

                                                   Prevent and reduce emissionsfrom                   Reduce emissions from homes and workplaces,        Informing the public with alerts during
                                                   non-road mobile machinery                           large scale generators, wood burning and biomass   high and very high pollution episodes

Source: GLA (2016), London Atmospheric Emissions
Inventory (LAEI) 2013 Update
LO N D O N E N V I R O N M E N T S T R AT E G Y                                                                                                                                  63

                                                  Objectives, policies
                                                  and proposals

“Protecting public                               OBJECTIVE 4.1 SUPPORT LONDON AND
                                                  ITS COMMUNITIES, PARTICULARLY
                                                                                               Policy 4.1.1 Make sure that London
                                                                                               and its communities, particularly the
                                                                                                                                          visit. The current air quality information
                                                                                                                                          system will be improved so that it targets
  health is at the                                THE MOST VULNERABLE AND THOSE
                                                  IN PRIORITY LOCATIONS, TO HELP
                                                                                               most vulnerable and those in priority
                                                                                               locations, are empowered to reduce
                                                                                                                                          these organisations and provides tailored
                                                                                                                                          advice. This will ensure that decision-
  heart of the                                    EMPOWER PEOPLE TO REDUCE THEIR
                                                  EXPOSURE TO POOR AIR QUALITY
                                                                                               their exposure to poor air quality         makers have information on current
                                                                                                                                          pollution levels and upcoming episodes,
  Mayor’s efforts
                                                                                               Proposal 4.1.1a The Mayor will provide
                                                                                                                                          as well as evidence-based advice on
                                                  Protecting public health is at the heart     better information about air quality,
                                                                                                                                          how to respond.
  to improve
                                                  of the Mayor’s efforts to improve air        especially during high and very high
                                                  quality. It requires reducing exposure,      pollution episodes, and use emergency      London-wide episodes of high pollution
  air quality.”
                                                  including by raising awareness of the        measures where appropriate                 happen a few times each year. Very high
                                                  impacts of pollution and when air quality                                               pollution episodes are even more rare –
                                                                                               Human health is affected by poor air
                                                  is particularly poor. The Mayor’s long-                                                 occurring only every few years. On such
                                                                                               quality. This is particularly true for
                                                  term aim is to ensure concentrations are                                                occasions, it is important that Londoners
                                                                                               vulnerable people like children, older
                                                  reduced to levels that are both safe and                                                are kept fully informed and can respond
                                                                                               people and those with pre-existing
                                                  compliant. However, it is recognised that                                               accordingly to minimise health impacts.
                                                                                               health conditions.
                                                  until further measures like the ULEZ are                                                The Mayor will continue to provide real
                                                  put in place there will remain times where                                              time alerts during high or very high air
                                                                                               Timely air pollution information gives
                                                  pollution can be very poor due to historic                                              pollution episodes by broadcasting
                                                                                               vulnerable people a chance to act to
                                                  policy failure and inaction that have                                                   information on bus shelters, Tube
                                                                                               protect themselves, for example by
                                                  contributed to the scale of the problem.                                                stations and on roadside signs. There
                                                                                               reducing their exposure, or simply
                                                                                               by carrying their medication.              will be a particular focus on reducing
                                                  The Mayor wants to ensure that
                                                                                               Schools, hospitals, GP surgeries, and      unnecessary private car use and other
                                                  Londoners have access to the right
                                                                                               care homes are places where those          activities that contribute to pollution
                                                  information and, if appropriate,
                                                                                               most vulnerable to the health impacts      (Figure 11).
                                                  emergency action is taken to minimise
                                                                                               of air pollution episodes spend time and
                                                  public exposure. This objective also
                                                  seeks to address the health inequality
                                                                                               Figure 11: Air pollution forecast announcement
                                                  caused by the unequal exposure to
                                                  pollution by different groups.
LO N D O N E N V I R O N M E N T S T R AT E G Y                                                                                                                                                               65

The Mayor will work with government                                     Proposal 4.1.1b The Mayor will aim            The Mayor will actively encourage              In addition, a requirement to consider
to ensure that London has the powers                                    to do more to protect London’s                London boroughs to use the funding             the overall suitability of a site (and its
needed to implement emergency                                           schoolchildren by reducing their              available to them through TfL for Local        design layout) for the proposed end use
measures such as short-term road                                        exposure to poor air quality at school        Implementation Plans to improve air            in terms of exposure to pollution will be
closures or vehicle restrictions,                                       and on their journey to and from school       quality and reduce exposure, especially        considered in the new London Plan.
where appropriate, during high                                                                                        around schools and on journeys to and
                                                                        Reducing the exposure of schoolchildren                                                      Policy 4.1.2 Improve the understanding
pollution episodes.                                                                                                   from school. To support this, City Hall will
                                                                        to pollution is a priority because younger                                                   of air quality health impacts to better
                                                                                                                      implement a schools audit programme
                                                                        children are among the most vulnerable                                                       target policies and action
                                                                                                                      to identify steps London boroughs can
                                                                        to its health impacts. Eight and nine-
                                                                                                                      take to reduce exposure.
                                                                        year-olds living in cities with high levels                                                  Proposal 4.1.2a The Mayor will
                                                                        of fumes from diesel cars have up to ten                                                     produce and maintain the London
                                                                                                                      Proposal 4.1.1c Through the London
                                                                        per cent less lung capacity than normal. 9                                                   Atmospheric Emissions Inventory
                                                                                                                      Plan the Mayor will consider policies
                                                                        More must be done to reduce exposure                                                         (LAEI) to better understand pollution
                                                                                                                      that mean new developments are
                                                                        at schools wherever possible, and also                                                       sources in London
                                                                                                                      suitable for use and for their particular
                                                                        at colleges, universities, and other          location, taking into account local            To tackle air pollution effectively, it is
                                                                        educational establishments.                   air quality                                    necessary to understand its sources.
                                                                                                                                                                     The Mayor will produce and maintain
                                                                                                                      Through the new London Plan, the Mayor
                                                                                                                                                                     the LAEI. This will help us understand
                                                                                                                      will consider policies that seek to reduce
                                                                                                                                                                     the key emissions sources and how
                                                                                                                      exposure to existing poor air quality
                                                                                                                                                                     they contribute to poor air quality, both
                                                                                                                      through design or mitigation strategies.
                                                                                                                                                                     now and projected into the future. It will
                                                                                                                      These are vital where new development
                                                                                                                                                                     be used to calculate health impacts,
                                                                                                                      will be used by large numbers of people
                                                                                                                                                                     exposure and health inequalities.
                                                                                                                      who are particularly vulnerable to poor
                                                                                                                      air quality, like children or older people.

9
    https://www.kcl.ac.uk/lsm/research/divisions/aes/research/ERG/research-projects/EXHALE.aspx
LO N D O N E N V I R O N M E N T S T R AT E G Y   67

Proposal 4.1.2b The Mayor will work
with boroughs to safeguard the
existing air quality monitoring network
and enhance it by exploiting new
technologies and approaches such
as personal and localised monitoring

Through the LLAQM framework,
boroughs are required to monitor and
report on local air quality. The GLA,
TfL, and London boroughs fund and
maintain one of the most extensive
automatic monitoring networks of
any world city. This is supplemented
with additional monitoring.

It is one of the ways in which
local authorities play a crucial role in
helping to understand and address air
pollution. Their high quality monitoring
data helps us to understand the long-
term trends in air pollution. It is used
to validate the comprehensive pollution
modelling provided by the Mayor
through the London Atmospheric
Emissions Inventory (LAEI).

The Mayor will continue to oversee this
monitoring network and will ensure sites
crucial for understanding long-term
trends or measuring the impact of local
measures are not removed or moved.
The Mayor will use statutory powers to
LO N D O N E N V I R O N M E N T S T R AT E G Y                                                                                                                   69

do this, as well as working with boroughs
to enhance monitoring networks where
                                                  OBJECTIVE 4.2 ACHIEVE LEGAL
                                                  COMPLIANCE WITH UK AND EU LIMITS
                                                                                                Road traffic is often the biggest cause
                                                                                                of poor air quality in places where
                                                                                                                                              “T he Mayor is
possible. Particular areas of focus are
increasing the number of long-term NO 2
                                                  AS SOON AS POSSIBLE, INCLUDING BY
                                                  MOBILISING ACTION FROM LONDON
                                                                                                people live and work. Diesel is the most
                                                                                                significant source of NO x emissions,
                                                                                                                                                 committed to
diffusion tube monitoring, especially
in air quality focus areas. Another is
                                                  BOROUGHS, GOVERNMENT AND
                                                  OTHER PARTNERS
                                                                                                which contribute to illegal levels of NO 2.
                                                                                                The reason for this is partly because
                                                                                                                                                 policies that
identifying opportunities for additional
PM 2.5, black carbon and ultra fine particle
                                                  Alongside reducing exposure, the Mayor
                                                                                                of the under-performance of some
                                                                                                Euro Standards for diesel vehicles
                                                                                                                                                 support phasing
                                                                                                                                                 out fossil fuels,
                                                  will take urgent action to tackle pollution
monitoring. The Mayor will work with                                                            over time (see Box 3). There are major
                                                  to achieve legal compliance with UK and
boroughs and others to encourage                                                                discrepancies between official emission
                                                                                                                                                 especially diesel,
                                                  EU limits as quickly and effectively as
innovation in monitoring.                                                                       measurements and real-world vehicle
                                                  possible. However, legal compliance can
                                                                                                performance in urban environments.
                                                                                                                                                 and encourage
                                                  only be achieved if the London boroughs,
It is getting easier for people and groups                                                      There are also issues with the sheer
                                                  government and others also play their
to buy personal and relatively low-cost                                                         number of vehicles on London’s
                                                                                                                                                 take up of zero
                                                  full role and take ambitious action.
monitoring systems. These can be                                                                roads, which causes congestion and
valuable tools, but knowing how best                                                            exacerbates pollution. The introduction
                                                  This objective addresses existing
to use and locate the monitors is vital
if the results are to provide meaningful
                                                  emissions from transport as well as
                                                                                                of ‘real-world’ testing into the ‘Euro 6’
                                                                                                European vehicle-type approval process
                                                                                                                                                 emission vehicles
                                                  emissions from non-transport sources.
information. It is also important to
understand the limitations of monitoring
                                                  It sets out what both the Mayor and
                                                                                                will mean that, on average, new vehicles
                                                                                                are far less polluting than previous
                                                                                                                                                 in London.
                                                  others need to do to achieve legal
equipment and how best to interpret                                                             models. This is particularly so for
                                                  compliance as quickly as possible.
and publish results. The Mayor will offer                                                       heavier transport like lorries.
                                                  However, the main responsibility for
guidance and advice on how air quality
                                                  ensuring that compliance is achieved
is monitored in London, and help people                                                         The Mayor is committed to policies
                                                  rests with government. They can use
understand what type of equipment                                                               that support phasing out fossil fuels,
                                                  unique tools, such as control over
is available.                                                                                   especially diesel, and encourage take
                                                  fiscal incentives, which can
                                                                                                up of zero emission vehicles in London.
                                                  accelerate compliance.
The Mayor will also establish a                                                                 The Mayor will encourage a shift to more
process for accrediting monitors                                                                sustainable travel like walking, cycling or
for different purposes.                                                                         public transport throughout London too.
LO N D O N E N V I R O N M E N T S T R AT E G Y                                                                                                                                    71

This also contributes to the Mayor’s
wider ambitions including:                        B OX 3 : WHY PRI O RI TI SE               used test beating software on their         Unfortunately, similar on-road
                                                  THE PHASI NG O U T OF                     diesel vehicles, whilst others may be       verification introduced for cars and
• all taxis and private hire vehicles to          DI E SE L V E HI CLE S ?                  taking steps to ‘bend the rules’.           vans, known as ‘real driving emissions’
  be zero emission capable by 2033                                                                                                      is yet to be seen. The introduction of
                                                  Diesel vehicles are the single            A landmark study by the International
                                                                                                                                        real driving emissions has potential
• all TfL buses to be zero emission               biggest cause of NO x emissions.          Council for Clean Transportation
                                                                                                                                        to create parity between petrol and
  by 2037                                         Any strategy to improve air               demonstrated that technologies exist
                                                                                                                                        diesel vehicles. However, it has
                                                  quality must consider how to              to reduce emissions from vehicles
                                                                                                                                        been plagued by delays and for
• all newly registered road vehicles              address these.                            but they are not being employed
                                                                                                                                        many this is seen as too little too
  driven in London to be zero emission                                                      consistently by manufacturers.
                                                  Rapid dieselisation of the fleet was                                                  late, with legislation not taking full
  by 2040                                                                                   Although EU legislation lowered NO x
                                                  caused by previous government                                                         effect until 2021. Even then, overly
                                                                                            permitted emissions for diesel cars
                                                  policy which incentivised low CO 2                                                    generous conformity factors
• London’s entire transport system to                                                       by 85 per cent between 2000 (Euro 3)
                                                  emitting vehicles through the                                                         have been introduced to allow
  be zero emission by 2050                                                                  and 2014 (Euro 6), average on-road
                                                  vehicle excise duty and company                                                       for error margins.
                                                                                            emission levels only decreased about
                                                  car tax regimes. These powerful           40 per cent over the same period.           This means some of the newest trucks
These efforts are supported by the wider
                                                  levers encouraged manufacturers                                                       on the road are expected to have
policy framework in the draft Mayor’s                                                       In general, diesel vehicles emit more
                                                  to invest in the development of                                                       emissions of NO x and PM better than
Transport Strategy which promotes                                                           NO x than petrol equivalents and the
                                                  diesel technology – an attractive                                                     some family cars. The introduction
further mode shift, tackles congestion                                                      capital still has a legacy fleet of older
                                                  solution for consumers, which has                                                     of independent testing, such as the
and encourages freight consolidation.                                                       diesel vehicles capable of emitting
                                                  historically delivered better fuel                                                    Mayor’s Cleaner Vehicle Checker,
This section should be read alongside                                                       high levels of PM emissions (prior to
                                                  economy and improved durability                                                       will help to alleviate this issue by
the draft Mayor’s Transport Strategy.                                                       the EU mandating diesel particulate
                                                  when compared to petrol.                                                              creating transparency and improving
                                                                                            filters from 2011). It is therefore
The section also looks at non-                    However, it is widely acknowledged                                                    consumer confidence.
                                                                                            unsurprising that diesel cars are
road transport sources, including                 that the real world emissions             currently the highest contributor           In all, the Mayor strongly believes that
construction, buildings, the river and            performance of diesel vehicles            to road transport NO x and PM 2.5           government must deliver effective
aviation, before setting out the action           did not match that achieved in            emissions in London.                        national incentives exclusively under
that needs to be taken by others –                laboratory tests. This problem is                                                     their control (such as taxation and
especially government – to achieve                in part a failure in the legislation to   The latest emissions standard for
                                                                                                                                        scrappage) to discourage diesel while
full compliance as quickly as possible.           make the type-approval emissions          heavy duty engines (Euro VI), which
                                                                                                                                        these vehicles remain more polluting.
                                                  test rigorous enough and a poor           includes on-highway verification,
                                                                                                                                        Longer-term, the Mayor is committed
                                                  response by regulators who were           has started to alleviate these
                                                                                                                                        to policies that support phasing out
                                                  aware of the issue for some time.         shortcomings. For example, TfL has
                                                                                                                                        all fossil fuels and accelerating the
                                                                                            seen a 90 per cent reduction in NO x
                                                  This has also been compounded                                                         uptake of zero emission vehicles
                                                                                            emissions between Euro V and Euro
                                                  by the revelations that at least one                                                  in London to deliver further
                                                                                            VI buses.
                                                  manufacturer has deliberately                                                         improvements in air quality.
LO N D O N E N V I R O N M E N T S T R AT E G Y                                                                                                                                      73

Policy 4.2.1 Reduce emissions from                periods of high pollution, but every        active and healthy lifestyle. In addition,      A more sustainable approach to
London’s road transport network by                day. Dependence on cars also has            it creates a more attractive city in which      transport in inner and outer London
phasing out fossil fuelled vehicles,              negative health, congestion, business       to live, visit and do business. It is also an   will require a big increase in the
prioritising action on diesel, and                and community impacts. As part of the       effective way of tackling emissions as          number of journeys made by bus.
enabling Londoners to switch to                   Healthy Streets Approach, the Mayor         it helps to address those from tyre and         Good bus services are fundamental
more sustainable forms of transport               wants to encourage people to walk,          brake wear as well as from exhausts.            to making people less reliant on cars
                                                  cycle and use public transport instead.     That means reducing the number of               and supporting London’s sustainable
Proposal 4.2.1a The Mayor will promote
                                                                                              kilometres driven will have a greater           growth. However, it is essential that
and prioritise more sustainable travel            In order to keep London moving,             impact overall on PM 10 and PM 2.5.             these journeys are delivered by a clean
in London including walking, cycling              improve air quality and reduce carbon,                                                      bus fleet. This is part of the Mayor’s
and public transport, as part of the              Londoners’ dependency on cars must          Proposal 4.2.1b The Mayor, through              commitment to lead by example.
Healthy Streets Approach                          be reduced. Analysis suggests that          TfL, will clean up the bus fleet by             Figure 12 sets out the action to be taken
It is now clear that much of the poor             three quarters of journeys now made by      phasing out fossil fuels, prioritising          to clean up the bus fleet.
air quality in London is linked to                car could be done on foot, by bicycle       action on diesel, and switching to zero
private car use. This is not only during          or by public transport. Such a shift also   emission technologies
                                                  encourages Londoners to lead a more
LO N D O N E N V I R O N M E N T S T R AT E G Y                                                                                                                                                    75

““FAectorbi
        ll TfL buses
                factodis.will                     In line with the draft Mayor’s Transport   Figure 12: Cleaning the TfL bus fleet
                                                  Strategy, TfL buses will be expected to
      meet the
  Apestra          Euro
               vocul  vivilVI                     meet the following requirements:
                                                                                                             NOW             2020          2025          2030          2035          2037
      dieselsestandard
  ventid         etrest atus                      • all new double-deck buses will be
                                                    hybrid, electric or hydrogen from 2018
                                                                                               Bus
                                                                                               procurement
                                                                                                             Retrofit
                                                                                                             of existing
                                                                                                                             TfL will
                                                                                                                             buy only
                                                                                                                                           TfL will
                                                                                                                                           buy only

      for NO     andntique
                      PM reis
                                                                                                             double          electric or   electric or
  tem,      ponsuli
              x                                   • all double-deck buses in central
                                                                                                             decks
                                                                                                             to Euro VI
                                                                                                                             hydrogen
                                                                                                                             single
                                                                                                                                           hydrogen
                                                                                                                                           double

  nem by 2020”
            me ad C. Decupio                        London will be Euro VI and hybrid                        standards       decks         decks

                                                    by 2019                                                  TfL will buy
                                                                                                             only electric
 ratuam potio, sentiur                            • all TfL buses meet the Euro VI diesel
                                                                                                             or hydrogen
                                                                                                             double decks
                                                    standard for NO x and PM by 2020
 bitati sturniu qui sum                                                                        Bus
                                                                                               fleet in
                                                                                                                             All single
                                                                                                                             decks
                                                                                                                                                                                     All TfL
                                                                                                                                                                                     buses
                                                                                               central                       electric or
                                                  • all new single-deck buses will be                                                                                                electric or
 postia nuncepoenam.”                               zero emission from 2020
                                                                                               London                        hydrogen                                                hydrogen

	Eexeris molores recto optas                     • the whole bus fleet will be fully zero
                                                                                                                             All double                                80% of
 Et eic to bercia cuptas a aut                      emission by 2037 at the latest.
                                                                                                                             decks                                     double
                                                    This means making the most of                                            Euro VI                                   decks
                                                    London’s world-leading reputation for                                    and hybrid                                electric or
                                                                                                                                                                       hydrogen
                                                    the take up of electric and hydrogen
                                                    technology in the bus fleet
                                                                                               Bus                                         50% of        90% of        All single
                                                                                               fleet in                                    single        single        decks
                                                  As these improvements are delivered the      inner                                       decks         decks         electric or
                                                  cleanest buses will be prioritised along     and                                         electric or   electric or   hydrogen
                                                                                               outer
                                                  the most polluting routes using Low          London
                                                                                                                                           hydrogen      hydrogen

                                                  Emission Bus Zones.
                                                                                                                             All double    More than     60% of        20% of
                                                                                                                             decks meet    85% of        double        double
                                                                                                                             Euro VI       double        decks         decks
                                                                                                                             standard as   decks         hybrid; 40%   hybrid; 80%
                                                                                                                             a minimum     hybrid,       electric or   electric or
                                                                                                                                           electric or   hydrogen      hydrogen
                                                                                                                                           hydrogen
LO N D O N E N V I R O N M E N T S T R AT E G Y                                                                                                                                                                                          77

Proposal 4.2.1c The Mayor, through                The Mayor will also require all new         The Mayor, through TfL, will keep                                         Road user charging schemes will include
TfL, will reduce emissions in the taxi            private hire vehicles to meet continually   under review existing and planned                                         (subject to the development of detailed
and private hire fleet by phasing out             improving minimum emission standards        road user charging schemes, including                                     proposals and consultation) introducing
fossil fuels, prioritising action on              as set out in the draft Mayor’s Transport   the Congestion Charge, Low Emission                                       the central London ULEZ standards and
diesel, and switching to zero                     Strategy. When combined, this will          Zone, ULEZ and the Silvertown Tunnel                                      charges in 2019. There will also be an
emission technologies                             achieve an entirely zero emission           schemes, to ensure they prove effective                                   Emissions Surcharge on the Congestion
                                                  capable taxi and private-hire fleet by      in furthering or delivering the policies                                  Charge from October 2017 until the
For too long, the taxi trade has been
                                                  2033 at the latest.                         and proposals of the draft Mayor’s                                        introduction of the ULEZ. 10
restricted to diesel vehicles. The Mayor
                                                                                              Transport Strategy.
wants the capital’s taxi fleet to be the          Proposal 4.2.1d The Mayor aims to                                                                                     The Mayor proposes (subject to the
greenest in the world. To phase out               reduce emissions from private and           The Mayor will also consider the                                          development of detailed proposals
diesel, all newly licensed taxis will be          commercial vehicles by phasing out          development of the next generation of                                     and consultation) that the ULEZ is
required to be zero emission capable              and restricting the use of fossil fuels,    road user charging systems. These could                                   expanded to Inner London by 2021 for
from 2018.                                        prioritising action on diesel               replace schemes such as the Congestion                                    light vehicles (cars, vans, minibuses and
                                                                                              Charge, Low Emission Zone and ULEZ.                                       motorbikes), covering an area up to the
The recent sharp increase in private hire         The Mayor will further accelerate
                                                                                              More sophisticated road user charging                                     North / South Circular. It is also proposed
vehicles means they must take a lead              the uptake of cleaner vehicles in London
                                                                                              and/or workplace parking levy schemes                                     that by 2020 the ULEZ is expanded
and accelerate the uptake of Ultra Low            by bringing forward and expanding
                                                                                              could be used to contribute to achieving                                  London-wide for heavy vehicles, which
Emission Vehicles (ULEVs). However,               the ULEZ.
                                                                                              the policies and proposals in the draft                                   will result in only an estimated one per
policies affecting the taxi and private
                                                                                              Mayor’s Transport Strategy, including                                     cent of road length in Outer London
hire vehicles industries must take into           The Mayor alone does not have the
                                                                                              mode share, road danger reduction,                                        remaining in exceedance of the NO 2 limit
consideration the costs and operating             legal power to ban diesel vehicles (or
                                                                                              environmental objectives, reducing                                        values in 2025: primarily on the North
models of each industry. The Mayor will           any other vehicles) across London. The
                                                                                              congestion on the road network, and                                       Circular and around Heathrow (which is
encourage and quicken the take up of              Mayor can, however, apply charges
                                                                                              supporting efficient traffic movement.                                    a matter for national policy).
zero emission capable taxis by working            to vehicles on a number of grounds,
                                                                                              In doing so, the Mayor will consider the
with the trade to create an action plan.          including addressing congestion and
                                                                                              appropriate technology for any future
The Mayor will provide a mixture of               emissions. Charging has been shown
                                                                                              schemes, and the potential for a future
financial incentives, infrastructure and          to be very effective at influencing
                                                                                              scheme that reflects distance, time,
regulation (including maintaining a taxi          behaviour. This includes promoting a
                                                                                              emissions, road danger and other
age limit, currently set at 15 years). The        shift to more sustainable modes of travel
                                                                                              factors in an integrated way.
aim is to achieve a minimum of 9,000              via the Congestion Charge and reducing
such vehicles in the fleet by 2020.               the number of polluting vehicles in
                                                  London via the Low Emission Zone.

                                                                                              10
                                                                                                There are slightly different arrangements for residents of the central London area, who will remain subject to the T-charge while the ULEZ
                                                                                              resident sunset period is in effect.
LO N D O N E N V I R O N M E N T S T R AT E G Y                                                                                                                                                                           79

The expansion of the ULEZ for light               The Mayor will also work with boroughs          Figure 13: ULEZ proposals to be consulted on
vehicles to Outer London would affect             to explore borough-level restrictions        ULEZ PROPOSALS
an additional 1.7 million households.             on fossil-fuelled vehicles, prioritising
Furthermore, there is no appropriate              diesel vehicles (for example diesel
                                                                                                                                                                   Central London ULEZ in 2019
boundary road for a wider zone that               surcharges on resident parking permits),
                                                                                                                                                                   (all non-compliant vehicles)
incorporates the north circular other             and initiatives to incentivise ultra low
than the greater London boundry.                  emission vehicles.
It is likely that targeted local measures                                                                                                                                                         £12.50* per day

such as local road closures, vehicle              The Mayor will take steps to develop a
restrictions or other interventions               Cleaner Vehicle Checker that will help
                                                                                                                                                                                                  £100* per day
could be equally effective and as likely          members of the public understand the
to bring this remaining one per cent of           emissions impact of their diesel cars
road length into compliance, and in a             and vans. The government should also
quicker timeframe. The Mayor will keep            introduce a complementary national
the situation under review and consider           car labelling scheme to raise awareness
what measures will be most effective and          about the differential pollution emissions
likely to secure equivalent compliance on         from vehicles at the time of purchase                                                                            London-wide ULEZ in 2020
those Outer London roads in the shortest          (including for second hand vehicles).                                                                            (all non-compliant heavy vehicles)
time possible.
                                                                                                                                                                                                  Up to £100* per day

                                                                                                                                                                   Inner London ULEZ in 2021
                                                                                                                                                                   (all non-compliant vehicles)

                                                                                                                                                                                                  Up to £12.50* per day

                                                                                                                                                                                                  Up to £100* per day

                                                                                               ULEZ standards: Petrol – Euro 4; Diesel – Euro 6/Vl; Motorcycle and L-Cat – Euro 3
                                                                                                  ULEZ standards: petrol – Euro 4; Diesel – Euro 6/VI; Motorcycle and L-Cat – Euro 3
                                                                                               *ULEZ charge levels are indicative only and refer to the current scheme proposals
                                                                                                  * ULEZ charge levels are indicative only to refer to the current scheme proposals.
LO N D O N E N V I R O N M E N T S T R AT E G Y                                                                                                                                                                  81

““FLectorbi
        ondon’s    freight
               factodis.                          Proposal 4.2.1e The Mayor aims                 The Mayor will take steps to develop a                                  This can be achieved by:
                                                  to reduce emissions from freight               Cleaner Vehicle Checker to help fleet
      accounts
  Apestra          forvivil
               vocul    over                      through encouraging a switch to
                                                  lower emission vehicles, adopting
                                                                                                 operators understand the emissions
                                                                                                 of their diesel cars and vans, and will
                                                                                                                                                                         • stimulating the supply, and increasing
                                                                                                                                                                           the take up, of low emission
      ten per
  ventid     se cent
                etrest of
                        atus                      smarter practices and reducing freight
                                                  movements through better use of
                                                                                                 work with industry to set out a clear
                                                                                                 plan to phase out fossil fuels. This
                                                                                                                                                                           commercial vehicles through
                                                                                                                                                                           regulatory, procurement and
  tem,PM 2.5 emissions
           ponsuli  ntique reis                   consolidated trips                             is vital, especially amongst heavier
                                                                                                 specialist vehicles, which are often
                                                                                                                                                                           pricing incentives

      and mearound
                                                  Almost all of London’s freight is carried
  nem          ad C. Decupio                      by road, using diesel vehicles. This
                                                                                                 more challenging to switch to cleaner                                   • making the most efficient use of
                                                                                                                                                                           vehicles by developing a strategic
                                                                                                 alternatives. The plan will help better
      a fifth potio,
              of traffic
                                                  activity accounts for over ten per cent
  ratuam             sentiur                      of PM 2.5 emissions 11 and around a fifth
                                                                                                 understand alternative fuels, and how                                     consolidation and distribution network
                                                                                                                                                                           to protect industrial land and reduce
                                                                                                 they can be used to bridge the transition
      in the  capital.”
                                                  of traffic in the capital. 12 In the morning
  bitati    sturniu qui sum                       peak, freight traffic is around a third of
                                                                                                 towards zero emission technologies.                                       the impact of freight and servicing trips
                                                                                                                                                                           on London’s streets (Box 5 describes a
                                                  the total traffic in central London.
 postia nuncepoenam.”                                                                            The Mayor has set a number of targets to
                                                                                                 cut emissions and reduce the amount of
                                                                                                                                                                           low emission freight pilot)

                                                  London’s freight movement is also                                                                                      • examining other ways in which freight
                                                                                                 freight movement in central London. This
 	Eexeris molores recto optas                    growing in an inefficient way. Many
                                                                                                 includes reducing construction traffic                                    can be delivered and moved around.
                                                  deliveries of non-time critical goods                                                                                    For example, using cargo bikes and
 Et eic to bercia cuptas a aut                                                                   by five per cent by 2020, and reducing
                                                  are unnecessarily made at congested                                                                                      motorbikes for shorter, smaller
                                                                                                 the number of freight trips during the
                                                  times of the day. Lorries and vans are                                                                                   deliveries in central London and town
                                                                                                 morning peak by ten per
                                                  often less than half full. It is estimated                                                                               centres, and making better use of river
                                                                                                 cent by 2026.
                                                  as many as two in every three delivery                                                                                   and rail services.
                                                  slots are missed. 13 This means repeat
                                                  trips, which cause even more congestion
                                                  and emissions. The Mayor will work with
                                                  London Councils on possible changes to
                                                  the London Lorry Control Scheme, which
                                                  controls the movement of heavy goods
                                                  vehicles at night and at weekends, so
                                                  that the scheme can reduce emissions of
                                                  air quality pollutants and CO 2, as well as
                                                  minimising noise and encouraging safer
                                                  vehicle design.

                                                                                                 11
                                                                                                      Transport statistics Great Britain 2013
                                                                                                 12
                                                                                                      NO x emissions in Greater London LAEI 2010
                                                                                                 13
                                                                                                      Online Shopping Report conducted by ICM on behalf of the GLA in August 2015
You can also read