Chapter divider slide: Design must be alike to chosen cover style (28pt) - OMV Petrom Q4/16, FY 2016 and Strategy Update 2021+ February 16, 2017 ...

 
CONTINUE READING
Chapter divider slide: Design must be alike to chosen cover style (28pt) - OMV Petrom Q4/16, FY 2016 and Strategy Update 2021+ February 16, 2017 ...
Chapter divider slide: Design must
            be alike to chosen cover style
            (28pt)

OMV Petrom Q4/16, FY 2016 and Strategy Update 2021+
February 16, 2017
Mariana Gheorghe, CEO
Chapter divider slide: Design must be alike to chosen cover style (28pt) - OMV Petrom Q4/16, FY 2016 and Strategy Update 2021+ February 16, 2017 ...
Legal Disclaimer
This presentation does not, and is not intended to, constitute or form part of,      This presentation may contain forward-looking statements. These statements
and should not be construed as, constituting or forming part of, any actual          reflect the Company’s current knowledge and its expectations and projections
offer to sell or issue, or any solicitation of any offer to purchase or subscribe    about future events and may be identified by the context of such statements
for, any shares issued by the Company or any of its subsidiaries in any              or words such as “anticipate,” “believe”, “estimate”, “expect”, “intend”, “plan”,
jurisdiction or any inducement to enter into investment activity; nor shall this     “project”, “target”, “may”, “will”, “would”, “could” or “should” or similar
document or any part of it, or the fact of it being made available, form the         terminology. By their nature, forward-looking statements are subject to a
basis of, or be relied on in any way whatsoever. No part of this presentation,       number of risks and uncertainties, many of which are beyond the Company’s
nor the fact of its distribution, shall form part of or be relied on in connection   control that could cause the Company’s actual results and performance to
with any contract or investment decision relating thereto; nor does it               differ materially from any expected future results or performance expressed
constitute a recommendation regarding the securities issued by the                   or implied by any forward-looking statements.
Company. The information and opinions contained in this presentation and
any other information discussed in this presentation are provided as at the          None of the future projections, expectations, estimates or prospects in this
date of this presentation and are therefore of a preliminary nature, have not        presentation should in particular be taken as forecasts or promises nor should
been independently verified and may be subject to updating, revision,                they be taken as implying any indication, assurance or guarantee that the
amendment or change without notice. Where this presentation quotes any               assumptions on which such future projections, expectations, estimates or
information or statistics from any external source, it should not be interpreted     prospects have been prepared or the information and statements contained
that the Company has adopted or endorsed such information or statistics as           herein are accurate or complete. As a result of these risks, uncertainties and
being accurate.                                                                      assumptions, you should in particular not place reliance on these forward-
                                                                                     looking statements as a prediction of actual results or otherwise. This
No reliance may be placed for any purpose whatsoever on the information              presentation does not purport to contain all information that may be
contained in this presentation, or any other material discussed verbally. No         necessary in respect of the Company or its shares and in any event each
representation or warranty, express or implied, is given as to the accuracy,         person receiving this presentation needs to make an independent
fairness or currentness of the information or the opinions contained in this         assessment.
document or on its completeness and no liability is accepted for any such
information, for any loss howsoever arising, directly or indirectly, from any        The Company undertakes no obligation publicly to release the results of any
use of this presentation or any of its content or otherwise arising in               revisions to any forward-looking statements in this presentation that may
connection therewith.                                                                occur due to any change in its expectations or to reflect events or
                                                                                     circumstances after the date of this presentation.
                                                                                     This presentation and its contents are proprietary to the Company and neither
                                                                                     this document nor any part of it may be reproduced or redistributed to any
                                                                                     other person.

   2 | OMV Petrom │ 2016 results and Strategy Update 2021+ presentation │ February 2017
Chapter divider slide: Design must be alike to chosen cover style (28pt) - OMV Petrom Q4/16, FY 2016 and Strategy Update 2021+ February 16, 2017 ...
Key messages 2016
                        Free cash flow at RON 1.6 bn, due to investment prioritization and strict cost
                        discipline
                        Clean CCS EBIT at RON 1.7 bn; higher Downstream contribution
                        OMV Petrom’s Free Float increased to 15.8%; GDRs traded on the London Stock
                        Exchange since October 2016
                        Dividend proposal: RON 0.015/share1

                                                                                                  Upstream: daily hydrocarbon production
                                                                                                  decline offset by significant cost savings
                                                                                                  Downstream Oil: higher retail sales volumes
                                                                                                  offset by weaker refining margins
                                                                                                  Downstream Gas: good overall performance
                                                                                                  2016 LTIR2 at 0.20

1 Executive Board’s proposal subject to approvals of the Supervisory Board and Annual General Meeting of Shareholders; 2 Lost time injury rate (employees and contractors) for OMV Petrom

Group excluding Kazakhstan

   3 | OMV Petrom │ 2016 results and Strategy Update 2021+ presentation │ February 2017
Chapter divider slide: Design must be alike to chosen cover style (28pt) - OMV Petrom Q4/16, FY 2016 and Strategy Update 2021+ February 16, 2017 ...
Business  Diagram Slide
Romanian macroeconomic and for PowerPoint
                           fiscal environment

           Macroeconomic environment                                                                                                  Fiscal framework

     2016 GDP growth1: 4.8% yoy                                                                                                                Supplementary taxation5
                                                                                                                                               extended until end-2017
     CPI annual inflation: -0.5% end-
     Dec;12-month average: -1.5%                                                                                                               Tax on constructions
                                                                                                                                               eliminated starting January 1,
     Budget balance: -2.4% of GDP
                                                                                                                                               2017
     end Dec 2016
                                                                                                                                               Engagement with stakeholders
     FDI: EUR 3.9 bn in Jan-Nov, 22%
                                                                                                                                               on Upstream taxation and
     higher yoy
                                                                                                                                               regulatory framework
     Investment grade rating: BBB-
     (S&P and Fitch), Baa3 (Moody’s)
     Demand in 2016 yoy: Fuels2 5%;
     Gas3 3%; Power4 1%

 1   Romanian National Institute of Statistics; 2 Fuels refer only to retail diesel and gasoline; 3 According to company estimates; 4 According to preliminary data available from the grid operator;
 5 Introduced at the beginning of 2013 simultaneously with the start of gas price liberalization

 4 | OMV Petrom │ 2016 results and Strategy Update 2021+ presentation │ February 2017
Chapter divider slide: Design must be alike to chosen cover style (28pt) - OMV Petrom Q4/16, FY 2016 and Strategy Update 2021+ February 16, 2017 ...
Economic environment
 Oil price (USD/bbl) and FX (USD/RON)                                                                  OMV Petrom Indicator refining margin (USD/bbl)

                                                                               4.18
              4.07
                                                                                                                   7.75
              42                                                                                                                                                                    7.14
                                                                                48

        Q4/15            Q1/16             Q2/16            Q3/16               Q4/16                          Q4/15            Q1/16            Q2/16            Q3/16            Q4/16

          Avg Urals price in USD/bbl (left scale)             Avg RON/USD (right scale)

 Gas prices (EUR/MWh)1                                                                                 Power prices in Romania (EUR/MWh)1
           20
                                                                                                                                                                                     47
                                                                                                                      45
                                                                                  18
                18
              17                                                                                                                                                                   41
                                                              15                                                   39

              13                                                   14
                                                                13                13
        Q4/15            Q1/16             Q2/16            Q3/16               Q4/16                          Q4/15            Q1/16            Q2/16            Q3/16            Q4/16

           Domestic HH2              Domestic NHH3,4                 Import4            CEGH5                 OPCOM spot base load                OPCOM spot peak load

1 Converted   from RON into EUR, FX rate: 4.5; 2 Regulated price for households; 3 Price for gas sold by producers to the suppliers of end-users in the free market; 4 As published by ANRE (Q3/16
price is the extrapolation of July 2016 price, latest published by ANRE); 5 Central European Gas Hub

   5 | OMV Petrom │ 2016 results and Strategy Update 2021+ presentation │ February 2017
Chapter divider slide: Design must be alike to chosen cover style (28pt) - OMV Petrom Q4/16, FY 2016 and Strategy Update 2021+ February 16, 2017 ...
2016 CAPEX and E&A in line with guidance
CAPEX cuts mainly driven by focus on the most profitable barrels
CAPEX incl. capitalized E&A                                                Group CAPEX incl. capitalized E&A (RON bn)

   2016 down by RON 1.3 bn, -34% yoy
                                                                                  3.9    -34%
                                                                                                                    3.6
        Upstream CAPEX down by RON 1.4 bn mainly
        on projects prioritization                                                               2.6
                                                                                  3.5
        Downstream CAPEX up by RON 51 mn largely                                                 2.1
        due to Q2/16 refinery turnaround
                                                                                  0.4            0.5
                                                                                  2015          2016               2017E
   2017E 40% higher than 2016                                                                          Upstream
                                                                                                       Downstream and Co&Other
        Focused on drilling, workovers and FRDs
                                                                          E&A expenditure (RON bn)
        Around 70 wells planned to be drilled
                                                                                  1.4
                                                                                         -76%
E&A Expenditure

   2015 included Neptun Deep drilling campaign and
   onshore deep exploration (JV with Repsol)                                                     0.3                0.4

   2017E includes drilling of six wells, onshore and
   shallow offshore                                                               2015          2016               2017E

  6 | OMV Petrom │ 2016 results and Strategy Update 2021+ presentation │ February 2017
Chapter divider slide: Design must be alike to chosen cover style (28pt) - OMV Petrom Q4/16, FY 2016 and Strategy Update 2021+ February 16, 2017 ...
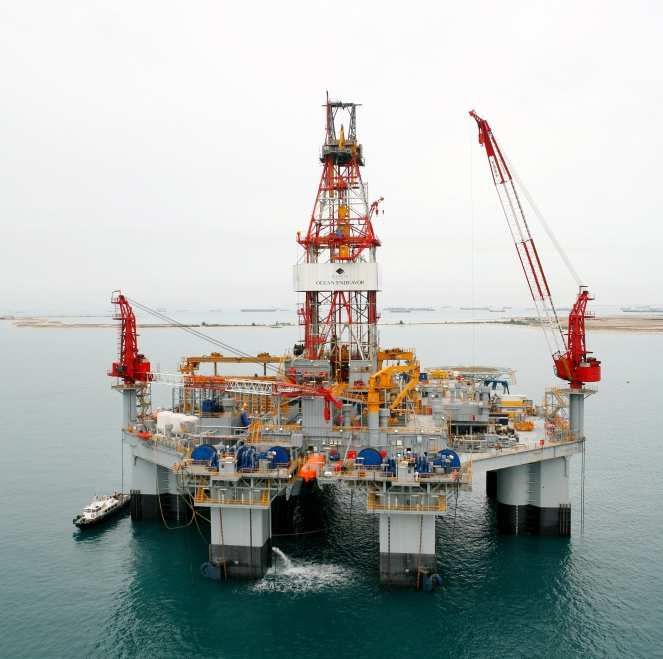
Strong execution of efficiency plans
     Upstream                                      CAPEX                       Operating cost savings                 FCF1
     OPEX in USD/boe                               RON bn                      RON mn                                 RON bn

                                                                                                                                    +1.2
                     -10%                                        -34%
             13.16                                        3.9                                 -500                                         1.6

                            11.85

                                                                        2.6

                                                                                                                             0.3

              2015          2016                          2015          2016           2015          2016                    2015          2016

                                                                                Corporate            Downstream Oil
                                                                                Downstream Gas       Upstream

1   FCF before repayment of loans and dividend payments

       7 | OMV Petrom │ 2016 results and Strategy Update 2021+ presentation │ February 2017
Chapter divider slide: Design must be alike to chosen cover style (28pt) - OMV Petrom Q4/16, FY 2016 and Strategy Update 2021+ February 16, 2017 ...
Chapter divider slide: Design must
             be alike to chosen cover style
             (28pt)

OMV Petrom Q4/16, FY 2016 and Strategy Update 2021+
February 16, 2017
Andreas Matje, CFO
Chapter divider slide: Design must be alike to chosen cover style (28pt) - OMV Petrom Q4/16, FY 2016 and Strategy Update 2021+ February 16, 2017 ...
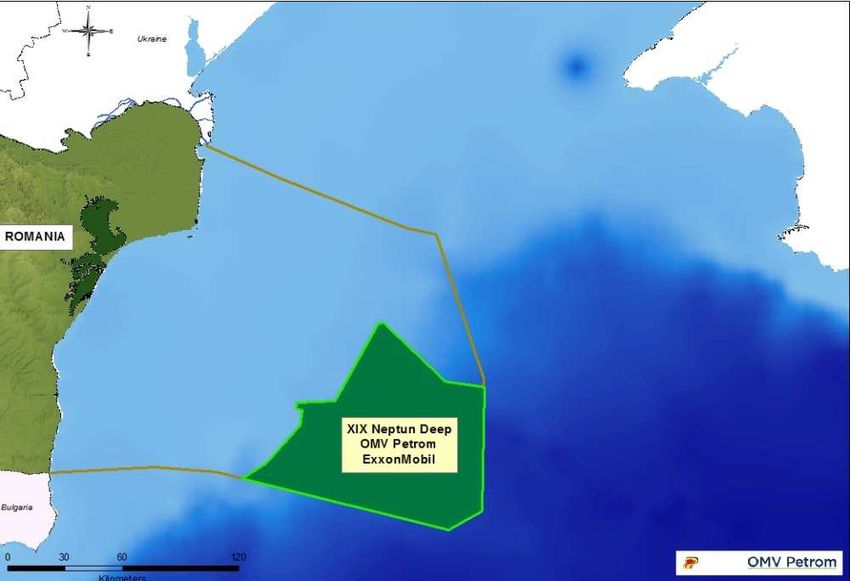
2016 Strong financial resilience

                                                                  +                                                           +

    Profitability impacted by                                         Strengthened balance sheet                                  Restoration of dividend
    ongoing market backdrop                                                                                                       distributions

         RON 1.7 bn Clean CCS EBIT,                                        Switched from RON 1.3 bn net                                 2016 proposed: RON 0.015/share1
         -33% yoy                                                          debt at end 2015 to RON 0.2 bn
                                                                                                                                        Dividend yield2: 5.3%
                                                                           net cash at end 2016
         RON 4.5 bn operating cash
                                                                                                                                        2016 FCF coverage of dividends:
         flow, -16% yoy                                                    FCF after dividends improved to
                                                                                                                                        1.8x
                                                                           RON 1.6 bn in 2016 vs. RON (0.3)
         Clean CCS EBIT margins
                                                                           bn in 2015
         decline partly mitigated by cost
         savings                                                           Equity ratio up 2pp to 64%

1   Executive Board’s proposal subject to approvals of the Supervisory Board and Annual General Meeting of Shareholders; 2 Using a share price of RON 0.2835 as at 10 February 2016

      9 | OMV Petrom │ 2016 results and Strategy Update 2021+ presentation │ February 2017
Chapter divider slide: Design must be alike to chosen cover style (28pt) - OMV Petrom Q4/16, FY 2016 and Strategy Update 2021+ February 16, 2017 ...
Cash flow development
Strong FCF generation
                                                                                     2016 vs. 2015
                                                                                         2016 operating cash flow resilience supported by:
RON mn                                       Q4/16     Q4/15     2016      2015
                                                                                          ► cost savings partly offsetting impact of
Cash flow from operating activities (CFO)     1,070     1,104     4,454     5,283           declining prices and refining margins
   Thereof, Depreciation, amortization and
                                                866     3,253     3,464     6,761         ► partly offset by unfavourable net working
   impairments including write-ups (D&A)
   Change in net working capital (NWC)         (191)      (31)      (27)      146
                                                                                            capital developments

Cash flow from investing activities (CFI)      (638)   (1,070)   (2,896)   (4,953)       Cash flow from investments reduced by RON 2
                                                                                         bn on prioritised CAPEX, mostly in Upstream
Cash flow from financing activities (CFF)     (239)       (48)    (376)     (794)
                                                                                         FCF after dividend at RON 1.6 bn achieved
Cash and equivalents at end of period         1,996       813     1,996       813
                                                                                         despite low oil price environment (Brent average
Free cash flow after dividends                  432        32     1,558     (301)        at USD 44/bbl, -17% yoy)

 10 | OMV Petrom │ 2016 results and Strategy Update 2021+ presentation │ February 2017
Income statement summary
  RON mn                     Q4/16       Q4/15     2016        2015             Q4/16 vs. Q4/15

  Sales                       4,595       4,518    16,247      18,145
                                                                                        Clean CCS EBIT margin development driven by cost
                                                                                        reductions, as yoy sales performance was relatively flat
  Clean CCS EBIT                454         211     1,694       2,522
                                                                                        Special items include charges of RON (193) mn in Q4/16
  EBIT                          335      (1,844)    1,469       (530)                   vs. RON (1,930) mn in Q4/15
  Financial result             (103)      (135)     (204)       (196)                   Effective tax rate at 31% due to non-deductible special
                                                                                        charges
  Taxes                         (73)       299      (227)        36

  Net income 1                  162      (1,675)    1,043       (676)
  Clean CCS net
                                263          68     1,162       1,801           2016 vs. 2015
  income 1

  EBIT margins2 evolution (%)                                                           Clean CCS EBIT margin declined due to the challenging
                                                                                        market environment
                                                       13.5
                     11.5
                                                                         9.9            EBIT turned positive, as 2015 was impacted by
   4.7                            6.3                  12.9              7.3
                      9.6                                                               impairments of Upstream assets
                                  6.0
                                                                                        Clean CCS net income down 36% on lower Clean CCS
   -40.8                                                                                EBIT and higher income taxes

Q4/15                Q1/16       Q2/16                 Q3/16            Q4/16
                                                                                1   Attributable to stockholders of the parent; 2 EBIT/Sales and Clean CCS EBIT/Sales
              EBIT margin      Clean CCS EBIT margin

    11 | OMV Petrom │ 2016 results and Strategy Update 2021+ presentation │ February 2017
Clean CCS EBIT overview
Q4/16 Clean CCS EBIT more than double yoy                                         Q4/16 vs. Q4/15
                                                                                          Improved Clean CCS EBIT due to lower exploration
                                                                                          expenses and depreciation

RON mn                          Q4/16       Q4/15     2016        2015                    Upstream result supported by higher oil prices (Urals
                                                                                          up 13%) and gas sales volumes
Clean CCS EBIT                      454        211     1,694       2,522
                                                                                          Downstream result improved, despite challenging
         Upstream                   246       (223)      575         919
                                                                                          environment
         Downstream                 292        269     1,122       1,169
                                                                                  2016 vs. 2015
          Thereof
                                    288        277     1,112       1,315
             Downstream Oil                                                               Upstream results impacted by lower oil prices (Urals
              Downstream Gas            5       (8)          11    (145)                  down 18%)

         Corporate and Other        (25)       (17)      (69)       (75)                  Downstream Oil result reflects lower refining margins
                                                                                          (-20%) and one month turnaround
         Consolidation              (60)       181           65      509
                                                                                          Downstream Gas: favorable evolution of provisions;
                                                                                          significantly higher power business contribution

                                                                                          Consolidation: milder decrease of crude prices in
                                                                                          2016 vs. 2015 led to a lower positive impact

  12 | OMV Petrom │ 2016 results and Strategy Update 2021+ presentation │ February 2017
Upstream Clean EBIT turnaround
Improved results based on lower Exploration and Other expenses

Key drivers Q4/16 vs. Q4/15                                                      Clean EBIT (RON mn)

                                                                                                                                         246
       Realised oil price +15%

       Decreased production costs (-3%), royalties &
       depreciation                                                                                                             293

                                                                                   -223
       Lower exploration expenses due to lower activity
       in Neptun
                                                                                                                     216
                                                                                               44         -85

       Production -3%                                                              Q4/15   Realization   Volume   Exploration   Other   Q4/16
                                                                                                                   expenses

 13 | OMV Petrom │ 2016 results and Strategy Update 2021+ presentation │ February 2017
Upstream – Improved efficiency
Production decline below upper limit guidance
Key drivers Q4/16 vs. Q4/15                                            Hydrocarbon production (kboe/d)
    Highlights
                                                                                                         -3%

                                                                             176         175             177            174      170
       OPEX, in USD/boe terms, -3%, as efficiency
       plans delivered lower services, personnel and                         81           81             81              79       78
       materials costs
                                                                             96           94             96              95       92

       Total Upstream production -3%, due to:                               Q4/15        Q1/16          Q2/16           Q3/16    Q4/16
                                                                                                  Oil and NGL     Gas
        surface facility works in Totea Deep
        partially compensated by Lebada East NAG                         OPEX (USD/boe)
                                                                                                           -3%

                                                                              12.1        12.3            12.1                     11.8
                                                                                                                          11.3

                                                                             Q4/15        Q1/16           Q2/16          Q3/16    Q4/16

 14 | OMV Petrom │ 2016 results and Strategy Update 2021+ presentation │ February 2017
Downstream results improved
Both Downstream segments displayed improved contribution
Key drivers Q4/16 vs. Q4/15                                                  Clean CCS EBIT (RON mn)
                                                                                                                             292
                                                                                    269                        13
                                                                                               11
      Higher contribution from both refining (due to cost
      savings) and retail

      Good gas business performance                                                                                          288
                                                                                    277

                                                                                     -8                                       5
      Refining margins -8%, impacted by higher cost of
                                                                                   Q4/15                                     Q4/16
      crude offsetting better product spreads                                              Downstream Oil   Downstream Gas

      Lower contribution of the power business

 15 | OMV Petrom │ 2016 results and Strategy Update 2021+ presentation │ February 2017
Downstream – Mixed operational performance
                                                                                       Refinery utilization rate (%)               Refined product sales
   Extracting record performance levels off key assets                                                                             volumes (mn t)
Key drivers Q4/16 vs. Q4/15                                                                                +4 pp                                    -5%

                                                                                            92%    94%             97%     96%       1.34                   1.39
                                                                                                                                                                    1.27
           Growth in retail sales of            +2%1                                                                                        1.14    1.13
                                                                                                           68%
        Highlights
         Higher gas sales volumes despite
         competition from import gas

                                                                                           Q4/15   Q1/16   Q2/16   Q3/16   Q4/16    Q4/15   Q1/16   Q2/16   Q3/16   Q4/16

           Refined product sales down reflecting
                                                                                        Gas sales volumes (TWh)                    Net electrical output (TWh)
           high base effect from Q4/15
                                                                                                           +7%
           Lower net electrical output due to                                                                                                       -28%
                                                                                                   14.0                    14.2
           unplanned outage of Brazi power plant                                            13.3
                                                                                                                                                             1.20
                                                                                                                   11.4              1.13
                                                                                                           10.7
                                                                                                                                                                     0.82

                                                                                                                                             0.42    0.48

                                                                                           Q4/15   Q1/16   Q2/16   Q3/16   Q4/16    Q4/15   Q1/16   Q2/16   Q3/16   Q4/16
1   Like-for- like: until end-2015 figures also reflected wholesales in the Republic of Moldova

    16 | OMV Petrom │ 2016 results and Strategy Update 2021+ presentation │ February 2017
Stronger balance sheet
Net debt/(cash) development (RON bn)                                                                  Main developments
                                                                                                        Switched from RON 1.29 bn net debt position at
                                                                                                        end 2015 to RON 0.24 bn net cash at end 2016
                      1.29               1.37            1.26

                                                                           0.12                         Equity ratio2

                                                                                       -0.24
                                                                                                            ►    end-2015: 62%
                Dec 31, 2015 Mar 31, 2016 Jun 30, 2016 Sep 30, 2016 Dec 31,2016
                                                                                                            ►    end-2016: 64%

Gearing               5%                 5%                5%                   0%       n.m.
ratio1

Clean CCS ROACE (%)                                                                                     ROACE yoy evolution reflects the challenging
                                                                                                        environment; ROACE slightly improving in Q4/16
                6.5                6.3

                                                        5.1
                                                                                               4.5
                                                                                3.8

        Dec 31, 2015         Mar 31, 2016         Jun 30, 2016          Sep 30, 2016    Dec 31,2016

1 Net   debt/(cash) divided by equity; 2 Total equity divided by total assets

  17 | OMV Petrom │ 2016 results and Strategy Update 2021+ presentation │ February 2017
Business
Outlook 2017Diagram Slide for PowerPoint

                     Assumptions                                                                 Targets

      Brent at USD 55/bbl
                                                                                   Production decline up to 3% yoy
      Refining margins to decline
                                                                                   CAPEX budget increased to EUR 0.8 bn
      Fuel demand on an upward trend                                               (~85% in Upstream)

      Gas demand broadly flat; high                                                Positive FCF after dividends
      competition and margin pressure
                                                                                   Strong balance sheet maintained
      Power demand relatively stable;
                                                                                   Attractive dividend
      positive average spark spreads

18 | OMV Petrom │ 2016 results and Strategy Update 2021+ presentation │ February 2017
Chapter divider slide: Design must
            be alike to chosen cover style
            (28pt)

OMV Petrom Q4/16, FY 2016 and Strategy Update 2021+
February 16, 2017
Mariana Gheorghe, CEO
Our path to long-term success

                                                                                                                    Deliver
                                                                                         Defined Execution
Solid Foundation                    Vision                   Clear Strategy                                    Sustainable Value
                                                                                               Plan
                                                                                                                   Creation

                                                                                           Sustainability of
                                                                                           reserves base

 Integrated business                                                                       Operational
                               Provider of
 model delivers                                               Enhance                      efficiency
                               sustainable access
 value through the                                            competitiveness of           Value chain          Attractive
                               to energy for
 cycle                                                        existing portfolio                                shareholder returns
                               everyday modern                                             Customer
                               life                                                        experience           Improved
                                                                                                                profitability
 Strong track record                                          Develop growth
 of capital                                                   options                                           Strong balance
                                                                                         Enabled by:            sheet
 management
                               Capitalizing on                                             People and           Readiness for new
                               OMV Petrom’s                   Expand the                   Organizational       world of energy
 Strong cash                   existing assets and            regional footprint           Culture
 generation                    skills
                                                                                           Sustainability
                                                                                           Technology and
                                                                                           Innovation

 20 | OMV Petrom │ 2016 results and Strategy Update 2021+ presentation │ February 2017
2021+ Centered around three key pillars

 Enhancing                                       Developing                             Regional
 competitiveness in                              growth options                         expansion
 the existing portfolio

                           Commitment to deliver attractive shareholder returns

21 | OMV Petrom │ 2016 results and Strategy Update 2021+ presentation │ February 2017
Exploiting potential in existing upstream field
portfolio
      Maximize economic recovery                                                                Oil and Gas recovery rates
            Mature contingent resources through:                                                                           28%                                55%
                    infill drilling campaigns                                                                                                   50%
                                                                                                        25%
                    selected field redevelopment programs
            Adding ~150 mn boe1 reserves from existing
            fields                                                                                   Current 2016        Ultimate           Current 2016     Ultimate
                                                                                                    recovery rates    recovery rates3      recovery rates recovery rates3
            Leading to improved ultimate recovery rates                                                              Oil                                     Gas

            Key contributor to RRR2 target                                                      Additional production expected from economic
                                                                                                recovery offsets loss from streamlining portfolio
                                                                                                                                                           net ~+25
                                                                                                                                                           kboe/day
      Streamline portfolio
            Simplify footprint and reduce complexity
                                                                                                      Economic recovery                  net ~+3
            Expect production loss of up to 6 kboe/day from                                           Streamline portfolio              kboe/day
            2018

                                                                                                                                         2021                2026
1   Life of field; 2 Reserves Replacement Rate; 3 Life of field including strategic ambitions

     22 | OMV Petrom │ 2016 results and Strategy Update 2021+ presentation │ February 2017
Relentless pursuit of operating efficiencies
                                                  Focus on the most profitable barrels
                                                  Commitment to operational excellence
     Upstream
                                                  Further reduction of unit costs
                                                  Modernization and simplification of installations and facilities

                                                  Capturing of highest integrated operational value
                                                  Maximization of availability and utilization of downstream plants
    Downstream                                    Further improvement of the refinery operations to international benchmarks
                                                  Increase in throughput per filling station

                                                  Focus on value over volume
                                                  Ongoing corporate SG&A1 savings
    Group
                                                  Agile and efficient organization
                                                  Technology driven initiatives

1   Selling, General and Administration Expense

    23 | OMV Petrom │ 2016 results and Strategy Update 2021+ presentation │ February 2017
Mature Neptun Deep opportunity

                                                                             OMV Petrom (50%), ExxonMobil (50%, Operator)
                                                                             First exploration drilling campaign in 2011 – 2012
                                                                                Domino-1 well gas discovery: a play opener
                                                                             Two seismic acquisition campaigns: 2009; 2012 – 2013
                                                                             Second exploration drilling campaign 2014 - 2016
                                                                                Seven wells drilled; most of them encountered gas
                                                                                Successful well test of Domino structure
                                                                             Committed to assess commercial viability based on
                                                                             encouraging results
                                                                             Key contributor to RRR1 target2

1 Reserves   Replacement Rate; 2 If commercially viable

 24 | OMV Petrom │ 2016 results and Strategy Update 2021+ presentation │ February 2017
Capture downstream opportunities

Increase integrated value                       Conclude modernization of fuel           Explore value-adding
through refining and retail                     storage network                          opportunities for gas
investments
                                                  Finalise last depot modernization in
  Polyfuel project to upgrade production          2018                                   Explore technological
  mix (operative 2019)20                                                                 opportunities capitalizing on
  Invest in new retail stations in high
                                                                                         skills and assets
  traffic areas

25 | OMV Petrom │ 2016 results and Strategy Update 2021+ presentation │ February 2017
Enhance offer and customer experience
                                                               Increase throughput per
                                                              filling station in Romania
                                                                          (mn l)
                                                                                  >5
   Downstream

                                                                       4.6
                         Value for money                                                   High quality leader
      Oil

                                                                       2016       2021

                   Innovation and partnerships to strengthen Petrom and OMV brand positioning
   Downstream
      Gas

                       Develop partnerships                       Expanding domestic       Product innovation
                                                                        reach

26 | OMV Petrom │ 2016 results and Strategy Update 2021+ presentation │ February 2017
Regional expansion to complement portfolio
Leverage our local know-how
   Upstream                                                                     Downstream Gas

                                                                              Transport capacities
                                                                              planned
                                                                              existing

             Capture synergies with existing operations                                  Diversify sales channels for current
                                                                                         production (subject to interconnectors
             ~80 mn boe reserves targeted from near-term                                 development)
             acquisitions
                                                                                         Grow regionally with Neptun1 volumes
             Prioritise Caspian and Western Black Sea                                    monetization
1 If   commercially viable

   27 | OMV Petrom │ 2016 results and Strategy Update 2021+ presentation │ February 2017
Success built on three core
strategic enablers

                                                                      People and Organizational Culture
                                                                      We are the energy

                                                                           Sustainability
                                                                           Respect the future

                                                                      Technology and Innovation
                                                                      Innovate for the future

28 | OMV Petrom │ 2016 results and Strategy Update 2021+ presentation │ February 2017
Chapter divider slide: Design must
             be alike to chosen cover style
             (28pt)

OMV Petrom Q4/16, FY 2016 and Strategy Update 2021+
February 16, 2017
Andreas Matje, CFO
Portfolio investments
EUR ~5 bn cumulative Capex anticipated over 2017 - 2021
Cumulative Capex allocation                                                  Upstream portfolio

          100%
                                                                                 Maximize value of current mature field
                                                                                 portfolio
                                                                                 Secure improved recovery from contingent
           80%                                                                   resources
                                                                                 Deliver further growth in Romania
           60%
                                                                                 Drive regional expansion

           40%
                                                                             Downstream portfolio
                                                                                 Continue operational efficiency programs
           20%
                                                                                 Build new filling stations
                                                                                 Perform planned turnarounds
                           2017 - 2021                                           Secure long term growth

                         Downstream       Upstream

 30 | OMV Petrom │ 2016 results and Strategy Update 2021+ presentation │ February 2017
2021 Clear, robust targets

                                      RRR1                                                                                Clean CCS ROACE3
                                   100% by 2021                                                                              > 10% by 2021

                                       CAPEX                                                                                    Gearing
                                  EUR ~1 bn p.a.                                                                     Maintain a strong balance sheet

                             FCF2 after dividends                                                                               Dividend
                        Positive for majority of period                                                                     Attractive returns

1 Reserves   Replacement Rate; 2 Free Cash Flow; 3 Clean Current Cost of Supply Return on Average Capital Employed

  31 | OMV Petrom │ 2016 results and Strategy Update 2021+ presentation │ February 2017
Dividend considerations

  Commitment to deliver a competitive shareholder return by paying an attractive dividend

 Considerations                                                                                                              2016 DPS2 proposal: RON 0.015

                                                                                                                            EUR mn                   347
    Earnings
                                                    Stress tested forecasts under various pricing
                                                    points and FX assumptions
    Oil & Gas prices                                                                                                                                                      189
                                                    Upcoming CAPEX
    CAPEX                                           FCF1 generation, cash buffer
                                                                                                                                                                  55%
                                                    Debt structure, potential acquisitions
    FCF and Balance sheet
                                                                                                                                                                                   3
                                                                                                                                                     FCF                Dividend

                                       EUR ~900 mn returned to shareholders over 2012-2015
             Confidence on 2021+ plan allows improved visibility toward shareholder returns
1 Free   Cash Flow; 2 Dividend per share; 3 Executive Board’s proposal subject to approvals of the Supervisory Board and Annual General Meeting of Shareholders

   32 | OMV Petrom │ 2016 results and Strategy Update 2021+ presentation │ February 2017
Chapter divider slide: Design must
            be alike to chosen cover style
            (28pt)

OMV Petrom Q4/16, FY 2016 and Strategy Update 2021+
February 16, 2017
Mariana Gheorghe, CEO
Our vision

                                                                             Committed to enhance
                                                                              customer experience
  Leading integrated
    regional player
                                                                       Regional growth leveraging
                                                                          Romanian expertise

      Sustainable access to energy for everyday modern life

34 | OMV Petrom │ 2016 results and Strategy Update 2021+ presentation │ February 2017
Q&A
Contact Investor Relations

               OMV Petrom Investor                                                      2017 Financial Calendar
               Relations

                                                                           April 25: Annual General Meeting of
                                                                           Shareholders

                                                                           May 11: Q1 2017 results
  Tel.: +40 372 161 930
  E-mail: investor.relations.petrom@petrom.com                             August 10: Q2 and HY 2017 results
  Homepage: www.omvpetrom.com                                              November 9: Q3 2017 results

36 | OMV Petrom │ 2016 results and Strategy Update 2021+ presentation │ February 2017
You can also read