Characteristics and Determinants of Domestic Food Waste: A Representative Diary Study across Germany - MDPI
←
→
Page content transcription
If your browser does not render page correctly, please read the page content below
sustainability

Article
Characteristics and Determinants of Domestic Food
Waste: A Representative Diary Study across Germany
Ronja Herzberg 1, *, Thomas G. Schmidt 1 and Felicitas Schneider 2
 1    Thünen Institute of Rural Studies, 38116 Braunschweig, Germany; thomas.schmidt@thuenen.de
 2    Thünen Institute of Market Analysis, 38116 Braunschweig, Germany; felicitas.schneider@thuenen.de
 *    Correspondence: ronja.herzberg@thuenen.de

 Received: 20 May 2020; Accepted: 5 June 2020; Published: 9 June 2020

 Abstract: As it is the case in many industrialized countries, household food waste accounts for a large
 share of total food waste in Germany. Within this study, the characteristics of edible and inedible
 domestic food waste, the reasons for discarding food and the potential influence of socio-demographic
 factors on food waste generation are assessed. A data set of 6853 households who participated
 in a diary study in 2016 and 2017 was analyzed by use of descriptive statistics, parametric tests,
 and linear regression. The results indicate that perishable products such as vegetables, fruits, and
 bread are mainly affected by disposal. Moreover, household food waste occurs due to quantity
 problems at purchase for small households and quantity problems at home for larger households and
 households with children. Despite statistically significant differences in food waste amounts between
 household lifecycle stages, age of the head of household, household size, and size category of the
 municipality, socio-demographic factors have a limited power in predicting a household’s food waste
 level. The study has important implications for food waste policy and research regarding the issues
 of food waste prevention measures, quantification methodologies, and monitoring implementation.

 Keywords: food waste; household; diary study; Germany; food waste behavior; socio-demographic
 characteristics; consumers

1. Introduction
       Domestic food waste is highlighted by Sustainable Development Goal 12.3 as one of the food
waste streams which should be reduced by 50% until 2030 [1]. This focus is justified because in
industrialized regions households contribute the highest share of food waste in comparison to other
stages of the food supply chain (FSC). At the same time, the invested resource input, corresponding
emissions, and impacts on the environment until food reaches consumers accumulate along the entire
FSC [2,3]. Thus, the prevention of food waste at the very end of the FSC seems to be especially desirable
and effective. The design of a proper framework, strategy and prevention measure bundle to tackle
household food waste requires comprehensive information on the generation of, characteristics of, and
factors influencing domestic food waste. Nevertheless, as households differ in socio-demographic
characteristics and behave very differently (due to external framework conditions, past and present
experiences, knowledge, motivation, life cycle status, etc.), the collection of representative data sets
requires great effort. The first research study on household food waste started in 1895, and the research
intensity has increased enormously in recent years [4]. According to Xue et al. [3], up to 2015, 49% of the
screened global literature on food loss and waste targeted domestic food waste. Nevertheless, there is
still a lack of representative, reliable primary data on the household level related to the generation of
food waste and especially to the complex interaction of individuals and existing framework conditions
leading to domestic food waste [3]. Thus, research is still necessary to analyze households in order to

Sustainability 2020, 12, 4702; doi:10.3390/su12114702                      www.mdpi.com/journal/sustainability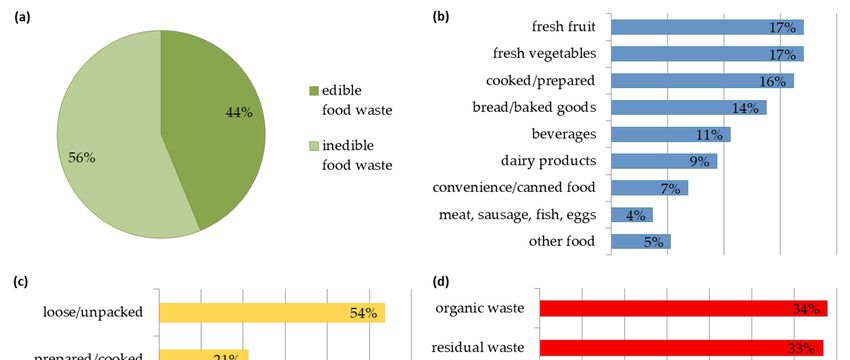
Sustainability 2020, 12, 4702                                                                      2 of 17

identify and design efficient food waste prevention policies applicable for different households and
leading to a significant and long-term food waste reduction.
     Food waste within households in Germany is an important issue as it is estimated that 52% of all
food loss and waste occurs at this stage of the FSC [5]. As a member of the European Union, Germany
is obliged to report domestic food waste quantities (among others) to the European Commission from
2020 onwards [6]. In order to ensure proper data collection among Member States, the Delegated
decision 2019/1597 provides specific requirements on the methodological issues to be considered.
One suggested methodology for food waste quantification at the household level is the use of diaries.
Diaries, as a direct method, can cover all disposal of food and drinks and all disposal routes used,
whereas indirect collection methods cannot include this information. This self-reporting methodology
has been used in several studies, not only for quantification of domestic food waste, but also to collect
information on food waste composition. Other factors of interest are root causes, disposal paths,
context with socio-demographic characteristics, motivation, and behavioral indicators. Such factors are
assumed to add the designing of prevention strategies and measures [7–9]. Nevertheless, the intended
and unintended underreporting by respondents has frequently been recognized as a disadvantage of
diaries for quantification purposes [10–15].
     The obligation to report data was the starting point for the commissioning of a representative diary
study among households in Germany. The corresponding data set is the basis of the present paper.
It depicts the first representative national data set on the generation of total food waste, including
drinks, using direct methodology while covering several disposal routes. The aim of this paper is
to gain a better understanding of food waste behavior of households by analyzing the underlying
disposal reasons. The paper uses German data to consider disposed product categories, condition
at disposal, and disposal routes. Moreover, potential differences in food waste amounts between
socio-demographic household characteristics are assessed. The paper presents the results and discusses
strengths and weaknesses of the study design to establish a reliable time series towards national and
European food waste reporting. This includes the suitability of diary methodology for domestic food
waste accounting. Moreover, the study provides implications for policy and future research in the field
of household food waste prevention in Germany and other high-income countries.

2. Materials and Methods
     A representative self-reporting diary survey was carried out between July 2016 and June 2017 by
the German market research institute GfK SE on behalf of the German Ministry of Food and Agriculture
(BMEL) [16]. The corresponding data set provides the basis of the present paper.

2.1. Data Set
     The sample was drawn from the ConsumerScope Panel of the GfK SE, whose participants are
already familiar with the diary reporting procedure. For each month, a representative sample was
selected for the Federal Republic of Germany (min. 500 households) according to the criteria of the
Federal Bureau of Statistics applied in the frame of the micro-census, namely:

•     place of residence within the federal state
•     size category of municipality
•     age of head of household
•     net income of household
•     household size
•     employment of head of household
•     formal education
•     number of children in the household
•     living circumstances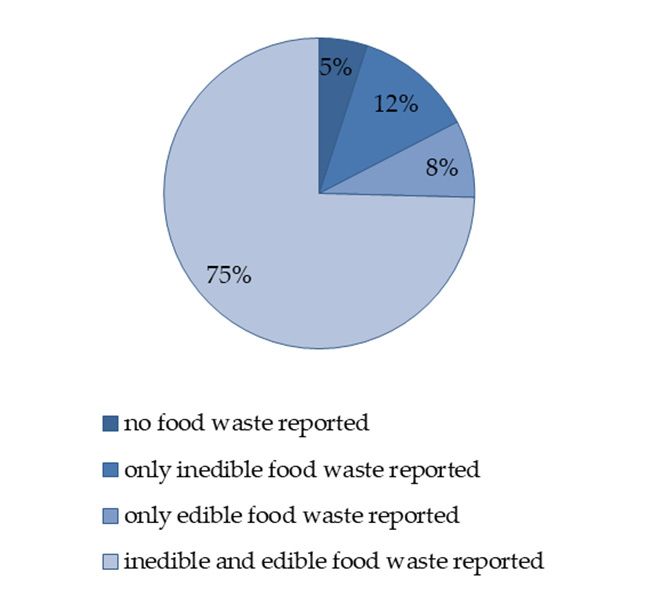
Sustainability 2020, 12, 4702                                                                                      3 of 17

      The necessary material to undertake a diary survey (such as paper and pencil diary, operation
instructions and Supplementary Materials) was sent to the selected households. The response rate
of the respective households was 85%. The pool of responsive households was again adjusted with
regards to the criteria region, age of head of household, and household size to prevent a skewness of
the sample.
      Each household participating in the survey recorded all food and drink waste (further called
“food waste”) accruing within the household over a period of 14 days. Each month, a different set of
households reported for such a 14-day-period. In total, 6853 households reported their food waste
within the study, which means on average 571 households per month. In addition to the mass of the
discarded food items, a set of further characteristics of the wasted food, as well as of the household
itself, was selected and surveyed for each disposal act (Table 1). For further details on the surveyed
socio-demographic characteristics, see also Tables A1 and A2 in the Appendix A.

      Table 1. Characteristics of wasted food and socio-demographic characteristics of the households
      sampled within the survey.

         Characteristics of Wasted Food                 Socio-demographic Characteristics of Sample Household 1
        Food waste masses per waste act                                          Household size
                Product group                                               Household lifecycle stage
                Disposal route                                              Age of head of household
           Food condition at disposal                                     Size category of municipality
               Disposal reason
                   1   Detailed characteristic values are presented in the results part and in Tables A1 and A2.

     Moreover, all food waste had to be classified as edible or inedible in the sense that for example
the peel of certain fruits and vegetables, such as banana or watermelon, is generally presumed to
be inedible. However, the classification of food waste as edible or inedible took place without any
clear definition and hence was at the participants’ discretion. For simplification of the classification,
examples of inedible food fractions were listed in the diary material, including peels and cores of fruit
and vegetables, bones, skin, cheese rinds, coffee grounds, and tea bags. To determine the mass of food
waste per disposal act, the participants could decide for themselves whether to measure or estimate the
mass or volume or indicate the number of pieces discarded. A conversion sheet (piece to mass) was
provided with the survey diary for estimation. In the case of piece indication, the respective mass was
calculated subsequently by GfK SE with the aid of a conversion table. The final data set was provided
by BMEL to the authors.

2.2. Extrapolation
      An extrapolation to national scale is valid since the sample households were selected
representatively based on the mentioned criteria and the extrapolation was carried out according to
Equation (1). Based on the assumption that the 14-day sampling period can be seen as representative for
the respective month, the total mass of food waste in the Federal Republic of Germany was calculated
per year. To enable this assumption, the sampled households were asked to select a 14-day period
which represents a common behavior of their household. The individual weighting factor (f, Equation
(1)) enables the multiplication of each household according to the respective characteristic values
of the representative criteria mentioned above. This means that households which more accurately
represent the population than others are assigned a higher weight. The weighting factor was based on
the household characteristics presented in Table S1. Although there are indications of underreporting,
no arithmetical adjustment of the data was made for this paper apart from extrapolating the reported
data to annual waste quantities. The problem of underreporting will be discussed further in Section 4.
                                                         Xn                   d × 12
                                                   M=               mk × fk          ,                                (1)
                                                             k =1               14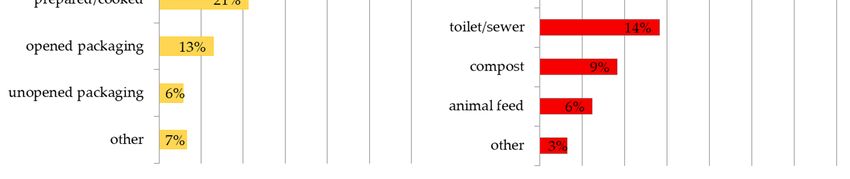
Sustainability 2020, 12, 4702                                                                       4 of 17

      M = total food waste mass of all households in Germany (kg/year)
      k = sample household
      m = actual mass of food waste of respective household [kg]
      f = individual weighting factor of household according to characteristic values
      d = number of days of the respective sampling month
      n = total number of sampled households

2.3. Statistical Analysis
     The statistical analysis was carried out in three subsequent steps. In a first step, a descriptive
analysis of the data set was carried out to get a general overview of characteristics, such as edibility,
product group, condition at disposal and disposal route.
     In a second step, the reasons of households for discarding food were examined with regard to
product groups, household size groups and lifecycle stages. This focus was selected because the
disposal reason has major implications for potential prevention actions. The first two steps were
carried out with the edible fraction of food waste only, which is of specific interest regarding potential
policy and prevention measures.
     The third step was undertaken with the whole data set, including the edible and inedible fraction
of food waste, following the guidelines for food waste monitoring set by the European Commission.
Potential drawbacks of the monitoring methodology suggested by the European Commission may
thus be detected. Within this step, an explorative analysis (boxplots) was applied in the statistical
software R Studio (R) to get an overview on food waste masses of households with regard to the
sampled socio-demographic household characteristics. Subsequently, inductive statistics were applied
in R to test for statistically significant differences in food waste levels between

•     household lifecycle stages,
•     age of the head of the household,
•     household size (number of persons),
•     size category of municipality, and
•     level of education

by carrying out an analysis of variance (ANOVA). For statistically significant variables, as suggested
by the omnibus test ANOVA, the post-hoc Tukey-Kramer test was applied to detect significantly
different means between all pairs of groups. The Kramer multiple comparison procedure can be used
for unequal sample sizes, as is the case for all variables in this study.
     In a final step, potential dependencies of the amount of food waste (dependent variable) on
other variables were examined by the aid of weighted multiple linear regression. For both analyses,
the specific weighting factors of each household (f, Equation (1)) were applied to ensure an inference on
the parent population. As both tests demand normal distribution, the original data was transformed
by use of Box-Cox power transformation (Figure S1 in Supplementary Materials). Normal distribution
of residuals and homogeneity of variances of the transformed data as well as of residuals were given
for all variables.

3. Results
     The distribution of food waste amounts per household and 14-day-period is right-skewed
(Figure 1a) indicating that many households reported smaller amounts of food waste, and a smaller
number of households reported comparably large amounts. A total of 5% of all households reported
no food waste at all and a further 12% only inedible food waste (Figure 1b). Another 8% of the sample
households indicated having discarded only edible food waste, while the majority of 75% reported both
types. Those 346 households reporting no food waste were excluded from the investigation for any
further analysis. The reason was that it was assumed to be very unlikely to have no food waste at all
within a period of 14 days, particularly as households on vacation were excluded in advance. A sample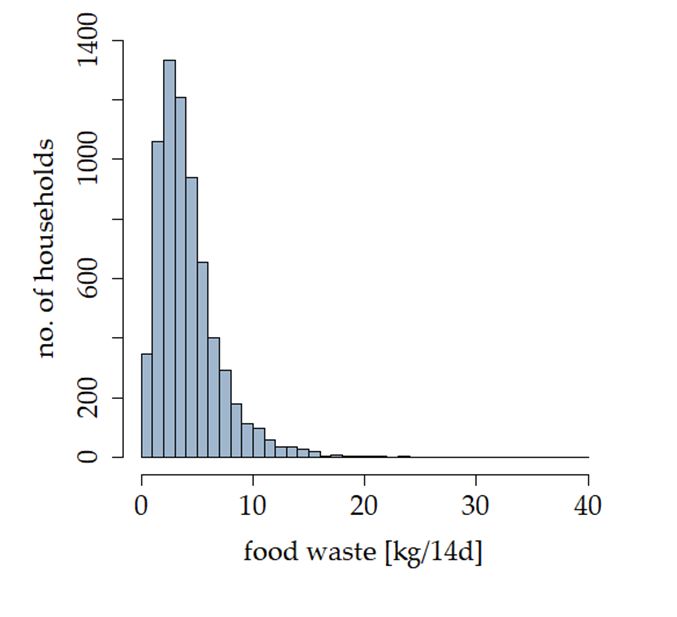
number of households reported comparably large amounts. A total of 5% of all households reported
no food waste at all and a further 12% only inedible food waste (Figure 1b). Another 8% of the
sample households indicated having discarded only edible food waste, while the majority of 75%
reported both types. Those 346 households reporting no food waste were excluded from the
investigation for12,any
Sustainability 2020, 4702further analysis. The reason was that it was assumed to be very unlikely 5 ofto17
have no food waste at all within a period of 14 days, particularly as households on vacation were
excluded in advance. A sample of 6507 households remained. The food waste amount per household
of 6507
and households(excluding
14-day-period remained. households
The food waste amount
reporting noper household
food and 14-day-period
waste) ranged (excluding
up to 37.8 kg, with a
households reporting no food waste) ranged up to 37.8 kg, with a mean of 3.4
mean of 3.4 kg and a median of 2.7 kg. After extrapolation to national scale, the data accumulate kg and a median to aof
2.7 kg.
total After of
amount extrapolation
household foodto national
waste ofscale, the3.7
about data accumulate
million to a total
tons within the amount of household
study period food
of one year.
waste of about 3.7 million tons within the study period of one year. With a total
With a total number of 41.3 million households and 82.8 million inhabitants in Germany [17], number of 41.3 million
households
household andwaste
food 82.8 million
sums upinhabitants
to 89.5 kginperGermany
household[17], household
and year andfood44.6 waste
kg persums upand
person to 89.5
year, kg
per household and year and 44.6 kg per person and year, respectively.
respectively.
(b)
(a)
Figure
Figure1.1.Number
Numberof of households total food
households per total foodwaste
wasteamount
amountcategory
categoryinin
kgkg
perper
14 14
dayday period
period (a)
(a) and
and shares of household food waste reporting
shares of household food waste reporting (b). (b).
OfOf all food
foodwaste
wastegenerated,
generated,56%56%
was was
classified as inedible
classified and 44%and
as inedible as edible
44% by as the participating
edible by the
households (Figure
participating households2a). (Figure
Figure 2a).
2b–dFigure
provides2b–dmore detailed
provides moreinformation on the edible
detailed information on thesection
edibleof
reported
section of food waste.
reported foodWith respect
waste. Withtorespect
the product
to thecategories (Figure 2b),
product categories fresh fruit
(Figure and vegetables
2b), fresh fruit and
clearly represent
vegetables the main disposed
clearly represent the main food categories
disposed (both 17.1%),
food categories (bothfollowed by cooked
17.1%), followed byand prepared
cooked and
food (16.2%).
prepared food Bread andBread
(16.2%). bakedandgoods alsogoods
baked represent
alsoa represent
product group disposed
a product groupin large amounts
disposed with
in large
13.8% of all food waste. Animal products such as dairy (9.4%) and meat, fish,
amounts with 13.8% of all food waste. Animal products such as dairy (9.4%) and meat, fish, and eggsand eggs (3.7%) were
discarded
(3.7%) weretodiscarded
a smaller toextent. Whenextent.
a smaller looking at thelooking
When condition of edible
at the foodofatedible
condition disposal,
foodmore than half
at disposal,
of all than
more discarded
half food
of allwas described
discarded as loose/unpacked,
food was described while another 21% was
as loose/unpacked, prepared
while or cooked
another 21% was and
13% in opened
prepared packaging.
or cooked and 13% Onlyin6% was still
opened in its original
packaging. Onlyunopened packaging.
6% was still The major
in its original disposal
unopened
routes of the
packaging. Theparticipating
major disposal households
routes ofwere the organic waste
the participating bin used
households for the
were 34%organic
of all edible
waste food
bin
waste,
used forand
34% toofa similar extent,
all edible foodthe residual
waste, and waste bin with
to a similar 33%. the
extent, Another 14%waste
residual of edible food waste
bin with 33%.
was discarded
Another 14% of into
ediblethefood
sewer while
waste was9% and 6% were
discarded recycled
into the sewer for home
while 9% composting
and 6% wereand reusedfor
recycled as
animal
home feed, respectively.
composting The as
and reused underlying
animal feed,datarespectively.
regarding absolute numbers data
The underlying of food waste masses
regarding absoluteare
providedofinfood
numbers the supplement
waste masses (Table S2).
are provided in the supplement (Table S2).Sustainability 2020, 12, 4702 6 of 17
Sustainability 2020, 12, x FOR PEER REVIEW 6 of 19
2. (a)
FigureFigure Share
2. (a) Share of edibleand
of edible and inedible
inedible food food
waste waste
reportedreported by households;
by households; (b) shares of (b) shares of
product
product groups; (c) condition at disposal and (d) disposal route of edible food waste
groups; (c) condition at disposal and (d) disposal route of edible food waste reported by sample reported
by sample households.
households.
3.1. Reasons of Disposal
3.1. Reasons in Relation
of Disposal totoSocio-Demographic
in Relation and
Socio-demographic and Food
Food Characteristics
Characteristics
An important
An importantindicator
indicatorforforthe
theidentification
identification ofofpotentials
potentials forfor action
action is reason
is the the reason for disposal
for disposal
(Figure(Figure 3). Classes
3). Classes andand answeroptions
answer options were
were predefined
predefinedbyby GfK
GfKSE SE
within the diary
within and could
the diary be
and could be
answered by the households by indicating their main and sub-reason for
answered by the households by indicating their main and sub-reason for the disposal of the respectivethe disposal of the
respective
food item. The food
vast item. The of
majority vast majority
edible foodofstuff
edible food stuff
(57.6%) (57.6%) was
was disposed duedisposed due to the of the
to the durability
durability of the product as indicated by the participants. Most of these products were apparently
product as indicated by the participants. Most of these products were apparently spoilt while only
spoilt while only 5.8% were disposed as a consequence of an expired best-before date. 21.3% of all
5.8% were disposed as a consequence of an expired best-before date. 21.3% of all food waste was
food waste was discarded due to a quantity-related problem at home, e.g., too much food had been
discarded
cooked orto prepared
due a quantity-related
within the problem at home,
household. e.g., too
Another much
11.9% wasfood had been
wasted as acooked
result or
ofprepared
a
withinquantity-related
the household.problem
Another 11.9% was
at purchase wasted
such as tooas
biga packaging
result of asizes.
quantity-related
Only 1.7% of problem at purchase
the households
such as too bigthat
indicated packaging
a too big sizes. Only
packaging 1.7%
size wasof the households
bought because it was indicated
cheaper or that
on aoffer.
too Other
big packaging
reasons size
such as because
was bought bad taste,itwrong preparation,
was cheaper andoffer.
or on storage play areasons
Other minor role foras
such thebad
disposal
taste,ofwrong
recorded food
preparation,
products.
and storage play a minor role for the disposal of recorded food products.
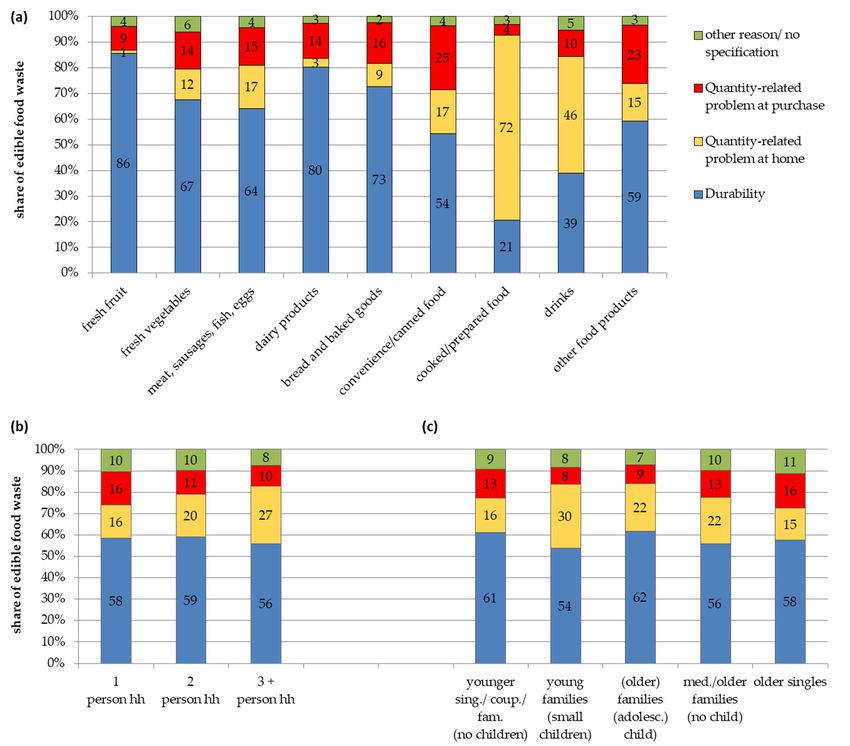
A detailed look at the disposal reasons with respect to household size and structure (see also
Table S3) shows that especially small households, such as one person and older single households
(both ca. 16%) discard food products as a result of quantity-related problems at purchase (Figure 4b,c).
Moreover, households without children indicate in around 13% of all cases quantity-related problems
at purchase as the disposal reason while only 8% to 9% of households with children listed this as the
main reason. Larger households of three persons or more, as well as households with small children,
indicate disproportionally often quantity-related problems at home as a major reason for disposal.
Single households and young households without children seem to be less affected by this category of
disposal reasons. The overall main reason recorded is durability with relevance of 54% to 62%, which
can be explained by the product types wasted (Figure 4a).
The identification of the main disposal reasons by product group revealed that particularly fresh
fruit and dairy products are affected by a limited durability, followed by bread and baked goods and
fresh vegetables. Quantity-related problems at home occur mainly for cooked and prepared food as
well as for beverages, such as coffee and tea. Quantity-related problems at purchase, for instance large
packaging or portion sizes, result disproportionally often in the disposal of convenience products
(including canned food) but also of bread and baked goods. Convenience products are moreover oftenSustainability 2020, 12, 4702 7 of 17
discarded for “other reasons” which can be traced back to an “accident” (32% of other reasons), such
as a freezer defect or infestation, and needed shelf space (25% of other reasons).
Figure
Sustainability 3.x Disposal
2020, 12, reasons
FOR PEER REVIEW of edible food waste reported by sample households. 8 of 19
FigureFigure 4. Indicated
4. Indicated reasons
reasons forfor disposalof
disposal of edible
edible food
foodwaste
waste(a)(a)
byby
type of food
type product;
of food (b) by(b) by
product;
household size group; (c) by household lifecycle
household size group; (c) by household lifecycle group. group.
1
3.2. Differences in Food Waste Amounts between Socio-demographic Household Characteristics
A weighted analysis of variance (ANOVA) was performed to test for significant differences in
food waste amounts (edible and inedible) between households with distinct socio-demographic
characteristics. The individual weighting factors of households according to the characteristic values
(f, Equation (1)) were applied within the analysis. This enables the transfer of results from the sample
to the whole population of the Federal Republic of Germany. The Boxplots (Figure 5) seem to
indicate that between-group differences with respect to household lifecycle stage, age of the head of
the household, household size, size category of municipality, and level of education are oftenSustainability 2020, 12, 4702 8 of 17
3.2. Differences in Food Waste Amounts between Socio-Demographic Household Characteristics
A weighted analysis of variance (ANOVA) was performed to test for significant differences
in food waste amounts (edible and inedible) between households with distinct socio-demographic
characteristics. The individual weighting factors of households according to the characteristic values (f,
Equation (1)) were applied within the analysis. This enables the transfer of results from the sample to
the whole population of the Federal Republic of Germany. The Boxplots (Figure 5) seem to indicate that
between-group differences with respect to household lifecycle stage, age of the head of the household,
household size, size category of municipality, and level of education are often negligible in absolute
terms. Substantial differences become only visible for household lifecycle stage and household size.
Sustainability 2020,
Nevertheless, 12, x FOR
according toPEER REVIEW statistically significant differences in the amount of food waste
the ANOVA, 9 of 19
exist between factor levels of all tested groups (Table 2).
Figure 5. Total amount of household (hh) edible and inedible food waste within 14 days per (a)
household
Figure 5.lifecycle stage, (b)
Total amount ofage of the head
household (hh)ofedible
the household, (c) household
and inedible food wastesize, (d) size
within 14category
days perof(a)
municipality, and (e) level
household lifecycle of(b)
stage, education (n head
age of the indicates sample
of the sizes; (c)
household, outliers are excluded).
household size, (d) size category of
municipality, and (e) level of education (n indicates sample sizes; outliers are excluded).
Table 2. Results of statistical analysis: average food waste masses per household, p-values of
ANOVA results of Tukey-Kramer post-hoc test, and r2-values of linear regression models.
Avg. Mass
Groups and Adjusted r²
of Food p-Values Group Differences
Characteristic (Linear
Waste (ANOVA) (Tukey-Kramer) 1
Values Regression)
(kg/14d)
household lifecycle stageSustainability 2020, 12, 4702 9 of 17
Table 2. Results of statistical analysis: average food waste masses per household, p-values of ANOVA
results of Tukey-Kramer post-hoc test, and r2 -values of linear regression models.
Avg. Mass of Food p-Values Group Differences Adjusted r2 (Linear
Groups and Characteristic Values
Waste (kg/14d) (ANOVA) (Tukey-Kramer) 1 Regression)
household lifecycle stage
younger singles/young families and
2.55 a
couples without children
younger families with small and
school children
4.17 2 × 10⁻¹⁶ b 0.086
families with adolescent
4.24 b
children/older families with children
older families without children 3.97 b
older singles 2.56 a
age of head of householdSustainability 2020, 12, 4702 10 of 17
correlation between formal education and household food waste mass cannot clearly be drawn from
this analysis.
3.3. Multiple Dependencies between Waste and Household Characteristics
Weighted linear regression models were created with the transformed data of food waste amounts
as dependent variable and f (Equation (1)) as weighting factor. First, the regression was carried out for
all independent variables separately before implementing all variables into one weighted multiple
linear regression model. The analysis aligns with the ANOVA by indicating that the considered
independent variables indeed show significant differences among characteristic values. Nonetheless,
the selected variables are not sufficient to predict the amount of household food waste as indicated by
the low adjusted r2 values below 0.1 (Table 2). The weighted simple linear regression with lifecycle
stage and household size as independent variables resulted in the highest adjusted r2 values of 0.086
and 0.088, respectively. The weighted multiple linear regression model resulted in an almost as low
adjusted r2 value of just above 0.09 indicating that the addition of more independent variables does not
lead to a markedly better fit of the regression model. It could be shown that the individual as well as
the combination of socio-demographic household characteristics predict less than 10% of the variance
of the dependent variable.
4. Discussion
4.1. Design and Realization of the Survey
The data set showed that 5% of the households did not record any food waste within 14 days,
although the households were asked to select a representative period. It must be asked whether it
is realistic that neither edible nor inedible food waste occurs in these households within 14 days.
Corresponding information from literature suggests that between 15% and 40% of respondents to
questionnaires stated not wasting any food or edible food within a regular week or during the previous
week [18–20]. In contrast, household food waste collection in Denmark led to the finding that only 3%
did not have any food waste in the bag [21]. In Spain, 20% of all households did not record any food
waste in diary surveys [20]. The Netherlands Nutrition Centre [22] compared food waste generation
self-assessments from Dutch households with waste sorting analyses and summarizes that “every
household throws things away.” The methodological procedure applied here should be better reflected
within scientific literature in order to gain more experience on “zero food waste” households.
Methodological questions arise with regard to the extent of underreporting of diary studies as
well as to whether all respondents conduct underreporting in the same way, and if specific food waste
fractions are more or less affected. For the present data set, GfK SE [16] estimates an underreporting
of 18% by comparing the reports with panel data on daily shopping behavior. They assume that
all food waste is underreported in the same way by all respondents. Findings from the literature
show that this might not be the case. According to Hoj [12], the unavoidable food waste fraction was
not statistically underreported by all respondents, while the avoidable and possibly avoidable food
waste fraction was underreported to a huge extent by households with multiple members. A smaller
extent of underreporting was detected by Giordano et al. [23] who report a lack of 23% for edible
food waste on average. Quested et al. [15] compared the diary methodology with waste collection
at the example of five studies in the UK, Saudi-Arabia, and the US and came to the conclusion that
the underreporting of diaries lies between 7% and 40%. The main reasons for the underreporting
of diary studies according to Quested et al. [15] are behavior change resulting from the reporting,
misreporting, measurement bias (if not all items are weighed) and self-selection bias. In the present
paper, the primary data set was not corrected, but for future use of such diaries more research needs to
be carried out on the level of under coverage for distinct product groups and different behavior of
respondent groups. The German baseline-2015-study by Schmidt et al. [5] derived household food
waste mainly from official waste statistics, the underlying data set of GfK SE to consider relevance ofSustainability 2020, 12, 4702 11 of 17
disposal paths and waste composition analyses of bins. The study suggests a food waste amount of 75
kg per person, which represents 1.7 times the mass of the diary study presented here and 1.3 times the
mass of the correction methodology using the panel data of daily shopping behavior described above.
Furthermore, other methodological questions arise, for instance concerning the impact of the
independent categorization of edible and inedible food waste by the participants themselves. However,
the perception of edibility of a product can vary between households (e.g., for peels of different
vegetables) which complicates a clear categorization of edible and inedible food products in advance.
Moreover, participants were allowed to weigh or estimate the mass of food waste in grams or liters
or indicate the number of pieces, leading to further uncertainties. Conversion tables were provided,
but it was not recorded which households weighed and which estimated the food waste mass.
This information could support assumptions on uncertainties of the reported data. Additionally, the
prior aggregation of the data by GfK SE, e.g., for household size and lifecycle groups complicated the
statistical analysis. For future surveys, a more detailed household characterization, such as the exact
number of household members, would be desirable.
4.2. Product Characteristics
Unsurprisingly, perishable products such as fruit, vegetables and bread are mainly discarded
which could be shown in previous studies [13,24]. In addition, the study was able to show that
cooked/prepared and loose/opened food products range among the main discarded food products. Our
findings indicate that beverages contribute to a major extent of domestic food waste and should not be
excluded from quantification methodology, as it is quite common in current literature on household
food waste; for example [9] or [18] or [20]. The relevance in terms of the environmental impact should
not be underestimated as liquid waste streams consist of coffee, tea, fruit juices, alcohol or soft drinks.
These may have a major impact during production related to the use of fertilizer, pesticides, water
demand, etc. Findings from Schmidt et al. [25] showed that the environmental impact of domestically
wasted beverages is considerable in Germany.
With respect to disposal paths, the results show that toilet or sewer represents the 3rd relevant
disposal option. The present findings are less than for Dutch households who dispose nearly 30% of
their total food waste (including e.g., yogurt, soup, dairy drinks, coffee, tea, soft drinks, fruit juices,
milk, wine, beer) into the toilet or sewer which ranks this disposal option in 2nd place [26]. With the
background of such findings, it seems to be critical that sewer/toilet disposal is excluded in current EU
legislation [6]. Moreover, the alternative disposal ways of home composting and feeding to animals
should not be neglected. Although the waste compositional analysis can be referred to as the more
accurate methodology, it is a drawback that the disposal ways sewer, home composting, and animal
feed cannot easily be captured by it [15,27].
The residual waste bin is used almost as often as the bio waste bin, which underlines the importance
of taking into account both of these disposal options for any household food waste survey. The fact
that separate bio-waste collection is not available everywhere should also be taken into account when
comparing (inter)national food waste amounts.
4.3. Disposal Reasons
The respondents chose durability or spoilage as the main reason for edible food wastage within
their homes, which corresponds well with other literature; for example [9] or [13] or [28]. This result
should be interpreted rather as perceived reason than as actual reason for disposal, as spoilage arises
due to poor planning or wrong storage in the first place rather than due to poor quality of food produce.
The relevance of the quantity-related problems at home is quite similar to other studies [9,13,19].
Quantity-related problems at purchase play a greater role for smaller households within the present
study. Here, the offer of smaller packaging units, re-sealable packaging, or piece-by-piece withdrawal for
small households could contribute to prevention, especially for canned food and convenience products.Sustainability 2020, 12, 4702 12 of 17
In contrast to other studies [9,18,19,28], the best-before date, with less than 6% of all wasted items,
was not highly ranked as reason for disposal. This finding aligns with Schmidt et al. [25] who found
that 88% of their participants in Germany check the edibility of the particular product after expiry
of the best before date. Only 7% of the participants usually discard all products after expiry of the
best-before date. Moreover, the present respondents presume not to waste a high share of food due to
too large packages being cheaper or on offer, which is supported by other authors as well [3,9,19].
4.4. Socio-Demographic Characteristics
The inedible fraction was included in the analysis of socio-demographic characteristics due to
the legal requirements within the European Union to report the total food waste masses from 2020
onwards. It represents a different approach to most of the already available literature which is often
dedicated to edible domestic food waste only. The findings on the dependency of generated domestic
food waste on age and lifecycle stage of participants differ within the literature. Koivupuro et al. [9]
could not find any significant connection between food waste level and age. However, most studies
found that older households waste less than younger households [18,20,29–32]. In contrast to these
studies, the present results indicate that older age groups and lifecycle stages account for a relatively
high share of food waste. The reason is that the inedible fraction of food waste is much higher for older
households than for other age groups (Figure S2) which raises specific implications for the monitoring.
First, it makes a noticeable difference if one targets edible or inedible domestic food waste. Therefore,
both fractions should be reported separately with clear indication on what is covered. Second, the
shares of edible and inedible food waste vary between household types, making a more specific
addressing of prevention measures necessary. At present, the European legislation asks for separate
reporting of edible and inedible fraction on voluntary basis only.
Many studies suggest that food waste amounts are lower in smaller households than in
larger households and that the amount of waste per person decreases with increasing household
size [9,13,28,29,31,33]. This result was also found within our data set.
Families with children within this study waste significantly more which is in line with findings of
other household surveys [28,32]. Parizeau et al. [28] offer the explanation of time and money constraints
with children in the household while Neff et al. [34] suggest that eating behavior of children is not
always predictable resulting in too much food served on the plate. Since too much food served on the
plate was not a major disposal reason in our study, this explanation seems unsuitable in this context.
Taking into account the assumed underreporting of a diary study, the impact of household composition
on the recorded food waste should be considered as well. According to Hoj [12], households with
children and multiple adults provided substantial underreporting in diaries by 40% of the total food
waste (wasted into municipal waste collection), whereas single occupancy households recorded the
same amount of food waste as parallel conducted compositional analyses found for them. This puts
the comparably high per capita mass of food waste of small households somewhat into perspective.
The present findings concerning food waste in rural and urban areas seem to be contrary to other
studies. Neff et al. [34], who conducted an online survey which did not actually aim at food waste
quantification, found few differences in reported food waste amounts between rural and urban status.
Koivupuro et al. [9] did not find a significant correlation for avoidable food waste to all disposal
paths. Secondi et al. [30], who statistically analyzed survey data of telephone interviews within the EU,
found that households living in towns indicate they produce more food waste than those living in rural
areas. This is supported by Schneider and Obersteiner [35] as well as Lebersorger and Schneider [27],
who conducted waste sorting analysis covering residual waste only. These apparent differences may
be grounded in the coverage of disposal options surveyed. All disposal paths were covered in the
present study, whereas the latter two mentioned studies included residual waste only. This means
that according to the present results, nearly two thirds of the food waste was not covered within these
studies. The findings of Neff et al. [34] and Secondi et al. [30] rely on questionnaire and telephone
surveys which do not represent an adequate method to draw exact figures on food waste quantitiesSustainability 2020, 12, 4702 13 of 17
from. The comparison of the different coverage of disposal paths and domestic food waste generation
may suggest that in rural areas, non-residual waste disposal paths such as separate collection of bio
waste (municipal collection or home composting) or animal feeding are more relevant than in urban
areas. This issue should get more attention by future research.
Similar to our study, Cecere et al. [36] cannot draw clear findings on the correlation between
education and household food waste. Also Neff et al. [34] found few differences in reported food waste
amounts between differently educated groups. Visschers et al. [32], who analyzed a much smaller sample
of less than 900 households, did not find a correlation either. Similarly, in Finland, Koivupuro et al. [9]
did not find any significant correlation between food waste amount and educational level of the
householders who filled in the diary. Only Secondi et al. [30] found that less educated individuals state
to waste less than more educated ones. As mentioned above, the study by Secondi et al. [30] relies on
own estimations of food waste amounts by use of questionnaires and hence on a completely different
methodology compared to the one of the underlying study.
4.5. Prediction of Food Waste Amounts through Socio-Demographic Variables
In the present study the tested independent variables of the regression only explain a very small
share of food waste emergence. Similar results were found by Giordano et al. [13], as the included
socio-demographic characteristics within their study as for instance household size and food related
habits such as shopping and eating behavior, could only explain about 30% of the variation in food
waste quantities within the regression random forest. In a similar way, Grasso et al. [20] stated that
their findings “underscore the modest role of socio-demographic characteristics in predicting food
waste behavior in Europe”.
De Hooge et al. [37] showed that besides demographics, waste behavior is influenced by personality
characteristics, such as value orientation, commitment to environmental sustainability, and perceived
consumer effectiveness in saving the environment and by individual waste aspects, such as perceived
food waste of the household, perceived importance of food waste and engaging in shopping and
cooking. Visschers et al. [32] performed a Tobit analysis on self-reported household food waste and
also found that personal attitudes and norms such as perceived behavioral control and good provider
identity are important influencing factors. Parizeau et al. [28] observed that food and waste awareness
in general as well as family and convenience lifestyles are connected with food waste behavior.
Food waste is a multi-dimensional problem which is influenced by purchasing behavior, general
waste prevention habits, as well as the importance of materialistic and environmental values [38]. Stancu
et al. [31] strengthen this view on food waste generation by showing that psychological factors and
household-related routines perform better in explaining food waste behavior than socio-demographic
factors. Therefore, food waste can be described as an unintended result of several practices in a broader
context of values and factors and should, with regard to domestic food waste reduction, also be
addressed as such a multi-faceted issue [39].
5. Conclusions
The study presents for the first time findings on household food waste behavior and characteristics
in Germany in a representative way and grounded on a quantitative statistical analysis. It is able to show
that levels of household food waste indeed differ between distinct socio-demographic factors which has
not become clear in previous studies with smaller sample sizes. Nonetheless, the socio-demographic
factors considered in the analysis explain only a small share of households' variance in food waste
levels, which must substantially be affected by parameters not taken into account in the frame of this
study. Food waste not only depends on selected socio-demographic characteristics of households
but also on many other conditions that relate to behavior, routines, lifestyles, attitudes, and norms.
This implies that policies targeting certain population groups such as single, young, or households with
children might be limited in their effectiveness. As the comparison with other research on household
food waste showed, a focus on overall consumer behavior, waste prevention habits, daily routines andSustainability 2020, 12, 4702 14 of 17
environmental values could be more accurate. More quantitative research on potential influencing
factors of household food waste should be carried out as a scientific basis for targeted prevention
policies. The results on disposal reasons indicate that food waste prevention measures should not
solely rely on information provision regarding the best-before date and perishability but rather focus
on adequate packaging sizes for smaller households, especially of canned foods and convenience
products, and better meal planning options for larger households and households with children as
well as re-use ideas for surpluses.
Regarding the monitoring of household food waste, further issues need to be taken into account.
The disposal path sewer/toilet should not be neglected as it represents a major disposal path, particularly
for beverages. The present dataset show a survey methodology for households that integrates this
component in a consistent way. Further, the disposal options composting and animal feed and the
different use of these paths between regions must also be taken into consideration.
With regard to the recent EU requirements for food waste monitoring, the problem of distinct
shares of inedible fractions between households must be discussed in further detail. Differences in the
share of edible and inedible food waste among age groups may result in distortions if indication on the
potential edibility of the food product is not provided during reporting.
From a methodological viewpoint, it is challenging to compare existing studies and make
clear assumptions on food waste masses, behavior, and the influence of socio-demographic factors.
The existing studies apply different methodologies and rely partly on households' own perceptions
and estimations of food waste levels. Moreover, the studies differ in their inclusion of distinct
disposal routes, liquid products, and inedible food waste. Future research should focus more on
adequate methods to quantify domestic food waste and to better estimate potential underreporting
and negligence of certain food waste fractions. Particularly methodologies for measuring wasted
beverages and the disposal path sink should be discussed. Research on household food waste quantities
should moreover clearly unveil and reflect on the advantages and disadvantages of their applied
methodologies to facilitate a comparison between studies. Furthermore, the phenomenon of “no food
waste at all“-reporting should be investigated with respect to methodological interpretation, impact
on results, and proceedings for other households. Recent literature already states the disadvantages
of diary studies for quantifying household food waste [5,13,15]. Nonetheless, our study could show
that particular information on all relevant disposal paths can easily be captured by use of food waste
diaries. Thus, a combination with other methodologies should be applied for a proper assessment.
Finally, time series should be established to capture potential trends in the development of food waste,
which are as yet unclear for households in Germany.
Supplementary Materials: The following are available online at http://www.mdpi.com/2071-1050/12/11/4702/s1,
Figure S1: Histogram (left) and QQ-Plot (right) showing the normal distribution of transformed data on food
waste masses by use of Box-Cox transformation, Figure S2: Total amount of edible and inedible food waste by age
group of head of household per household and year [kg], Figure S3: Total amount of household (hh) edible food
waste only (in contrast to Figure 5 addressing total food waste) within 14 days per (a) household lifecycle stage, (b)
age of the head of the household, (c) household size, (d) size category of municipality, and (e) level of education (n
indicates sample sizes; outliers are excluded), Table S1: Criteria for calculation of the weighting factor (f) for each
household by GfK SE, Table S2: Underlying data of descriptive statistics concerning edibility, food product types,
condition of disposal and disposal routes in percentages and absolute annual numbers (absolute numbers are
extrapolated to the whole population of Germany), Table S3: Underlying data of descriptive statistics concerning
disposal reasons by product group, household size group, and lifecycle group in percentages and absolute annual
numbers (absolute numbers are extrapolated to the whole population of Germany).
Author Contributions: Conceptualization, R.H. and T.G.S.; methodology, R.H.; validation, T.G.S. and F.S.; formal
analysis, R.H.; resources, T.G.S. and F.S.; data curation, T.G.S. and F.S.; writing—original draft preparation, R.H.
and F.S.; writing—review and editing, all; visualization, R.H. All authors have read and agreed to the published
version of the manuscript.
Funding: This research received no external funding.
Acknowledgments: The authors would like to thank GfK SE for the provision of further details on the data
acquisition. The authors would also like to thank Anne Margarian for statistical support and proof reading,
Sebastian Neuenfeldt for statistical support and Manuela Schoon for proof reading.Sustainability 2020, 12, 4702 15 of 17
Conflicts of Interest: The authors declare no conflicts of interest.
Appendix A. Specifications of Surveyed Socio-Demographic Characteristics
Table A1. Characteristic values of observed socio-demographic characteristics.
Socio-Demographic Characteristic Characteristic Values Group Number
younger singles/young families and couples without children 1
younger families with small and school children 2
lifecycle stages families with adolescent children/older families with children 3
medium aged and older families without children 4
older singles 5Sustainability 2020, 12, 4702 16 of 17
9. Koivupuro, H.K.; Hartikainen, H.; Silvennoinen, K.; Katajajuuri, J.M.; Heikintalo, N.; Reinikainen, A.;
Jalkanen, L. Influence of socio-demographical, behavioural and attitudinal factors on the amount of avoidable
food waste generated in Finnish households. Int. J. Consum. Stud. 2012, 36, 183–191. [CrossRef]
10. Wenlock, R.W.; Buss, D.H.; Derry, B.J.; Dixon, E.J. Household Food Wastage in Britain. Br. J. Nutr. 1980, 43,
53–70. [CrossRef] [PubMed]
11. Langley, J.; Yoxall, A.; Heppell, G.; Rodriguez, E.M.; Bradbury, S.; Lewis, R.; Luxmoore, J.; Hodzic, A.;
Rowson, J. Food for thought?—A UK pilot study testing a methodology for compositional domestic food
waste analysis. Waste Manag. Res. 2010, 28, 220–227. [CrossRef]
12. Hoj, S.B. Metrics and Measurement Methods for the Monitoring and Evaluation of Household Food Waste
Prevention Interventions. Master’s Thesis, University of South Australia, Adelaide, Australia, 2012.
13. Giordano, C.; Alboni, F.; Falasconi, L. Quantities, Determinants, and Awareness of Households’ Food
Waste in Italy: A Comparison between Diary and Questionnaires Quantities. Sustainability 2019, 11, 3381.
[CrossRef]
14. Leverenz, D.; Moussawel, S.; Maurer, C.; Hafner, G.; Schneider, F.; Schmidt, T.; Kranert, M. Quantifying
the prevention potential of avoidable food waste in households using a self-reporting approach.
Resour. Conserv. Recycl. 2019, 150, 104417. [CrossRef]
15. Quested, T.E.; Palmer, G.; Moreno, L.C.; McDermott, C.; Schumacher, K. Comparing diaries and waste
compositional analysis for measuring food waste in the home. J. Clean. Prod. 2020, 121263. [CrossRef]
16. GfK SE. Systematische Erfassung von Lebensmittelabfällen der Privaten Haushalte in Deutschland. Schlussbericht
zur Studie; GfK SE: Nürnberg, Germany, 2017.
17. Statista. Available online: https://de.statista.com/statistik/kategorien/kategorie/8/themen/63/branche/
demographie/ (accessed on 11 May 2020).
18. Jörissen, J.; Priefer, C.; Bräutigam, K.R. Food Waste Generation at Household Level: Results of a Survey
among Employees of Two European Research Centers in Italy and Germany. Sustainability 2015, 7, 2695–2715.
[CrossRef]
19. Falasconi, L.; Cicatiello, C.; Franco, S.; Segrè, A.; Setti, M.; Vittuari, M. Such a Shame! A Study on
Self-Perception of Household Food Waste. Sustainability 2019, 11, 270. [CrossRef]
20. Grasso, A.C.; Olthof, M.R.; Boevé, A.J.; van Dooren, C.; Lähteenmäki, L.; Brouwer, I.A. Socio-Demographic
Predictors of Food Waste Behavior in Denmark and Spain. Sustainability 2019, 11, 3244. [CrossRef]
21. Edjabou, M.E.; Petersen, C.; Scheutz, C.; Astrup, T.F. Food waste from Danish households: Generation and
composition. Waste Manag. 2016, 52, 256–268. [CrossRef]
22. The Netherlands Nutrition Centre (Voedingscentrum). Supplementary Memorandum: Food Waste in Dutch
Households in 2016; The Netherlands Nutrition Centre Foundation (Stichting Voedingscentrum Nederland):
The Hague, The Netherlands, 2017.
23. Giordano, C.; Piras, S.; Boschini, M.; Falasconi, L. Are questionnaires a reliable method to measure food
waste? A pilot study on Italian households. Br. Food J. 2018, 120, 2885–2897. [CrossRef]
24. Gaiani, S.; Caldeira, S.; Adorno, V.; Segrè, A.; Vittuari, M. Food wasters: Profiling consumers’ attitude to
waste food in Italy. Waste Manag. 2018, 72, 17–24. [CrossRef] [PubMed]
25. Schmidt, T.; Baumgardt, S.; Blumenthal, A.; Burdick, B.; Claupein, E.; Dirksmeyer, W.; Hafner, G.;
Klockgether, K.; Koch, F.; Leverenz, D.; et al. Wege zur Reduzierung von Lebensmittelabfällen—Pathways
to Reduce Food Waste (REFOWAS): Maßnahmen, Bewertungsrahmen und Analysewerkzeuge Sowie Zukunftsfähige
Ansätze für Einen Nachhaltigen Umgang Mit Lebensmitteln Unter Einbindung Sozio-Ökologischer Innovationen;
Johann Heinrich von Thünen-Institut: Braunschweig, Germany, 2019. [CrossRef]
26. van Dooren, C.; Janmaat, O.; Snoek, J.; Schrijnen, M. Measuring food waste in Dutch households: A synthesis
of three studies. Waste Manag. 2019, 94, 153–164. [CrossRef]
27. Lebersorger, S.; Schneider, F. Discussion on the methodology for determining food waste in household waste
composition studies. Waste Manag. 2011, 31, 1924–1933. [CrossRef] [PubMed]
28. Parizeau, K.; von Massow, M.; Martin, R. Household-level dynamics of food waste production and related
beliefs, attitudes, and behaviours in Guelph, Ontario. Waste Manag. 2015, 35, 207–217. [CrossRef] [PubMed]
29. WRAP. The Food We Waste; WRAP: Bunbury, UK, 2008; ISBN 1-84405-383-0.
30. Secondi, L.; Principato, L.; Laureti, T. Household food waste behaviour in EU-27 countries: A multilevel
analysis. Food Policy 2015, 56, 25–40. [CrossRef]Sustainability 2020, 12, 4702 17 of 17
31. Stancu, V.; Haugaard, P.; Lähteenmäki, L. Determinants of consumer food waste behaviour: Two routes to
food waste. Appetite 2016, 96, 7–17. [CrossRef]
32. Visschers, V.H.M.; Wickli, N.; Siegrist, M. Sorting out food waste behaviour: A survey on the motivators and
barriers of self-reported amounts of food waste in households. J. Environ. Psychol. 2016, 45, 66–78. [CrossRef]
33. Tucker, C.A.; Farrelly, T. Household food waste: The implications of consumer choice in food from purchase
to disposal. Local Environ. 2016, 21, 682–706. [CrossRef]
34. Neff, R.A.; Spiker, M.L.; Truant, P.L. Wasted Food: U.S. Consumers’ Reported Awareness, Attitudes,
and Behaviors. PLoS ONE 2015, 10, e0127881. [CrossRef] [PubMed]
35. Schneider, F.; Obersteiner, G. Food waste in residual waste of households—Regional and socio-economic
differences. In Proceedings of the Eleventh International Waste Management and Landfill Symposium,
Margherita di Pula, Cagliari, Sardinia, Italy, 1–5 October 2007.
36. Cecere, G.; Mancinelli, S.; Mazzanti, M. Waste prevention and social preferences: The role of intrinsic and
extrinsic motivations. Ecol. Econ. 2014, 107, 163–176. [CrossRef]
37. De Hooge, I.E.; Oostindjer, M.; Aschemann-Witzel, J.; Normann, A.; Mueller Loose, S.; Lengard Almli, V.
This apple is too ugly for me! Food Qual. Prefer. 2017, 56, 80–92. [CrossRef]
38. Diaz-Ruiz, R.; Costa-Font, M.; Gil, J.M. Moving ahead from food-related behaviours: An alternative approach
to understand household food waste generation. J. Clean. Prod. 2018, 172, 1140–1151. [CrossRef]
39. Ganglbauer, E.; Fitzpatrick, G.; Comber, R. Negotiating food waste. ACM Trans. Comput. Hum. Interact. 2013,
20, 1–25. [CrossRef]
© 2020 by the authors. Licensee MDPI, Basel, Switzerland. This article is an open access
article distributed under the terms and conditions of the Creative Commons Attribution
(CC BY) license (http://creativecommons.org/licenses/by/4.0/).You can also read