Characterization of collagen fibers by means of texture analysis of second harmonic generation images using orientation-dependent gray level co...
←
→
Page content transcription
If your browser does not render page correctly, please read the page content below
Characterization of collagen fibers by
                 means of texture analysis of second
                 harmonic generation images using
                 orientation-dependent gray level co-
                 occurrence matrix method

                 Wenyan Hu
                 Hui Li
                 Chunyou Wang
                 Shanmiao Gou
                 Ling Fu

Downloaded From: https://www.spiedigitallibrary.org/journals/Journal-of-Biomedical-Optics on 03 Feb 2021
Terms of Use: https://www.spiedigitallibrary.org/terms-of-use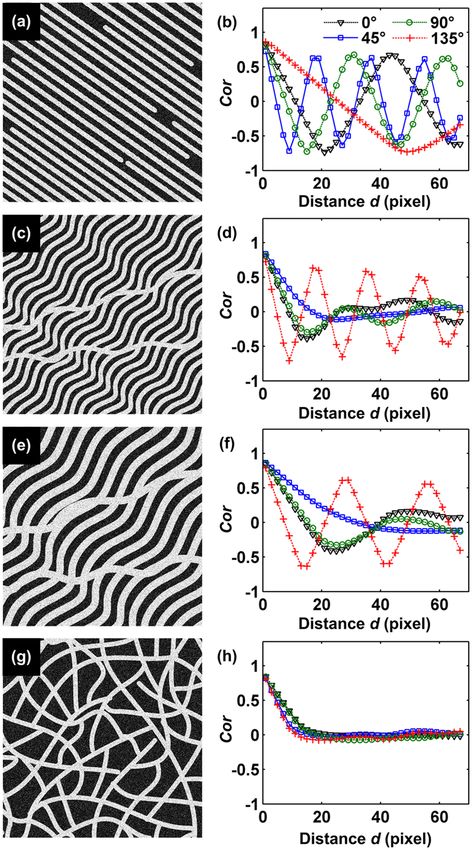
Journal of Biomedical Optics 17(2), 026007 (February 2012)

                Characterization of collagen fibers by means of texture
                analysis of second harmonic generation images using
                orientation-dependent gray level co-occurrence
                matrix method
                Wenyan Hu,a,b,* Hui Li,a,b,* Chunyou Wang,c Shanmiao Gou,c and Ling Fua,b
                a
                  Wuhan National Laboratory for Optoelectronics-Huazhong University of Science and Technology, Britton Chance Center for Biomedical Photonics,
                Wuhan 430074, China
                b
                  Huazhong University of Science and Technology, Key Laboratory of Biomedical Photonics of Ministry of Education, Wuhan 430074, China
                c
                  Huazhong University of Science and Technology, Pancreatic Surgery Center in Union Hospital, Wuhan 430074, China

                              Abstract. Collagen is the most prominent protein in the human body, making up 30% of the total protein content.
                              Quantitative studies have shown structural differences between collagen fibers of the normal and diseased tissues,
                              due to the remodeling of the extracellular matrix during the pathological process. The dominant orientation, which
                              is an important characteristic of collagen fibers, has not been taken into consideration for quantitative collagen
                              analysis. Based on the conventional gray level co-occurrence matrix (GLCM) method, the authors proposed
                              the orientation-dependent GLCM (OD-GLCM) method by estimating the dominant orientation of collagen fibers.
                              The authors validated the utility of the OD-GLCM method on second harmonic generation (SHG) microscopic
                              images of tendons from rats with different ages. Compared with conventional GLCM method, the authors’ method
                              has not only improved the discrimination between different tissues but also provided additional texture information
                              of the orderliness of collagen fibers and the fiber size. The OD-GLCM method was further applied to the differ-
                              entiation of the preliminary SHG images of normal and cancerous human pancreatic tissues. The combination of
                              SHG microscopy and the OD-GLCM method might be helpful for the evaluation of diseases marked with abnormal
                              collagen morphology. © 2012 Society of Photo-Optical Instrumentation Engineers (SPIE). [DOI: 10.1117/1.JBO.17.2.026007]
                              Keywords: collagen fibers; dominant orientation; gray level co-occurrence matrix; orientation-dependent gray level co-occurrence
                              matrix; second harmonic generation microscopy; texture analysis.
                              Paper 11446 received Aug. 17, 2011; revised manuscript received Nov. 24, 2011; accepted for publication Dec. 14, 2011; published
                              online Feb. 23, 2012.

                1     Introduction                                                                 immunosorbent assays (ELISA), scanning and transmission
                As the chief structural protein of all vertebrates, collagen                       electron microscopy, and polarization microscopy. Over the last
                accounts for approximately 30% of body protein. More than                          decade, second harmonic generation (SHG) microscopy
                90% of the extracellular protein in the tendon and bone and                        emerged as an in vivo imaging modality to provide high-
                more than 50% in the skin consist of collagen.1 The character-                     resolution three-dimensional images of collagen fibers in
                istics of collagen reveal important information with regards to                    thick specimens without the need for sample staining and
                the health status.2–4 Many studies have shown that the collagen                    processing.1–3,11–17 Moreover, collagen has a highly crystalline
                fibers are irregularly disordered without well-defined orientation                 triple-helix structure,18 which is a chiral molecule. The
                in pathological samples, while the morphology of the collagen                      non-centrosymmetrical structure of fibrillar collagen makes it
                fibers is highly structured in normal samples.4–9 For instance, the                the major source of the SHG signals in biological
                biopsies from patients with epithelial ovarian cancer exhibited a                  materials.8,10,11,14,18,19 Recently, SHG imaging has been com-
                loss of fine structure and structural organization with wavy, col-                 monly applied in studies of diseases marked with collagen,
                lagen bands, whereas the normal biopsies exhibited normotypic                      such as melanomas,16 epithelial ovarian cancer,4 osteogenesis
                structured collagen fibrils near the epithelial surface.4 Therefore,               imperfecta9 and so on.
                detailed characterization of the collagen morphology is impor-                         In order to advance the accuracy and efficiency of future
                tant because structural modifications of the fibrillar matrix are                  clinical diagnosis, the morphology of collagen fibers revealed
                associated with various physiologic processes such as aging,                       by SHG imaging have been quantitatively described by texture
                diabetes, wound healing, and cancer.10                                             analysis. Texture analysis approaches can be categorized into
                    Conventional approaches to characterize collagen include                       statistical, structural, model-based, and transform-based meth-
                standard tissue staining, in situ hybridization, enzyme linked                     ods.20,21 For medical applications, the statistical methods are
                                                                                                   extensively used, since they can achieve higher discrimination
                  *These authors contributed equally to this work. Their e-mails are wyuan-
                                                                                                   indexes.21 As the most frequently cited statistical method,20–22
                hu@gmail.com and huldali@126.com, respectively.                                    the gray level co-occurrence matrix (GLCM) has been applied
                Address all correspondence to: Ling Fu, Wuhan National Laboratory for Optoe-
                                                                                                   to a variety of fields for decades, including texture analysis of
                lectronics-Huazhong University of Science and Technology, Britton Chance
                Center for Biomedical Photonics, Wuhan 430074, China. Tel: (86) 27-
                87792033; Fax: (86) 27- 87792034; E-mail: lfu@mail.hust.edu.cn                     0091-3286/2012/$25.00 © 2012 SPIE

                Journal of Biomedical Optics                                              026007-1                                        February 2012   •   Vol. 17(2)

Downloaded From: https://www.spiedigitallibrary.org/journals/Journal-of-Biomedical-Optics on 03 Feb 2021
Terms of Use: https://www.spiedigitallibrary.org/terms-of-use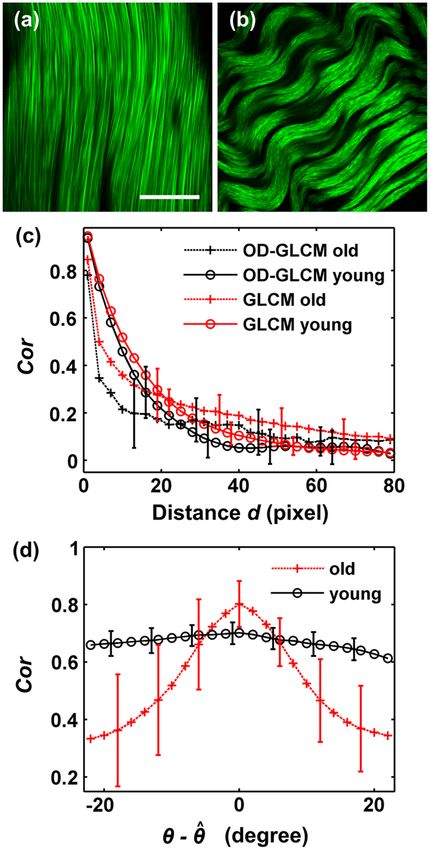
Hu et al.: Characterization of collagen fibers by means of texture analysis : : :
remote sensing images,13,23–25 surface roughness analysis,26 the
extraction of significant patterns from industrial flotation
froths,27 and quantitative analysis of medical images.21,28–34
Combined with SHG imaging, the GLCM approach has been
used to quantitatively analyze the collagen fibers.4,35 But it simply
classifies different biological tissues by the feature values without
providing any information directly associated with the geometri-
cal arrangement of collagen fibrillar bundles. Generally, GLCM
features along one or two of the four specific directions of 0 deg,
45 deg, 90 deg, and 135 deg or average feature values along these
four directions are extracted to quantitatively analyze the SHG
images.4,29,31,32,36 However, the dominant orientation of the col-
lagen fibers is usually ignored in the conventional GLCM analy-
sis. Since the orientation is an important characteristic of collagen
fibers with a filamentous structure, the GLCM features calculated
along the dominant orientation of collagen fibers are different
from those calculated along the other directions. As a result,
the texture information obtained from the feature curves is depen-
dent on the direction selected in GLCM analysis. By combining
the dominant orientation of collagen fibers into the GLCM ana-
lysis, the GLCM feature curves calculated may provide more
information for detailed morphological characterization of the
collagen fibers, thus leading to further sights into various physio-
logical and pathological processes, such as the structural modi-
fication of the extracellular matrix during the migration and
invasion of tumor cells.
In order to take into account the dominant orientation of col-
lagen fibers and extract more comprehensive morphological
information, we proposed the orientation-dependent GLCM
(OD-GLCM) method based on the dominant orientation of col-
lagen fibers. The OD-GLCM method was compared with the
conventional GLCM method by quantitative analysis of SHG
images of rat tendons. It was further applied to the differentia-
tion of SHG images from normal and cancerous human pancrea-
tic tissues at different stages.
2 Materials and Methods
2.1 Preparation of the Artificial Images
and the Biological Samples
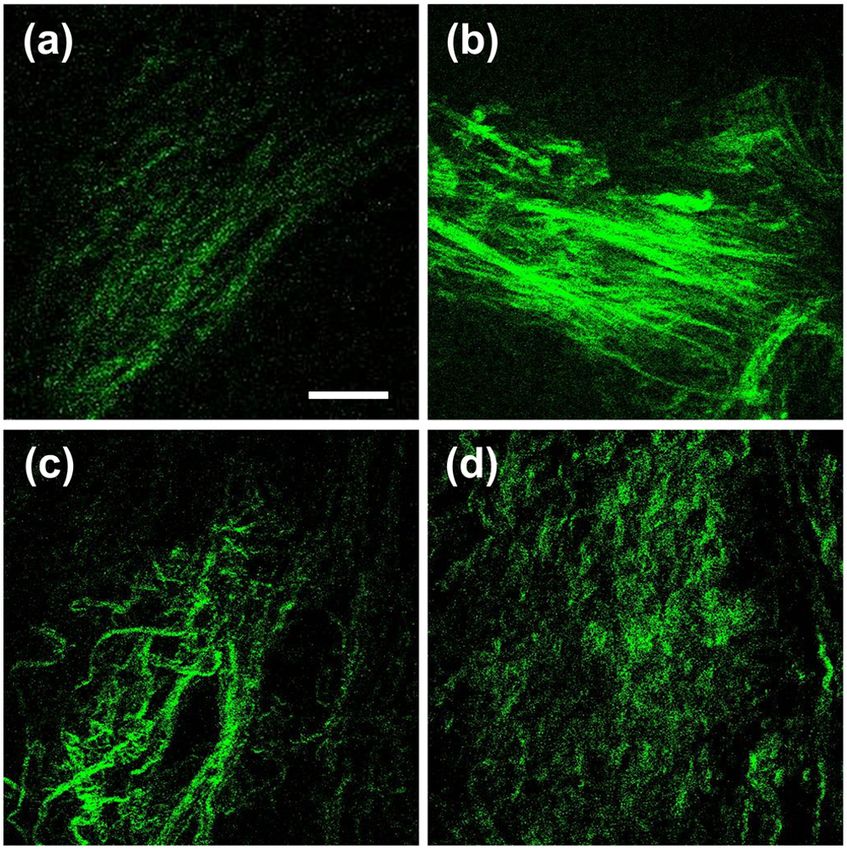
Fig. 1 GLCM analysis was performed for [(a), (c), (e) and (g)] the model
To validate the dependence of GLCM analysis of collagen fibers images consisting of strips arranged in regular and random structure.
on the direction selected, we have created model images, which The second column shows [(b), (d), (f) and (h)] Cor curves as a function
of d in the directions of 0 deg, 45 deg, 90 deg, and 135 deg correspond-
consist of strips with regular and random structure [Figs. 1(a),
ing to the images in the first column. Note: GLCM ¼ gray level co-
1(c), 1(e), and 1(g)] similar to the most representative patterns of occurrence matrix.
collagen fibers.4,37–39 The white strips were manually created by
Visio (Microsoft) and converted to gray-level synthetic images
with 512 × 512 pixels by adding Gaussian white noise of mean differentiated, one poor differentiated, as well as one liver
0 and variance 0.1 to the black and white images using metastasized pancreatic cancer tissues, were collected during
MATLAB (The MathWorks) function “imnoise.” The width a surgical resection from pancreatic cancer patients, respec-
of the strips are manually set to be 13 pixels [Figs. 1(a), tively. All the patients who participated in the study were pro-
1(c), and 1(g)] and 20 pixels [Fig. 1(e)] for different model vided written informed consent and ethical approval for the
images, respectively. Besides, the strips in the relatively regular study was obtained from the institutional review board. The spe-
images [Figs. 1(a), 1(c), and 1(e)] were set to be aligned along cimens were immersed in phosphate buffered saline and kept in
the direction of 145 deg, 50 deg, and 50 deg, respectively. ice before multiphoton microscopic imaging. They were imaged
The ex vivo rat tendons, which can be divided into the old in the same way as the rat tendons within 3 h.
(n ¼ 6) and young (n ¼ 6) groups, were sandwiched between
the microscope slide and cover glass in phosphate buffered 2.2 SHG Microscope System
saline and imaged within 1 h after dissection. The old group
included three seven-week-old rats, two 10-week-old rats, For SHG imaging, a Ti:Sapphire laser (Spectra-Physics, Mai
and one eight-month-old rat, and the young group included Tai) with a repetition rate of 80 MHz was used as the excitation
six 10-day-old rats. Seven human pancreatic specimens, includ- source. The 750-nm output of the laser system was delivered to a
ing one normal pancreatic tissue beside the tumor, and four well modified commercial microscope (Fluoview 1000, Olympus)
Journal of Biomedical Optics 026007-2 February 2012 • Vol. 17(2)
Downloaded From: https://www.spiedigitallibrary.org/journals/Journal-of-Biomedical-Optics on 03 Feb 2021
Terms of Use: https://www.spiedigitallibrary.org/terms-of-use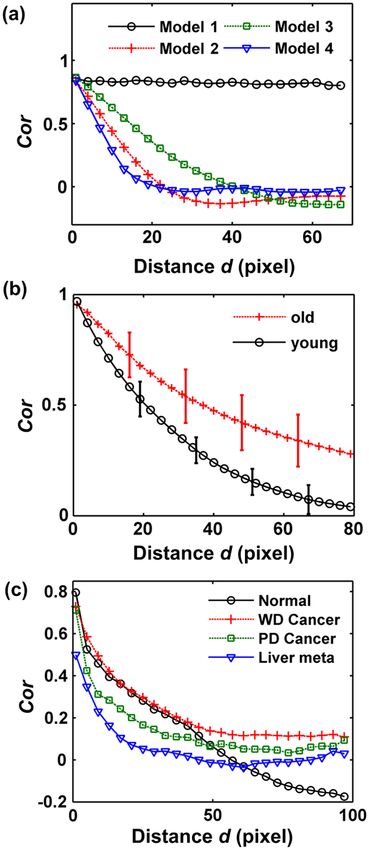
Hu et al.: Characterization of collagen fibers by means of texture analysis : : :

                and focused onto the sample through an objective (60 × ∕1.2                             directions [Figs. 1(b), 1(d), and 1(f)]. It suggests that the
                NA water-immersion, Olympus). The backscattered SHG signal                              GLCM analysis for collagen fibers is dependent on the direction
                was collected by the same objective and filtered by a band-pass                         selected to calculate the GLCM features. In order to take the
                filter (330 to 385 nm) before the detection of the photomultiplier                      dominant orientation of collagen fibers into consideration, we
                tube. The scanning rate is 4 to 10 μs∕pixel and the average exci-                       proposed the OD-GLCM method to get more comprehensive
                tation power on the surface of the sample is about 8 to 15 mW.                          information for quantitative morphological analysis of collagen
                The SHG signal was confirmed by the property of wavelength                              fibers.
                dependence, since there was no signal detected in the 330 to
                385 nm range at longer excitation wavelength such as                                      θ ¼ arg max CorðθÞ;                       X ¼ ð0; 45; 90; 135 degÞ. (6)
                                                                                                                    θ∈X
                780 nm, while the fluorescence signal from the fibers could
                still be detected in the 515 to 560 nm range.

                2.3     Image Pre-Processing                                                            2.5    Dominant Orientation of Collagen Fibers
                The SHG images were pre-processed using the MATLAB (The                                 To estimate the dominant orientation of collagen fibers, the direc-
                MathWorks) function “imadjust” for gray level adjustment to                             tion in GLCM calculation was divided into four parts, including
                increase the contrast of the image, so that the intensities of                          (0 deg 22 deg), (45 deg 22 deg), [90 deg 22 deg),
                the SHG signal acquired for different samples are comparable.                           (135 deg 22 deg). We calculated the Cor along all the direc-
                Particularly, in order to improve the signal-to-noise ratio of SHG                      tions θ in the range of θ − 22 deg to θ þ 22 deg [Fig. 2(a)] by
                imaging from pancreatic samples, up to four consecutive optical                         rotating the image by θ clockwise and then cropping the image to
                slices were averaged, and the adaptive threshold algorithm with                         square dimension using MATLAB (The MathWorks). It was
                a kernel size of 51 × 51 pixels3 was used before the gray level                         found that the largest value corresponds to the dominant orienta-
                adjustment, since the estimated fiber size can be affected by the                       tion of collagen fibers, which θ^ is defined as in Eq. (7).
                noise level without pre-processing.
                                                                                                                   θ^ ¼ arg max CorðθÞ;
                2.4     Dependence of GLCM Analysis                                                                            θ∈X                                                                (7)
                        on the Direction Selected                                                                  X ¼ ðxjθ − 22 deg ≤ x ≤ θ þ 22 degÞ
                For an image with g gray levels, the GLCM is an estimate of the
                second-order joint probability pði; jjd; g; θÞ of any two pixels
                with gray level i and j (0 ≤ i < g, 0 ≤ j < g), which apart                             2.6    Estimation of the Orderliness of Collagen Fibers
                from each other with d pixel distance along direction θ.20,36                                  and the Fiber Size
                In this paper, the most commonly used GLCM feature calcu-
                lated from pði; jjd; g; θÞ named correlation (Cor) is discussed.                        As can be seen from the Cor curves as a function of θ for model
                The equation of Cor is given as below:36,40                                             images [Fig. 2(b)], the curve of the highly regular image
                                                                                                        shows an obvious peak at the dominant texture orientation
                                           X ði − μi Þðj − μj Þpði; jÞ                                  while the curve of the random image is flat. Therefore, the stan-
                                 Cor ¼                                              ;        (1)
                                            i;j
                                                                σiσj                                    dard deviation of Cor along all the directions in the range from
                                                                                                        θ − 22 deg to θ þ 22 deg can be used to describe the
                where                                                                                   orderliness of the texture, which is defined as σ Cor in Eq. (8).
                                                    X                                                                       vffiffiffiffiffiffiffiffiffiffiffiffiffiffiffiffiffiffiffiffiffiffiffiffiffiffiffiffiffiffiffiffiffiffiffiffiffiffiffiffiffiffiffiffiffiffiffiffiffiffiffiffiffiffiffiffiffiffi
                                           μi ¼             i ⋅ pði; jÞ;                     (2)                            u
                                                                                                                            u 1 θþ22 X°
                                                      i;j                                                          σ Cor   ¼t                     ½CorðθÞ − CorðθÞ         ¯       2
                                                                                                                                                                                        ;
                                                                                                                              44
                                                                                                                                         θ¼θ−22°
                                                    X                                                                                                                                             (8)
                                           μj ¼             j ⋅ pði; jÞ;                     (3)                                   1                    X°
                                                                                                                                                       θþ22
                                                      i;j                                                                  ¯
                                                                                                                   where CorðθÞ ¼                                  CorðθÞ:
                                                                                                                                  45
                                           sffiffiffiffiffiffiffiffiffiffiffiffiffiffiffiffiffiffiffiffiffiffiffiffiffiffiffiffiffiffiffiffiffiffi
                                            X                                                                                                        θ¼θ−22°

                                      σi ¼         ði − μi Þ2 pði; jÞ;                       (4)
                                                    i;j

                                              sffiffiffiffiffiffiffiffiffiffiffiffiffiffiffiffiffiffiffiffiffiffiffiffiffiffiffiffiffiffiffiffiffiffi
                                               X
                                      σj ¼            ðj − μj Þ2 pði; jÞ:                    (5)
                                                    i;j

                   All the Cor curves along the four specific directions
                of 0 deg, 45 deg, 90 deg, and 135 deg were calculated for
                the model images. One of the four directions proximal to the
                texture dominant orientation is defined as θ in Eq. (6). For                           Fig. 2 (a) The direction used in GLCM calculation can be divided into
                model images with orientation to a certain extent [Figs. 1(a),                          four parts based on the four directions of 0 deg, 45 deg, 90 deg, and
                1(c), and 1(e)], the Cor curves calculated along the direction                          135 deg. (b) The Cor along all the directions in the range from θ− ^
                of θ are different from those calculated along the other                               22 deg to θ^ þ 22 deg. Note: GLCM ¼ gray level co-occurrence matrix.

                Journal of Biomedical Optics                                                   026007-3                                                          February 2012          •   Vol. 17(2)

Downloaded From: https://www.spiedigitallibrary.org/journals/Journal-of-Biomedical-Optics on 03 Feb 2021
Terms of Use: https://www.spiedigitallibrary.org/terms-of-use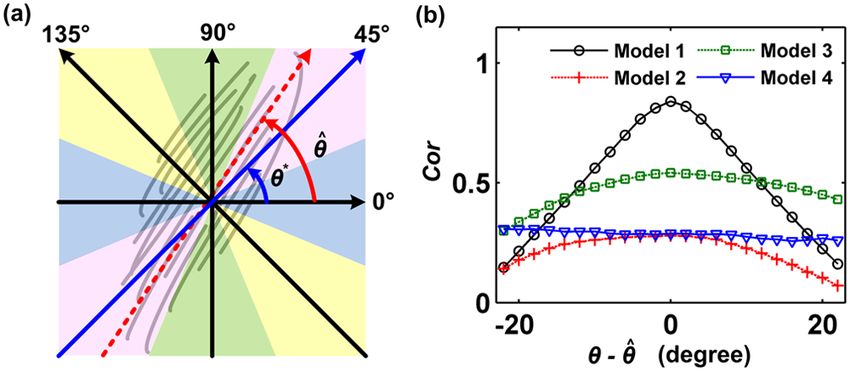
Hu et al.: Characterization of collagen fibers by means of texture analysis : : :

                   In addition, the Cor curves as a function of d for the model
                images with highly linear strips show periodic fluctuation
                [Figs. 1(b), 1(d), and 1(f)], which may provide information
                about the size of the strips. Based on the estimation of texture
                dominant orientation, the d value corresponding to the first val-
                ley of the Cor curves along the direction vertical to the dominant
                orientation was calculated and it was converted to length unit
                according to the size of the image to reflect the width of the
                collagen fibers.
                                                                                                   Fig. 3 (a) The Cor curves calculated along the direction vertical to the
                3     Results                                                                      dominant orientation from OD-GLCM show significantly different pat-
                                                                                                   terns between the regular and random model images, compared with
                3.1     Analysis of Model Images                                                   (b) the average Cor curves of 0 deg, 45 deg, 90 deg, and 135 deg using
                                                                                                   conventional GLCM method. Model 1, Model 2, Model 3, and Model 4
                For the images with a relatively regular texture, the estimated                    represent the four model images (a), (c), (e), and (g) in Fig. 1,
                dominant orientation was close to the true value (Table 1).                        respectively. The estimated fiber size is indicated by the word size
                The standard deviations of Cor (σ Cor ) for different model images                 in red arrows. Note: OD-GLCM ¼ orientation-dependent GLCM;
                were calculated (Table 1). It shows that the σ Cor value increases                 GLCM ¼ gray level co-occurrence matrix.
                as the texture of the image becomes more regular.
                    The Cor curve as a function of d along the direction vertical
                                                                                                   curves of the two groups of tendon samples calculated using
                to the dominant orientation was used to reflect the size of the
                                                                                                   the conventional GLCM method are relatively flat and close
                texture. As shown in Fig. 3(a) and Table 1, the d value corre-
                                                                                                   to each other. By contrast, the Cor curves calculated by the
                sponding to the first valley is close to the size of the strips in the
                                                                                                   OD-GLCM method show significantly different patterns, allow-
                model images [Figs. 1(a), 1(c), and 1(e)].
                    Compared with the conventional GLCM method, the pat-                           ing the discrimination of the collagen texture between the two
                terns of the OD-GLCM Cor curves provide better discrimination                      groups of tendon samples.
                between the regular and random images (Fig. 3). Besides, the                          The orderliness and size of the collagen fibers are further
                orderliness can be estimated and the fluctuation of the OD-                        characterized using the OD-GLCM method. Compared with
                GLCM Cor curves for the images with a relatively regular tex-
                ture shows quantitative relation with the fiber size (Table 1),
                allowing more detailed characterization of the texture
                morphology.

                3.2     Analysis of Tendons from Rats
                        with Different Ages
                To demonstrate the effectiveness of the OD-GLCM method on
                biomedical samples, we applied it to SHG images of tendons
                and compared it with the conventional GLCM method. The
                SHG images of tendons from the old rat group [Fig. 4(a)]
                and the young rat group [Fig. 4(b)] were obtained by the
                SHG microscope system. Compared with the relatively random
                collagen fibers of tendons from the young rats, those of the old
                rats are orderly arranged with obvious orientation and uniform
                texture.
                    For the SHG images of the tendon samples, the Cor curves as
                a function of d are calculated by the OD-GLCM and the con-
                ventional GLCM method, respectively [Fig. 4(c)]. The Cor

                Table 1 The estimated dominant orientation, orderliness, and fiber
                size of model images.

                                        ^ deg
                                        θ∕                               Fiber size∕pixel

                                Estimated       True        σ Cor      Estimated       True

                Model 1           145           145         0.31          12            13

                Model 2            49            50         0.06          13            13         Fig. 4 Comparison of conventional average GLCM analysis method
                                                                                                   and the OD-GLCM method based on the SHG images of tendons
                Model 3            45            50         0.06          20            20         from (a) six old rats and (b) six young rats. The Cor curves as a functin
                                                                                                   of (c) d and (d) θ are calculated respectively. Bars, SD.
                Model 4            70            —          0.01          23            13         Scale bar ¼ 30 μm. Note: GLCM ¼ gray level co-occurrence matrix;
                                                                                                   OD-GLCM ¼ orientation-dependent GLCM.

                Journal of Biomedical Optics                                                026007-4                                           February 2012   •   Vol. 17(2)

Downloaded From: https://www.spiedigitallibrary.org/journals/Journal-of-Biomedical-Optics on 03 Feb 2021
Terms of Use: https://www.spiedigitallibrary.org/terms-of-use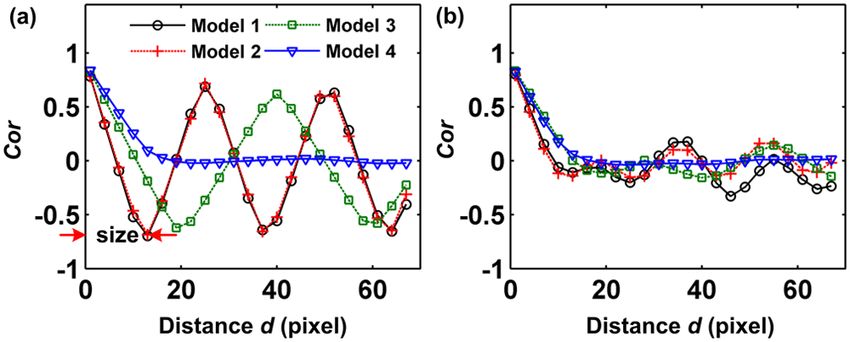
Hu et al.: Characterization of collagen fibers by means of texture analysis : : :

                Table 2 The estimated orderliness and size of collagen fibers of the                Images of the normal and the well differentiated pancreatic cancer
                tendon samples from rats with different ages (mean SD). t test on log-             tissue [Figs. 5(a) and 5(b)] show a linear arrangement of collagen
                transformed σ Cor and fiber size was done, for σ Cor , P ¼ 0.000007; for            fibers. The tiny difference is that collagen fibers of the well dif-
                fiber size, P ¼ 0.000003; n ¼ 6, old; n ¼ 6, young.                                 ferentiated pancreatic cancer tissue are slightly staggered and
                                                                                                    thinner than those of the normal tissues. In contrast, collagen
                                                σ Cor                         Fiber size∕μm         fibers of the poor differentiated pancreatic cancer tissue are
                                                                                                    crimped and show a lack of regularity [Fig. 5(c)], while those
                old                        0.18  0.05                          2.9  0.7           of the liver metastasis from pancreatic cancer gather into massive
                                                                                                    clumps and completely lose the original linear pattern [Fig. 5(d)].
                young                      0.05  0.01                          8.9  1.6
                                                                                                        Comparison analysis of the pancreatic SHG images based on
                                                                                                    the OD-GLCM method is shown in Fig. 6. It can be observed
                                                                                                    that the normal and cancerous pancreatic tissues can be easily
                the tendon samples from the young rats, an obvious peak of the                      differentiated by the Cor curves calculated along the direction
                Cor curves as a function of θ can be observed for the SHG                           vertical to the dominant orientation of the collagen fibers
                images of the old rats [Fig. 4(d)]. Besides, the quantitative                       [Fig. 6(a)]. The Cor curve of the normal tissue shows the
                descriptor σ Cor for the tendon samples from the old rats show                      most obvious fluctuation; the Cor curve of the liver metastasis
                significantly higher values than those from the young rats                          from pancreatic cancer are the most flat; while those of the well
                (Table 2, P ¼ 0.000007, n ¼ 6, t test on log-transformed                            and poor differentiated pancreatic cancer tissues fall in between.
                σ Cor ), indicating that the collagen fibers are more aligned                           In addition, the Cor curves as a function of θ for the normal
                than those of the young rats. In addition, the fiber size can                       pancreatic tissue show the sharpest peak [Fig. 6(b)], while the
                be estimated based on the Cor curves calculated along the direc-                    peaks of the Cor curves for the pancreatic tissues become less
                tion vetical to the dominant orientation (Table 2). The estimated                   obvious from well differentiated pancreatic cancer tissue to the
                values show that the collagen fibers of the tendons from the old                    liver metastasis from pancreatic cancer. Therefore, the initial
                rats are significantly thinner than those from the young rats                       SHG images of the normal and the cancerous human pancreatic
                (P ¼ 0.000003, n ¼ 6, t test on log-transformed fiber size).                        tissues can be distinguished by the patterns of the OD-GLCM
                The above characteristics acquired by the OD-GLCM method                            Cor curves. Accordingly, the estimated value of orderliness
                are consistent with the qualitative appearances of collagen fibers                  decreases from the normal pancreatic tissue, to the well differ-
                in the SHG images [Figs. 4(a) and 4(b)].                                            entiated pancreatic cancer tissues, to the liver metastasis from
                                                                                                    pancreatic cancer (Table 3), which indicates that the structure
                3.3     Differentiation of Normal and Cancerous Human                               of the collagen fibers gets more disordered as the pancreatic
                        Pancreatic Tissues                                                          cancer progresses. The estimated fiber size may also be useful
                                                                                                    for the evaluation of pancreatic cancer, since it is possibly an
                We applied the OD-GLCM method in the differentiation of SHG                         indicator associated with the degradation and remodeling of col-
                images of normal and cancerous human pancreatic samples. The                        lagen fibers during the pathological process. However, due to
                images were obtained by the SHG microscope system (Fig. 5).                         the limited sample size, the current data is insufficient to validate
                                                                                                    the value of the estimated fiber sizes in the discrimination of
                                                                                                    different pancreatic tissues (Table 3).

                                                                                                    4      Discussion
                                                                                                    4.1     Estimation of the Orderliness of Collagen Fibers
                                                                                                            in the Terms of the Scale
                                                                                                    We have demonstrated that the orderliness of collagen fibers
                                                                                                    imaged by SHG microscope system can be assessed by
                                                                                                    the OD-GLCM Cor curves as a function of θ. Instead of the

                                                                                                    Fig. 6 The OD-GLCM Cor curves as a function of (a) d and (b) θ for the
                                                                                                    SHG images of normal and cancerous human pancreatic samples
                                                                                                    (Fig. 5). Normal, WD Cancer, PD Cancer, and Liver Meta represent
                Fig. 5 SHG images of normal and cancerous human pancreatic sam-                     the normal pancreatic tissue, the well differentiated pancreatic
                ples. (a) normal pancreatic tissue; (b) well differentiated pancreatic can-         cancer tissue, the poor differentiated pancreatic cancer tissue, and
                cer tissue; (c) poor differentiated pancreatic cancer tissue; (d) liver             the liver metastasis from pancreatic cancer, respectively. Note:
                metastasis from pancreatic cancer. Scale bar ¼ 40 μm.                               OD-GLCM ¼ orientation-dependent GLCM.

                Journal of Biomedical Optics                                                026007-5                                          February 2012   •   Vol. 17(2)

Downloaded From: https://www.spiedigitallibrary.org/journals/Journal-of-Biomedical-Optics on 03 Feb 2021
Terms of Use: https://www.spiedigitallibrary.org/terms-of-use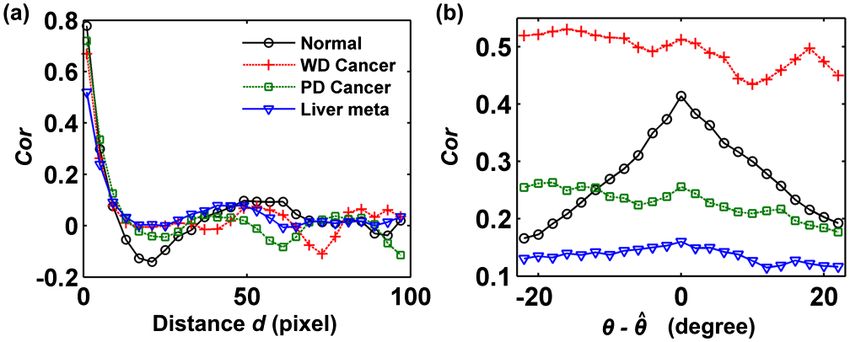
Hu et al.: Characterization of collagen fibers by means of texture analysis : : :
Table 3 The estimated orderliness and size of collagen fibers of the more regular than those of the poor differentiated pancreatic
human pancreatic tissues. cancer tissue and the liver metastasis from pancreatic cancer
[Fig. 7(c)], which is consistent with the results mentioned
above (Table 3).
σ Cor Fiber size
Normal 0.07 8.2 μm (20 pixel) 4.2 Comparison Between the OD-GLCM Method
and Other Commonly Used Methods
WD Cancer 0.06 6.2 μm (15 pixel)
for Texture Analysis
PD Cancer 0.03 10.3 μm (25 pixel)
The other GLCM feature curves such as energy or angular sec-
Liver meta 0.01 7.0 μm (17 pixel) ond moment have been used to differentiate collagen fibers with
different orderliness, such as aligned and randomly oriented
fibers.35 In our work, however, we found that the other
GLCM features such as energy or angular second moment, con-
evaluation from the aspect of the angle, the OD-GLCM Cor trast, and homogeneity (data not shown), resemble Cor that is
curves as a function of d calculated along the dominant orienta- dependent on the direction selected (Fig. 1). Therefore, it is
tion can also be used to describe the orderliness of collagen more stable and accurate to use the OD-GLCM energy curves
fibers in the terms of the scale. calculated based on the dominant orientation of the collagen
For the model images and the SHG images of tendon sam- fibers to reflect the orderliness of the texture. Moreover, the
ples, comparison analysis reveals that the d value corresponding OD-GLCM method can provide quantitative indicators for
to the inflexion of the OD-GLCM Cor curves calculated along the orderliness and the size of collagen fibers.
the dominant orientation [Figs. 7(a) and 7(b)] gets lower as the Other commonly used methods for the quantitative texture
collagen fibers become more disordered. For the discrimination analysis include fast Fourier transforms (FFT) and the wavelet
of the pancreatic samples, the Cor curves show that the collagen texture analysis (WTA) method.20,21 The FFT method depends
fibers of the normal and well differentiated cancer tissues are on a frequency decomposition of an image.20 It has been used to
evaluate the orientation index (or the anisotropy) of the SHG
images of skin and corneal collagen fibers, which is effective
for discrimination of collagen fibers with and without a particu-
lar orientation.35,39,41 But the classification of different morpho-
logical patterns (linear, curved, or disordered) based on the
estimation of the orderliness of collagen fibers has not been
reported. Particularly, the estimation of the length of the sarco-
meres, which have highly regular periodicity have been reported
based on the FFT method.42 However, it has not been assessed
whether the FFT method is feasible for broad application in tex-
ture analysis of biomedical images, since large amounts of col-
lagen fibers in the extracellular matrix of biological tissues are
not as regular as the sarcomeres.
The WTA method is a space-frequency analysis of grey-level
value variation based on wavelet transform,20,21 and has been
applied for the texture analysis of SHG images.42 However, it
is unable to provide the information directly associated with
the morphology of collagen fibers such as the orderliness and
the fiber size. Besides, WTA is generally considered to be a
state-of-the-art method to reveal the directionality of different
textures.20,43 But it has never been validated for the application
of texture analysis of the collagen fibers. Similar to the conven-
tional GLCM method, the WTA method only uses features cor-
responding to the horizontal, vertical, and diagonal directions to
analyze texture.20 Since the orientation is an important texture
characteristic of collagen fibers, this method may be more effec-
tive for biomedical applications when the dominant orientation
of collagen fibers is taken into consideration.
Since GLCM is a kind of statistical approach for texture ana-
lysis, the accuracy of the estimated dominant orientation of col-
lagen fibers depends on the number of the periodic units in the
images. As can be observed for the model images, when there
are more periodic units in the images, the estimated dominant
orientation and fiber size are more close to the true value
Fig. 7 The OD-GLCM Cor curves as a function of d calculated along
(Table 1). Therefore, the resulting estimation by OD-GLCM
the dominant orientation for (a) the model images, SHG images of method depends on the size of the region of interest (ROI)
(b) tendons and (c) pancreatic samples. Note: GLCM ¼ gray level after image rotation and cropping. Besides, for the completely
co-occurrence matrix; OD-GLCM ¼ orientation-dependent GLCM. random collagen fibers, the dominant orientation can hardly be
Journal of Biomedical Optics 026007-6 February 2012 • Vol. 17(2)
Downloaded From: https://www.spiedigitallibrary.org/journals/Journal-of-Biomedical-Optics on 03 Feb 2021
Terms of Use: https://www.spiedigitallibrary.org/terms-of-useHu et al.: Characterization of collagen fibers by means of texture analysis : : :
estimated, and the fiber size cannot be calculated accurately, References
either. Consequently, the OD-GLCM method is more effective 1. W. Friess, “Collagen—biomaterial for drug delivery,” Eur. J. Pharm.
for the description of the relatively ordered collagen fibers and Biopharm. 45(2), 113–136 (1998).
the differentiation between the regular and random collagen 2. T. Hompland et al., “Second-harmonic generation in collagen as a poten-
fibers. tial cancer diagnostic parameter,” J. Biomed. Opt. 13(5), 054050(2008).
Comparatively speaking, based on the estimation of the 3. C. Bayan et al., “Fully automated, quantitative, noninvasive assessment
dominant orientation of collagen fibers, the OD-GLCM method of collagen fiber content and organization in thick collagen gels,”
J. Appl. Phys. 105(10), 102042 (2009).
can not only distinguish different texture patterns, but also pro- 4. N. D. Kirkpatrick, M. A. Brewer, and U. Utzinger, “Endogenous
vide more comprehensive information quantitatively related optical biomarkers of ovarian cancer evaluated with multiphoton micro-
with the orderliness and size of collagen fibers for the relatively scopy,” Cancer Epidemiol. Biomarkers Prev. 16(10), 2048–2057
ordered collagen fibers. (2007).
5. G. Chen et al., “Nonlinear spectral imaging of human hypertrophic scar
based on two-photon excited fluorescence and second-harmonic genera-
tion,” Br. J. Dermatol. 161(1), 48–55 (2009).
4.3 Further Application to Clinical Evaluation 6. C. M. Hsueh et al., “Multiphoton microscopy: a new approach, in phy-
siological studies and pathological diagnosis for ophthalmology,”
In this paper, the number of human pancreatic samples is rather J. Innovative Opt. Health Sci. 2(1), 45–60 (2009).
small and the quantitative analysis is statistically limited. There 7. K. Lu et al., “Non-linear spectral imaging microscopy studies of human
is still some distance to go before the OD-GLCM can be used to hypertrophic scar,” J. Innovative Opt. Health Sci. 2(1), 61–66
diagnose and stage pancreatic cancer. For the clinical evaluation (2009).
of different types of tissues, a larger number of human pancrea- 8. P. Wilder-Smith et al., “In vivo multiphoton fluorescence imaging: a
novel approach to oral malignancy,” Lasers Surg. Med. 35(2),
tic samples should be examined to eliminate individual differ- 96–103 (2004).
ences in a further study, so that the morphological alterations of 9. O. Nadiarnykh et al., “Second harmonic generation imaging microscopy
collagen fibers between normal and cancerous human pancreatic studies of osteogenesis imperfecta,” J. Biomed. Opt. 12(5), 051805
tissues at different stages can be statistically characterized. Care- (2007).
ful investigations on the selection of the fields of view and the 10. A. Zoumi, A. Yeh, and B. J. Tromberg, “Imaging cells and extracellular
matrix in vivo by using second-harmonic generation and two-photon
interpretation of the quantitative parameters are required, and
excited fluorescence,” Proc. Natl. Acad. Sci. USA 99(17),
other quantitative methods (such as the evaluation of the content 11014–11019 (2002).
of collagen fibers) can also be complemented to provide com- 11. E. Georgiou et al., “Second and third optical harmonic generation in
prehensive information associated with the progression of pan- type I collagen, by nanosecond laser irradiation, over a broad spectral
creatic cancer. Meanwhile, the corresponding histological region,” Opt. Commun. 176(1–3), 253–260 (2000).
outcomes need to be represented to validate the results of the 12. S. V. Plotnikov et al., “Characterization of the myosin-based source for
second-harmonic generation from muscle sarcomeres,” Biophys. J.
SHG imaging.
90(2), 693–703 (2006).
13. L. K. Soh and C. Tsatsoulis, “Texture analysis of SAR sea ice imagery
using gray level co-occurrence matrices,” IEEE Trans. Geosci. Rem.
5 Conclusion Sens. 37(2), 780–795 (1999).
We have developed the OD-GLCM method for the quantitative 14. R. M. Williams, W. R. Zipfel, and W. W. Webb, “Interpreting second-
harmonic generation images of collagen I fibrils,” Biophys. J. 88(2),
texture analysis, since the dominant orientation of the collagen 1377–1386 (2005).
fibers is usually ignored in the conventional GLCM analysis, 15. P. Friedl, “Dynamic imaging of cellular interactions with extracellular
which is an important characteristic of collagen fibers with a matrix,” Histochem. Cell Biol. 122(3), 183–190 (2004).
filamentous structure. The calculation of the OD-GLCM feature 16. E. Brown et al., “Dynamic imaging of collagen and its modulation in
curves was based on the estimated dominant orientation of col- tumors in vivo using second-harmonic generation,” Nat. Med. 9(6),
lagen fibers. We demonstrated that the OD-GLCM method is 796–800 (2003).
17. P. J. Campagnola and L. M. Loew, “Second-harmonic imaging micro-
more effective than conventional GLCM method in discriminat- scopy for visualizing biomolecular arrays in cells, tissues and
ing collagen fibers of tendons from rats with different ages. organisms,” Nat. Biotechnol. 21(11), 1356–1360 (2003).
Moreover, additional information including the orderliness 18. G. Cox et al., “3-dimensional imaging of collagen using second harmo-
and the size of the collagen fibers can be obtained using the nic generation,” J. Struct. Biol. 141(1), 53–62 (2003).
OD-GLCM method. The OD-GLCM method was applied to 19. W. R. Zipfel et al., “Live tissue intrinsic emission microscopy using
multiphoton-excited native fluorescence and second harmonic genera-
discriminate the preliminary SHG images of different types
tion,” Proc. Natl. Acad. Sci. USA 100(12), 7075–7080 (2003).
of human pancreatic tissues. The method has potential applica- 20. M. H. Bharati, J. J. Liu, and J. F. MacGregor, “Image texture analysis:
tions in the diagnosis and staging of diseases marked with methods and comparisons,” Chemom. Intell. Lab. Syst. 72(1), 57–71
abnormal collagen morphology. (2004).
21. G. Castellano et al., “Texture analysis of medical images,” Clin. Radiol.
59(12), 1061–1069 (2004).
Acknowledgments 22. A. Al-Janobi, “Performance evaluation of cross-diagonal texture matrix
method of texture analysis,” Pattern Recogn. 34(1), 171–180 (2001).
This work was supported by the National Major Scientific 23. D. A. Clausi and M. E. Jernigan, “A fast method to determine co-occur-
Research Program of China (No. 2011CB910401), National rence texture features,” IEEE Trans. Geosci. Rem. Sens. 36(1), 298–300
Natural Science Foundation of China (No. 61178077), Program (1998).
for New Century Excellent Talents in University (No. NCET-08- 24. B. Tian et al., “A study of cloud classification with neural networks
using spectral and textural features,” IEEE Trans. Neural. Network
0216), Specific International Scientific Cooperation (Grant
10(1), 138–151 (1999).
No. 2010DFR30820), Science Fund for Creative Research 25. F. Kayitakire, C. Hamel, and P. Defourny, “Retrieving forest structure
Group of China (Grant No. 61121004), and the Fundamental variables based on image texture analysis and IKONOS-2 imagery,”
Research Funds for the Central Universities. Rem. Sens. Environ. 102(3–4), 390–401 (2006).
Journal of Biomedical Optics 026007-7 February 2012 • Vol. 17(2)
Downloaded From: https://www.spiedigitallibrary.org/journals/Journal-of-Biomedical-Optics on 03 Feb 2021
Terms of Use: https://www.spiedigitallibrary.org/terms-of-useHu et al.: Characterization of collagen fibers by means of texture analysis : : :
26. E. S. Gadelmawla, “A vision system for surface roughness characteriza- 35. R. Cicchi et al., “Scoring of collagen organization in healthy and dis-
tion using the gray level co-occurrence matrix,” NDT & E International eased human dermis by multiphoton microscopy,” J. Biophotonics
37(7), 577–588 (2004). 3(1–2), 34–43 (2010).
27. G. Bartolacci et al., “Application of numerical image analysis to process 36. R. M. Haralick, K. Shanmugam, and I. H. Dinstein, “Textural Features
diagnosis and physical parameter measurement in mineral processes — for image classification,” IEEE Trans. Syst. Man Cybern. 3(6), 610–621
Part I: flotation control based on froth textural characteristics,” (1973).
Miner. Eng. 19(6–8), 734–747 (2006). 37. A. Zoumi et al., “Imaging coronary artery microstructure using second-
28. A. V. Alvarenga et al., “Complexity curve and grey level co-occurrence harmonic and two-photon fluorescence microscopy,” Biophys. J. 87(4),
matrix in the texture evaluation of breast tumor on ultrasound images,” 2778–2786 (2004).
Med. Phys. 34(2), 379–387 (2007). 38. T. T. Le et al., “Label-free molecular imaging of atherosclerotic lesions
29. G. A. Losa and C. Castelli, “Nuclear patterns of human breast cancer using multimodal nonlinear optical microscopy,” J. Biomed. Opt.
cells during apoptosis: characterisation by fractal dimension and co- 12(5), 054007 (2007).
occurrence matrix statistics,” Cell Tissue Res. 322(2), 257–267 (2005). 39. P. Matteini et al., “Photothermally-induced disordered patterns of cor-
30. F. Chabat, G. Z. Yang, and D. M. Hansell, “Obstructive lung diseases: neal collagen revealed by SHG imaging,” Opt. Express 17(6),
texture classification for differentiation at CT,” Radiol. 228(3), 871–877 4868–4878 (2009).
(2003). 40. A. Baraldi and F. Parmiggiani, “An investigation of the textural char-
31. W. Chen et al., “Volumetric texture analysis of breast lesions on con- acteristics associated with gray level co-occurrence matrix statistical
trast-enhanced magnetic resonance images,” Magn. Reson. Med. 58(3), parameters,” IEEE Trans. Geosci. Rem. Sens. 33(2), 293–304
562–571 (2007). (1995).
32. D. M. U. Sabino et al., “A texture approach to leukocyte recognition,” 41. S. L. Wu et al., “Quantitative analysis on collagen morphology in aging
R. Time. Imag. 10(4), 205–216 (2004). skin based on multiphoton microscopy,” J. Biomed. Opt. 16(4), 040502
33. J. E. Wilhjelm et al., “Quantitative analysis of ultrasound B-mode (2011).
images of carotid atherosclerotic plaque: correlation with visual classi- 42. S. Plotnikov et al., “Optical clearing for improved contrast in second
fication and histological examination,” IEEE Trans. Med. Imag. 17(6), harmonic generation Imaging of skeletal muscle,” Biophys. J. 90(1),
910–922 (1998). 328–339 (2006).
34. D. Mahmoud-Ghoneim et al., “Three dimensional texture analysis in 43. A. Lefebvre, T. Corpetti, and L. H. Moy, “Estimation of the orientation
MRI: a preliminary evaluation in gliomas,” Magn. Reson. Imag. of textured patterns via wavelet analysis,” Pattern Recogn. Lett. 32(2),
21(9), 983–987 (2003). 190–196 (2011).
Journal of Biomedical Optics 026007-8 February 2012 • Vol. 17(2)
Downloaded From: https://www.spiedigitallibrary.org/journals/Journal-of-Biomedical-Optics on 03 Feb 2021
Terms of Use: https://www.spiedigitallibrary.org/terms-of-useYou can also read