Characterization of primary and aged wood burning and coal combustion organic aerosols in an environmental chamber and its implications for ...
←
→
Page content transcription
If your browser does not render page correctly, please read the page content below
Atmos. Chem. Phys., 21, 10273–10293, 2021
https://doi.org/10.5194/acp-21-10273-2021
© Author(s) 2021. This work is distributed under
the Creative Commons Attribution 4.0 License.

Characterization of primary and aged wood burning and coal
combustion organic aerosols in an environmental chamber
and its implications for atmospheric aerosols
Amir Yazdani1 , Nikunj Dudani1 , Satoshi Takahama1 , Amelie Bertrand2 , André S. H. Prévôt2 , Imad El Haddad2 , and
Ann M. Dillner3
1 ENAC/IIE   Swiss Federal Institute of Technology Lausanne (EPFL), 1015 Lausanne, Switzerland
2 Laboratory of Atmospheric Chemistry, Paul Scherrer Institute, 5232 Villigen, Switzerland
3 Air Quality Research Center, University of California Davis, Davis, California, USA

Correspondence: Satoshi Takahama (satoshi.takahama@epfl.ch) and Imad El Haddad (imad.el-haddad@psi.ch)

Received: 2 September 2020 – Discussion started: 28 September 2020
Revised: 21 January 2021 – Accepted: 25 January 2021 – Published: 8 July 2021

Abstract. Particulate matter (PM) affects visibility, climate,   functional groups after aging, consistent with expected ox-
and public health. Organic matter (OM), a uniquely com-          idation pathways for volatile organic compounds (VOCs) of
plex portion of PM, can make up more than half of to-            each emission source. The AMS mass spectra also show vari-
tal atmospheric fine PM mass. We investigated the effect         ations due to source and aging that are consistent with the
of aging on secondary organic aerosol (SOA) concentration        MIR functional group (FG) analysis. Finally, a comparison
and composition for wood burning (WB) and coal combus-           of the MIR spectra of aged chamber WB OA with that of
tion (CC) emissions, two major atmospheric OM sources,           ambient samples affected by residential wood burning and
using mid-infrared (MIR) spectroscopy and aerosol mass           wildfires reveals similarities regarding the high abundance of
spectrometry (AMS). For this purpose, primary emissions          organics, especially acids, and the visible signatures of lignin
were injected into an environmental chamber and aged us-         and levoglucosan. This finding is beneficial for the source
ing hydroxyl (diurnal aging) and nitrate (nocturnal aging)       identification of atmospheric aerosols and interpretation of
radicals to reach an atmospherically relevant oxidative age.     their complex MIR spectra.
A time-of-flight AMS instrument was used to measure the
high-time-resolution composition of non-refractory fine PM,
while fine PM was collected on PTFE filters before and after
aging for MIR analysis. AMS and MIR spectroscopy indi-           1   Introduction
cate an approximately 3-fold enhancement of organic aerosol
(OA) concentration after aging (not wall-loss corrected). The    Particulate matter (PM) affects visibility and climate (Hal-
OM : OC ratios also agree closely between the two methods        lquist et al., 2009). For example, fine PM can play the role of
and increase, on average, from 1.6 before aging to 2 during      cloud condensation nuclei (CCN) impacting cloud formation
the course of aging. MIR spectroscopy, which is able to dif-     (McFiggans et al., 2004). PM can also considerably perturb
ferentiate among oxygenated groups, shows a distinct func-       the transfer of different wavelengths of electromagnetic ra-
tional group composition for aged WB (high abundance of          diation by scattering or absorption phenomena (Seinfeld and
carboxylic acids) and CC OA (high abundance of non-acid          Pandis, 2016). In addition, exposure to ambient fine PM is
carbonyls) and detects aromatics and polycyclic aromatic hy-     estimated to have caused 8.9 million premature deaths world-
drocarbons (PAHs) in emissions of both sources. The MIR          wide per year (in 2015; Burnett et al., 2018). Organic matter
spectra of fresh WB and CC aerosols are reminiscent of their     (OM), which constitutes up to 90 % of total fine atmospheric
parent compounds with differences in specific oxygenated         PM, is a key factor in aerosol-related phenomena (Russell,
                                                                 2003; Shiraiwa et al., 2017). However, its chemical com-

Published by Copernicus Publications on behalf of the European Geosciences Union.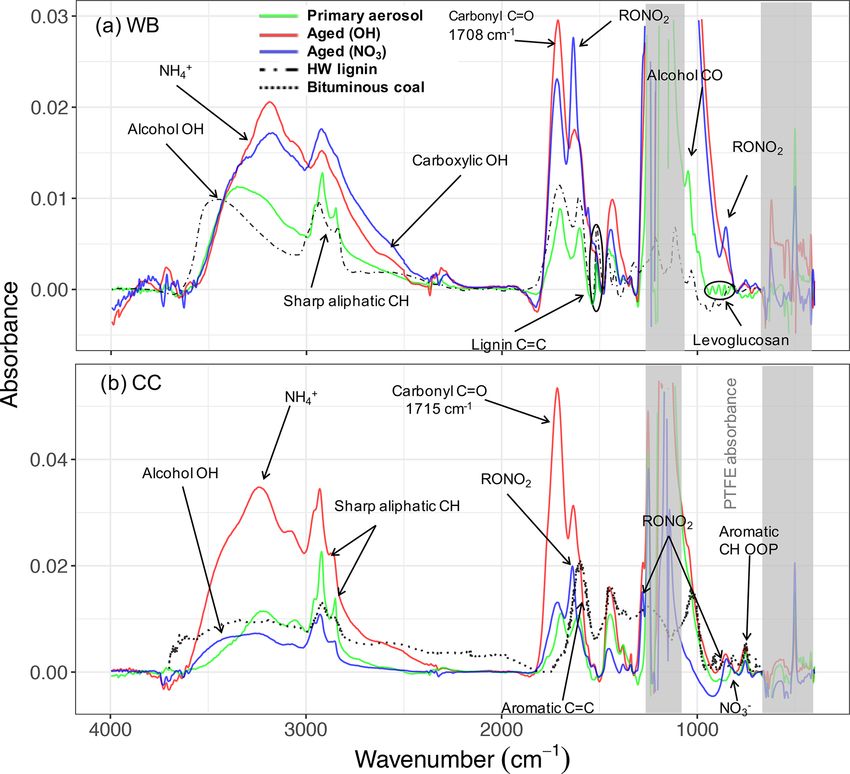
10274                                                        A. Yazdani et al.: Primary and aged wood and coal burning OA

position and formation mechanisms have not yet been fully             MIR spectroscopy, which is commonly performed off-line
characterized due to its compositional complexity (Kanaki-         on polytetrafluoroethylene (PTFE) filters, provides direct in-
dou et al., 2005; Turpin et al., 2000).                            formation about FG abundances in OA collected on the fil-
   Biomass burning particulate emissions (including those          ters. This information can be converted to OM, OC (or-
from residential wood burning, WB, prescribed burning, and         ganic carbon), and the OM : OC ratio with the aid of statisti-
wildfire) are major contributors to total atmospheric OM           cal models and laboratory standards with a few assumptions
with an increasing importance due to rising wildfire ac-           (Boris et al., 2019; Ruthenburg et al., 2014; Reggente et al.,
tivities (Westerling, 2016; DeCarlo et al., 2008; Sullivan         2016; Coury and Dillner, 2008). Recent studies show good
et al., 2008). Biomass burning primary organic aerosols            agreement between MIR OM and OC estimates and the ther-
(POAs) account for 16 % to 68 % of total OM mass in Eu-            mal optical reflectance (TOR) OC and residual OM methods
rope (Puxbaum et al., 2007). Coal combustion (for electric-        for monitoring networks (Boris et al., 2019). The main ad-
ity and heat generation) is another major POA source in            vantage of MIR spectroscopy over other common methods is
China and some regions of Europe (Haque et al., 2019; Jun-         that it is relatively fast, inexpensive, and non-destructive to
ninen et al., 2009), emitting considerable amounts of car-         the filter sample during analysis (Ruthenburg et al., 2014).
cinogenic and mutagenic polycyclic aromatic hydrocarbons           However, sampling for MIR spectroscopy is usually per-
(PAHs) (Sauvain et al., 2003). Approximately 40 % of the           formed for at least several minutes, resulting in lower tem-
world’s electricity (and up to 66 % in China) is generated         poral resolution (Faber et al., 2017). Moreover, the pres-
in coal-fueled power plants (World Coal Association, World         ence of overlapping peaks complicates the interpretation of
Coal Association, 2020). Biomass burning and coal com-             the MIR spectrum. Collocated AMS and MIR measurements
bustion are also believed to be responsible for a large frac-      can combine the advantages of both techniques and provide
tion of secondary organic aerosol (SOA), especially in win-        high-time-resolution measurements with FG quantification
ter when biogenic emissions are largely absent (Qi et al.,         (e.g., Faber et al., 2017; Chen et al., 2016; Frossard et al.,
2019; Lanz et al., 2010; Zhang et al., 2020). Recent stud-         2014; Russell et al., 2009a; Chhabra et al., 2011b). The un-
ies highlight the contribution of biomass burning by showing       certainties of OC and OA mass concentrations derived based
the predominance of carbon from non-fossil-fuel origins in         on Fourier-transform infrared spectroscopy (FTIR) and AMS
SOA even in industrial regions (Haddad et al., 2013; Beek-         have been reported to be within 35 % (Dillner and Takahama,
mann et al., 2015). To date, primary biomass burning emis-         2015; Gilardoni et al., 2009; Russell et al., 2009b; Frossard
sions have been investigated in several works (e.g., Johans-       et al., 2011; Liu et al., 2011; Corrigan et al., 2013a; Frossard
son et al., 2004; Bäfver et al., 2011; Alves et al., 2011). How-   et al., 2014; Reggente et al., 2019a) and 25 %, respectively
ever, SOAs and their chemical compositions have not been           (Canagaratna et al., 2007). Precision for replicate measure-
studied extensively until recently (e.g., Bertrand et al., 2017;   ments with the same instrument has been shown to be sub-
Tiitta et al., 2016; Bruns et al., 2015) due to sophisticated      stantially higher (e.g., Debus et al., 2019b).
experimental setup requirements.                                      This study is one of the few examples of AMS and MIR
   The determination of organic aerosol (OA) and SOA               spectroscopy being combined to provide a superior chem-
chemical compositions involves a large range of analytical         ical resolution for analyzing burning emissions in an en-
and computational techniques. Aerosol mass spectrometry            vironmental chamber and in the atmosphere. In this work,
(AMS) and mid-infrared (MIR) spectroscopy are two meth-            a series of wood burning (WB) and coal combustion (CC)
ods capable of analyzing most of the OA mass in addition to        experiments were conducted in an environmental chamber
providing information about chemical class or the functional       at the Paul Scherrer Institute (PSI). An AMS measured the
groups (FGs) (Hallquist et al., 2009). In AMS, non-refractory      chemical composition of OA throughout the aging process,
aerosol is first vaporized (normally at 600 ◦ C). Thereafter,      while fresh and aged fine aerosols were collected on sepa-
the vaporized fraction is turned to ionized fragments and          rate PTFE filters, making it possible to combine the measure-
is then detected by the mass spectrometer to obtain online         ments of the two methods. We investigated the MIR spectra
atomic composition of non-refractory aerosol. This method          and FG composition of POA and SOA formed after diurnal
is well characterized for its capability to estimate elemen-       and nocturnal aging processes in relation to their parent com-
tal composition with a high time resolution and detection          pounds and the oxidation products of their identified volatile
limit (Canagaratna et al., 2007). There are, however, some         organic compounds (VOCs). These results were combined
known challenges: particle collection efficiency of aerody-        with the high-resolution AMS mass spectra to evaluate the
namic lens section (Canagaratna et al., 2007); particle bounce     consistency of the two techniques and to better understand
back in the vaporizer (Kumar et al., 2018); potential reac-        differences in the chemical composition caused by different
tions occurring in ion chamber (Faber et al., 2017); and, most     emission sources and aging. Finally, the MIR spectra of the
importantly, extensive molecule fragmentation (Faber et al.,       chamber biomass burning samples were compared to those
2017; Canagaratna et al., 2007) with the common ionization         of some atmospheric burning-influenced aerosols collected
method (i.e., electron ionization, EI) that makes the interpre-    at the Interagency Monitoring of PROtected Visual Environ-
tation of the AMS mass spectrum difficult.                         ments (IMPROVE, IMPROVE, 2019) network http://vista.

Atmos. Chem. Phys., 21, 10273–10293, 2021                                          https://doi.org/10.5194/acp-21-10273-2021
A. Yazdani et al.: Primary and aged wood and coal burning OA                                                               10275

cira.colostate.edu/improve/ (last access: 20 April 2020) to       (HR-TOF) AMS reached values of approximately 20 µg m−3 .
understand their similarities and to develop a method for the     WB and CC samples were extracted from the chimney and
identification of atmospheric burning-influenced samples us-      diluted using an ejector diluter (DI-1000, Dekati Ltd.) before
ing MIR spectroscopy.                                             being injected into the chamber. The lines from the chimney
                                                                  to the environmental chamber were heated to 413 K to limit
                                                                  semi-volatile compound condensation in the lines. The aver-
2     Methods                                                     age temperature and relative humidity of the chamber after
                                                                  injection were maintained at 293 K and 55 %–60 %, respec-
In the following sections, the experimental setup (Sect. 2.1),    tively. The emissions were left static for 30 min in the cham-
online and off-line measurement techniques (Sect. 2.2 and         ber after injection to ensure proper mixing and for sampling
2.3), and atmospheric sample collection (Sect. 2.4) are de-       and characterizing the primary organic aerosol. Thereafter,
scribed in detail. Thereafter, the statistical methods used for   emissions were aged using the hydroxyl or nitrate radical for
postprocessing are discussed in Sect. 2.5 and 2.6.                simulating diurnal and nocturnal aging mechanisms.
                                                                     The OH radical was produced by the photolysis of nitrous
2.1    Laboratory experimental setup and procedure                acid (HONO) continuously injected into the chamber, using
                                                                  UV lights (40 × 100 W, Cleo Performance, Philips). HONO
Four wood burning (WB) and six coal combustion (CC) ex-           was generated by reacting constant flows of diluted sulfu-
periments were conducted in a collapsible Teflon chamber of       ric acid (H2 SO4 ) and sodium nitrite (NaNO2 ) in a custom
6 m3 at the Paul Scherrer Institute (PSI). We studied the ef-     gas flask. Pure air passed through the flask and then a PTFE
fects of fuel source and diurnal/nocturnal aging on the chem-     membrane filter before being injected into the chamber to en-
ical composition of the emissions. The experimental setup in      sure particle-free flow of HONO (the procedure is explained
this work was similar to that used by Bertrand et al. (2017)      by Taira and Kanda, 1990; Platt et al., 2013). Before ag-
(Fig. S1 in the Supplement).                                      ing, 1 µL of deuterated butanol-D9 (98 %, Cambridge Isotope
   For the WB experiments, we have followed the proce-            Laboratories) was injected into the chamber to measure the
dures developed in Bertrand et al. (2017, 2018a) which favor      OH radical exposure (Barmet et al., 2012). The concentration
smoldering-dominated wood fires. Three beech wood logs            of butanol-D9 was monitored by a proton transfer reaction
(approximately 2.5 kg) without bark and an additional 300 g       time-of-flight mass spectrometer (PTR-TOF-MS 8000, Ioni-
of kindling (beech) were burned in a modern wood stove            con Analytik). Emissions were aged for around 4 h to reach
(2010 model). The logs were ignited using three fire starters     OH exposures of (2–3)×107 molec cm−3 h corresponding to
composed of wood shavings, paraffin, and natural resins.          20–30 h of aging in the atmosphere (assuming a 24 h average
The moisture content of the logs was measured to be around        OH concentration of 1 × 10⁶ molec cm−3 in the atmosphere;
11 %. Each burning experiment was started with a lighter fol-     Seinfeld and Pandis, 2016). For the nocturnal aging experi-
lowed by immediate closing of the burner door. Emissions          ments, the NO3 radical was produced by a single injection of
past the ignition, in which kindling wood and starters were       O3 and NO2 in the chamber. The NO2 : O3 ratio we have used
fully combusted, were injected into the chamber.                  is approximately 1, and their concentrations were approxi-
   In the CC experiments, 300 g of bituminous coal from           mately 50 ppb. The contribution of NOx from combustion
Inner Mongolia (63 % carbon content) was burned. First,           was less than 10 ppb. The concentration of NO3 was inferred
the ash drawer of the stove was loaded with kindling wood         from the reactivity of phenol (m/z 96.058, [C6H7OH]H+)
(beech), which was ignited and served to ignite the coal. The     emitted from wood burning and coal combustion (kNO3 =
wood was removed from the drawer after proper ignition of         3.9 × 10⁻¹² cm3 molec−1 s−1 ). We calculated an initial con-
the coal. The emissions past the ignition phase were injected     centration of NO3 of 1–2.5 × 10⁷ molec cm−3 . The effects of
in the chamber via a single injection. Klein et al. (2018) have   vapor wall losses of primary semi-volatile species and of ox-
shown that the temperature in the stove at the starting phase     idized vapors in our chamber are detailed in Bertrand et al.
significantly affects the total emission rates of SOA precur-     (2018a) and in Jiang et al. (2020), respectively, and are be-
sors and to a lesser extent their composition. Here, the igni-    yond the scope of this paper.
tion temperature spanned a similar range as in Klein et al.          After each experiment, the chamber was cleaned by inject-
(2018). Control experiments were performed to evaluate the        ing O3 for 1 h and irradiating with a set of UV lights while
effect of kindling wood on the emissions, for which we fol-       flushing with pure air. Then, the chamber was flushed with
lowed a similar procedure as for the real experiments but         pure air in the dark for at least 12 h (similar to the procedure
without putting coal in the stove. The resulting emissions        described by Bruns et al., 2015). The pure air injection sys-
after removing the ignited kindling were not different from       tem consists of a generator (Atlas Copco SF 1 oil-free scroll
background emissions for both particle and gas phases.            compressor with 270 L container, Atlas Copco AG, Switzer-
   In both CC and WB experiments, the injection was contin-       land) coupled to an air purifier (AADCO 250 series, AADCO
ued (from 5 to 25 min) until the measured concentration of        Instruments, Inc., USA) which provides a hydrocarbon back-
primary organic aerosol by the high-resolution time-of-flight     ground of sub 10 ppb C. The background particle- and gas-

https://doi.org/10.5194/acp-21-10273-2021                                       Atmos. Chem. Phys., 21, 10273–10293, 2021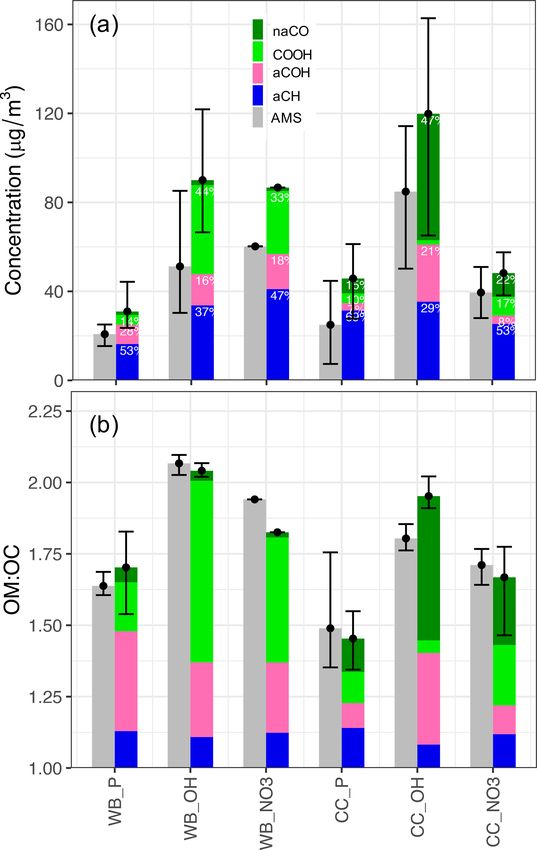
10276                                                        A. Yazdani et al.: Primary and aged wood and coal burning OA

phase concentrations were measured in the clean chamber            continuously purged with dry air treated with a purge gas
before each experiment. Blank experiments were performed,          generator (Puregas GmbH) to minimize water vapor and car-
in which the chamber was filled with either pure air or a mix      bon dioxide interferences.
of pure air and ambient air sampled through the heated sam-
pling system and the lights were switched on. In these ex-         2.4     Atmospheric samples (IMPROVE network)
periments, approximately 1 µg m−3 of organic aerosol was
formed.                                                            Particulate matter with diameter less than 2.5 µm (PM2.5 )
                                                                   was collected on PTFE filters (25 mm diameter Teflo® mem-
2.2   Online PM measurement                                        brane, Pall Corporation) every third day for 24 h, midnight
                                                                   to midnight, at a nominal flow rate of 22.8 L min−1 during
After the primary emission injections, PM emissions in the         2011 and 2013 at selected sites in the IMPROVE network
chamber were monitored using two online techniques. Non-           (approximately 3050 samples from 1 urban and 6 rural sites
refractory particle composition was measured at a temporal         in 2011 and 4 urban and 12 rural sites in 2013). The PTFE
resolution of 30 s by a HR-TOF AMS (Aerodyne Research              filters were analyzed using a Bruker Tensor 27 FT-IR in-
Inc.; DeCarlo et al., 2006) operating in V mode (mass resolu-      strument equipped with a liquid-nitrogen-cooled, wide-band
tion 1m/m = 2000), with a vaporizer temperature of 600 ◦ C         mercury–cadmium–telluride (MCT) detector, at a resolution
and pressure of approximately 10−5 Pa, and EI operating at         of 4 cm−1 . In this work, atmospheric samples were divided
70 eV, equipped with a 2.5 µm inlet aerodynamic lens. Data         into four mutually exclusive subgroups: urban, rural, residen-
postprocessing was performed in Igor Pro 6.3 (Wave Met-            tial wood burning, and wildfire (residential wood burning and
rics) using SQUIRREL (Sequential Igor Data Retrieval) 1.57         wildfire samples were identified by Bürki et al., 2020). Bürki
and PIKA (Peak Integration by Key Analysis) 1.15Z rou-             et al. (2020) separated and identified the burning-influenced
tines. The elemental and OM : OC ratios were determined            samples in the same dataset using cluster analysis and sub-
according to Canagaratna et al. (2015). The reported OA            sequent analysis of the clusters. They divided the burning-
concentrations were not wall-loss corrected. The AMS ion-          influenced samples into residential wood burning and wild-
ization efficiency was calibrated using NH4 NO3 particles. A       fire subcategories by extending further down the hierarchical
condensation particle counter (CPC; 3025A TSI) measured            tree. The residential wood burning subcategory was labeled
total particle number concentrations, and a scanning mobility      according to its occurrence during winter months in Phoenix,
particle sizer (SMPS; CPC 3022, TSI) measured particle size        AZ (Bürki et al., 2020), where residential wood burning com-
distribution. Particles were dried (Nafion, Perma Pure LLC)        monly takes place (Pope et al., 2017). The wildfire subcate-
upstream of the AMS, SMPS, and CPC. The AMS collection             gory was labeled due to its occurrence during a known fire
efficiency was verified using SMPS and ranged between 0.7–         event (Rim Fire, CA, 2013).
1.1 and therefore was assumed to be approximately 1 for our
                                                                   2.5     Postprocessing of MIR spectra to identify and
conditions.
                                                                           quantify functional groups in laboratory and
                                                                           IMPROVE samples
2.3   Off-line PM sampling and measurement
                                                                   After obtaining the MIR spectra of the laboratory and am-
Primary and aged PM emissions were collected on separate           bient samples, they were processed the same. The postpro-
PTFE filters (47 mm diameter Teflo® membrane, Pall Cor-            cessing enabled the quantification of alcohol COH (aCOH),
poration) for 20 min after the injection of primary emissions      carboxylic acid (COOH), aliphatic CH (aCH), and non-acid-
into the chamber and after 4 h of aging. The aerosol collec-       carbonyl (naCO) functional groups and the identification of
tion area was limited to a circle with a diameter of 1 cm in       PAHs, organonitrates, levoglucosan, inorganic sulfate, and
the center of the filter using PTFE masking elements placed        nitrate. In this section, the methods used for spectral post-
above and below the filters (Russell et al., 2009b). Sampling      processing are described in detail.
on PTFE filters was performed at a flow rate of 8 L min−1 us-
ing a flow system composed of a sharp-cut-off cyclone (1 µm        2.5.1    Baseline correction
at a nominal flow rate of 16 L min−1 ) and a silica gel denuder.
Hereafter, these PTFE filters are referred to by their fuel and    Baseline correction was performed to eliminate the contri-
oxidant: e.g., WB_OH refers to the filters corresponding to        bution of background drift, light scattering by filter mem-
the WB experiments aged with OH. After sampling, filters           brane and particles, and absorption by carbonaceous mate-
were immediately stored in filter petri dishes at 253 K be-        rial due to electronic transitions (Russo et al., 2014; Parks
fore MIR analysis to minimize volatilization and chemical          et al., 2019). For this purpose, we used a smoothing spline
reactions. The PTFE filters were analyzed using a Bruker           method similar to the approach taken by Kuzmiakova et al.
Vertex 80 FT-IR instrument equipped with an α deuterated           (2016). In this method, a cubic smoothing spline was fitted
lanthanum alanine doped triglycine sulfate (DLaTGS) detec-         to the raw spectra (excluding organic FG bands) and then
tor at a resolution of 4 cm−1 . The FTIR sample chamber was        was subtracted from them to obtain the net absorption due

Atmos. Chem. Phys., 21, 10273–10293, 2021                                           https://doi.org/10.5194/acp-21-10273-2021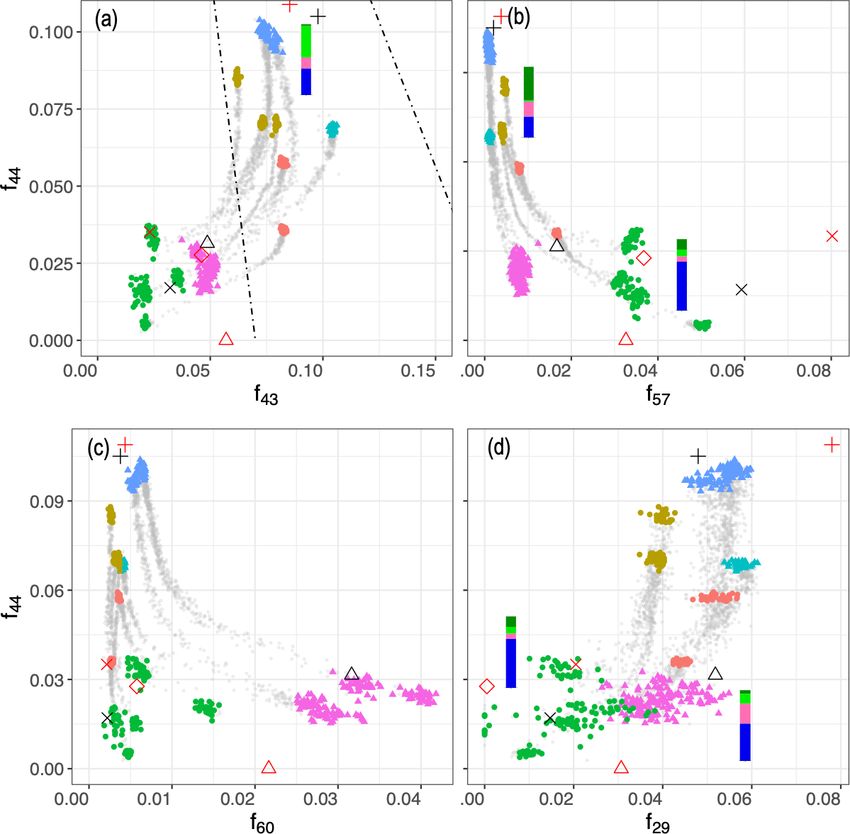
A. Yazdani et al.: Primary and aged wood and coal burning OA                                                               10277

to FG vibrations at each wavelength. The current version ex-      (e.g., levoglucosan and lignin). Levoglucosan was quantified
tends the baseline correction algorithm by Kuzmiakova et al.      using its fingerprint features.
(2016) (limited to 1500–4000 cm−1 ) to the 400–4000 cm−1
range.                                                            2.6    Dimensionality reduction of AMS mass spectra

2.5.2   Blank subtraction                                         While AMS provides a well-characterized, time-resolved
                                                                  measurement of OA aging, the extensive fragmentation of
Although PTFE filters are optically thin in the MIR range,        molecules, high number of ion fragments, and collinear-
they have several absorbing bands due to the C−F bond             ity of ion fragment intensities make the interpretation of
vibrational modes (e.g., at 1000–1320 cm−1 ; Quarti et al.,       AMS mass spectra complex (Faber et al., 2017; Canagaratna
2013). These bands overlap with some organic and inorganic        et al., 2007). We used principal component analysis (PCA;
function group bands and limit the information that can be        Hotelling, 1933) to reduce the dimensionality of the AMS
extracted from the analysis of OA on PTFE filters. To miti-       mass spectra in order to identify the most important drivers
gate this issue, a scaled version of a baseline-corrected blank   of variability in the spectral data and their connection with
filter spectrum (the contribution of filter membrane scatter-     the FG composition of OA. The advantage of PCA analysis
ing was excluded, and only PTFE absorptions were main-            over analysis of the normalized conventional mass fragments
tained) was subtracted from the baseline-corrected sample         (e.g., f43 and f44 in Fig. 5) is that PCA loads the highly cor-
spectra to retrieve some of the overlapping features (Fig. S2).   related fragment ions onto the same principal components
The scaling procedure compensates for the variation in blank      (PCs) that are orthogonally oriented to each other, thereby
filter absorbances due to factors such as non-uniformity in       reducing redundancy among dimensions. Furthermore, PCA
PTFE membrane morphology due to manufacturing variabil-           describes the range of variability spanned specifically by this
ity and/or aerosol loading differences between filters and        dataset, accentuating smaller variations that might be lost
within the same filter (Debus et al., 2019a; Quarti et al.,       using the conventional ranges spanned by normalized mass
2013) by scaling the C−F peak at 1210 cm−1 . This approach        fragment analysis.
is different from those taken by Takahama et al. (2013) and          Before applying PCA, mass spectra at each measurement
Maria et al. (2003) that subtracted a scaled raw spectrum of      were normalized using the corresponding OA concentrations
a blank filter from sample spectra before baseline correction.    to eliminate signal variability due to changes in OA concen-
The blank subtraction algorithm allowed us to identify bands      tration. The correlation matrix of the normalized AMS mass
related to aromatics and PAHs at 690–900 cm−1 (Centrone           spectra (correlation of ion intensities at different m/z val-
et al., 2005), organonitrates (RONO2 ) at 850 cm−1 , alcohol      ues) shows that signals at several m/z values are correlated
CO stretching at 1050 cm−1 , levoglucosan bands at 860–           (Fig. S3). Thus, the dimensionality of the mass spectra can
1050 cm−1 , and inorganic sulfate and nitrate bands at 620        be reduced considerably without significant loss of informa-
and 1400 cm−1 , and it also allowed us to better quantify the     tion. Our data matrix, X, is a i × j matrix with i observations
carbonyl absorbances at around 1700 cm−1 .                        (2979 AMS measurements) and j variables (335 fragment
                                                                  ions) with a rank l (l ≤ min{i, j }). The columns of X are cen-
2.5.3   Quantifying organic functional groups                     tered to avoid intercepts in scores. The PCA calculation was
                                                                  performed by singular value decomposition of the centered
After baseline correction and blank subtraction, the multiple     data matrix (Abdi and Williams, 2010), X = P1QT , where
peak-fitting algorithm described by Takahama et al. (2013)        P is the i × j matrix of left singular vectors, Q is the j × l
and implemented by Reggente et al. (2019b), functioning           matrix of right singular vectors, known as loadings, and 1
based on nonlinear least squares analysis, was applied to the     is the diagonal matrix of singular values (12 is the diagonal
spectra to obtain major FG abundances of aCOH, COOH,              matrix of eigenvalues of covariance matrix, XT X). The i × l
aCH, and naCO (Yazdani et al., 2021a). The RONO2 group            matrix of factor scores, F, is obtained as F = P1.
abundances were not quantified due to the extensive over-
lap of its absorbances with other compounds and in order
to keep the MIR estimates consistent with those of AMS,           3     Results and discussions
for which only total (organic plus inorganic) nitrate was es-
timated. After estimating FG abundances, the O : C, H : C,        In this section, peak fitting is applied to MIR spectra to esti-
and OM : OC ratios were calculated with a few assumptions         mate major FG concentrations. Thereafter, relative FG abun-
about the number of carbon atoms attached to each FG (refer       dances are compared in different OAs to understand compo-
to Chhabra et al., 2011b; Russell, 2003; Maria et al., 2002).     sitional differences arising due to the aerosol source and age
The peak attributed to aromatics and PAHs was analyzed            (Sect. 3.1 and 3.3). In addition, the MIR spectra of primary
qualitatively due to the lack of calibration models. In addi-     and aged OAs are compared to those of the fuel sources for
tion to the common FG analysis, we used MIR fingerprint           identifying the chemical similarities between POA and fuel
features to identify relevant substances to biomass burning       sources and for better understanding the important oxidation

https://doi.org/10.5194/acp-21-10273-2021                                        Atmos. Chem. Phys., 21, 10273–10293, 2021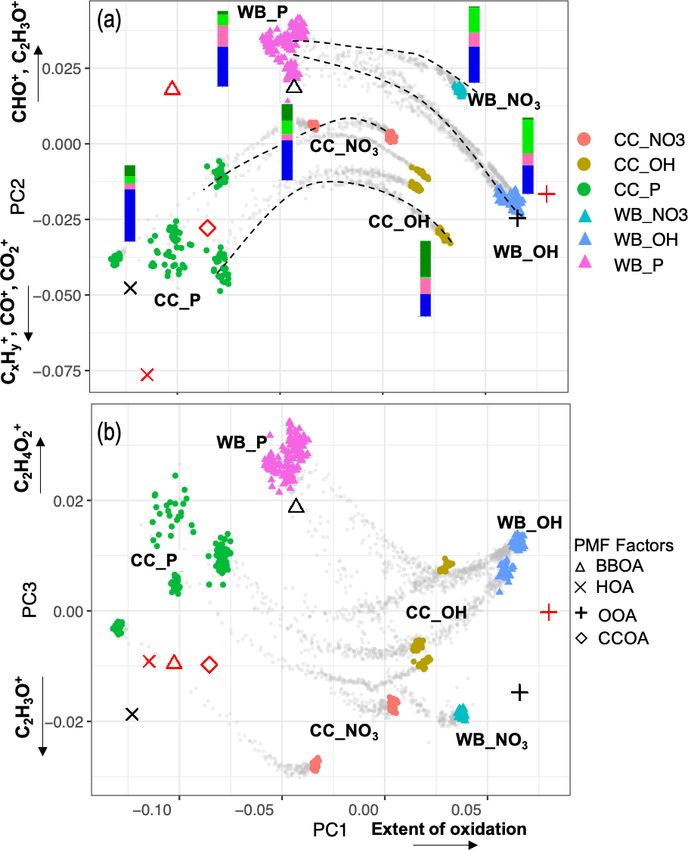
10278                                                       A. Yazdani et al.: Primary and aged wood and coal burning OA

pathways for SOA formation (Sect. 3.2 and 3.4). In Sect. 3.5,
AMS mass spectra are analyzed using PCA to understand
the factors driving the spectral variability and how they re-
late to FG composition. Finally, the MIR spectra of chamber
WB aerosols are compared to those of previously identified
atmospheric burning-influenced samples, and a new method
for identifying biomass burning aerosols using MIR spec-
troscopy is proposed (Sect. 3.6).

3.1   Wood burning – functional group composition

The primary WB aerosols have a high abundance of the
aCH group (Figs. 1a and S5a). This FG, which absorbs in
the 2800–3000 cm−1 region in the MIR spectrum (Fig. 2a),
constitutes around 50 % of the total mass of fresh WB OA
(Fig. 1a). The aCOH group, which appears as a broad peak
around 3400 cm−1 (Fig. 2a), has the second highest concen-
tration (around 30 % of the total mass; Fig. 1a). This FG is
also ubiquitous in hemicellulose, cellulose, and lignin – three
main components that constitute 20 wt %–40 wt %, 40 wt %–
60 wt %, and 10 wt %–25 wt % of lignocellulosic biomass,
respectively (McKendry, 2002). The COOH group, which
appears as a broad peak at 2400–3400 cm−1 and a sharp
carbonyl peak at approximately 1700 cm−1 (Fig. 2a), is the
third most abundant FG in fresh WB aerosols and constitutes
10 %–20 % of the OA mass (Figs. 1 and 2a). The primary
WB samples have OM : OC ratios ranging from 1.6 to 1.8
(Figs. 2b and S5b).
   AMS and MIR estimates of OA concentration are highly
correlated (R 2 = 0.92; refer to Yazdani et al., 2021a, for de-
tailed comparison) and show an almost 3-fold increase in OA
mass concentration with aging. The relative aCH abundance
decreases substantially (by up to 30 %) in WB aerosols with       Figure 1. (a) Bar plot of averaged MIR (separated by functional
aging (Figs. 1a and S5a). The relative decrease in the aCH        group) and AMS OA concentration estimates without wall-loss cor-
abundance is less prominent when aerosols are aged with           rection. The contribution of each functional group (with contribu-
the nitrate radical probably due to the fact that organoni-       tion > 5 %) to total OA, the type of aerosol (P: primary), emission
trates are excluded from quantitative analysis, thus the to-      source (WB and CC), and oxidant used for aging (OH: hydroxyl
tal OA concentration being underestimated, and also because       radical, NO3 : nitrate radical) are indicated for each category. (b) Bar
only a limited number of precursors react with the nitrate        plot of averaged MIR and AMS OM : OC estimates separated by the
                                                                  contribution of each functional group. The error bars show the max-
radical, leading to different SOA species. The aCH profile
                                                                  imum and minimum concentrations and OM : OC values for each
changes from the superposition of sharp peaks (observed for       category. For the estimates of each individual experiment refer to
long-chain hydrocarbons) in primary WB spectra to broad           Fig. S5.
peaks (observed in the spectra of oxygenated species) in aged
WB spectra (Fig. 2a; Yazdani et al., 2020). The aCOH rel-
ative abundance in WB aerosols also decreases with aging          naphthalene are among the most important SOA precursors,
(Fig. 1a). The relative abundance of COOH increases signifi-      based on their SOA yields, present in wood smoke reported
cantly in WB aerosols with aging, suggesting carboxylic acid      by Bruns et al. (2016) and Stefenelli et al. (2019). The high
formation to be the dominant VOC oxidation pathway for            abundance of COOH in the aged WB OA of this study is
biomass burning (Fig. 1). The aged WB samples with high           consistent with the considerable carboxylic acid formation
carboxylic acid concentration have a broad OH peak rang-          reported from these precursors (Chhabra et al., 2011a; Kautz-
ing from 2400 to 3400 cm−1 , and their carbonyl absorption        man et al., 2010; George et al., 2015). The aged WB samples
frequency is on the lower end of its range (approximately         have the highest OM : OC, ranging from 1.8 to 2.1 (Figs. 2b
1708 cm−1 compared to 1715 cm−1 for ketone carbonyl;              and S5b), with high concentrations of COOH.
Fig. 2a) due to the weakening of the C=O bond in dimer-
ized acids (Pavia et al., 2008). Phenol, methoxyphenols, and

Atmos. Chem. Phys., 21, 10273–10293, 2021                                           https://doi.org/10.5194/acp-21-10273-2021
A. Yazdani et al.: Primary and aged wood and coal burning OA                                                                       10279

Figure 2. The MIR spectra of primary and aged (with OH and NO3 ) wood burning (WB) and coal combustion (CC) OAs and their parent
compounds: lignin and bituminous coal. The dash-dotted line demonstrates the spectrum of solvent-extracted hardwood (HW) lignin (in KBr
pellets) taken from Boeriu et al. (2004). The dotted line shows the spectrum of pulverized bituminous coal taken from Zhang et al. (2015).

   MIR spectroscopy is able to distinguish between organic             results suggest aromatics and PAHs in WB aerosols consti-
and inorganic nitrates due to differences in their absorption          tute up to 8 % of total OAs. However, underestimation is pos-
frequencies (Day et al., 2010). In this work, we have investi-         sible due to the incomplete list of ion fragments considered
gated the variations in the RONO2 bands qualitatively by an-           in this work and fragmentation of oxygenated aromatics and
alyzing their absorbances at 1630, 1273, and 850 cm−1 (Day             PAHs during EI ionization (Supplement Sect. S5).
et al., 2010). These peaks are negligible in the MIR spectra
of primary WB aerosols. However, their absorbances (thus               3.2   Wood burning – primary signatures
the abundance of organonitrates) increase in the MIR spectra
of WB aerosols aged by both hydroxyl and nitrate radicals
                                                                       Using the MIR signatures of levoglucosan in primary WB
with much more prominent contributions when the nitrate
                                                                       aerosols (Sect. S6 and Fig. S10), it is estimated that 22 %–
radical is used (Fig. 2a). This suggests that the RONO2 for-
                                                                       48 % of the aCOH absorbance and 15 %–29 % of total OA
mation could be an important SOA formation pathway from
                                                                       mass is due to the presence of levoglucosan as a main product
WB emissions, which, nevertheless, we do not account for
                                                                       of high temperature pyrolysis of cellulose and an important
quantitatively. A relatively small peak at 1560 cm−1 is also
                                                                       biomass burning marker (Shen and Gu, 2009; Puxbaum et al.,
observed in WB aerosols aged by the nitrate radical, which
                                                                       2007; Hennigan et al., 2010). The reported range is consistent
can be attributed to nitroaromatics (Pavia et al., 2008). Weak
                                                                       with measurements by a thermal desorption aerosol gas chro-
signatures of aromatics or PAHs are visible at 690–900 cm−1
                                                                       matograph coupled to a HR-TOF AMS (TAG-AMS) TAG-
in the MIR spectra of both primary and aged WB aerosols.
                                                                       AMS obtained by Bertrand et al. (2018a). The abundance of
The absorption in this region appears as a single peak cen-
                                                                       the AMS m/z 60 fragment ion, related to levoglucosan frag-
tered around 754 cm−1 . The intensity of this peak is corre-
                                                                       mentation, (Schneider et al., 2006) and its MIR absorbances
lated (R 2 = 0.70) to the concentration of fragments in the
                                                                       (used for the first time in this work) are highly correlated
AMS mass spectra that were reported to be attributed to aro-
                                                                       (R 2 = 0.76; Fig. S11), both showing a consistent decrease in
matics (Bruns et al., 2015; Pavia et al., 2008) (Fig. S9). AMS
                                                                       levoglucosan absolute concentration with aging regardless of

https://doi.org/10.5194/acp-21-10273-2021                                             Atmos. Chem. Phys., 21, 10273–10293, 2021
10280 A. Yazdani et al.: Primary and aged wood and coal burning OA
the type of oxidant (Fig. S11). The contribution of levoglu- when the hydroxyl radical is used as oxidant, despite an al-
cosan to total OA mass is estimated to decrease to less than most 3-fold increase in the OA mass concentration (without
5 % after aging. This is consistent with the significant en- wall-loss correction; Figs. 1a and S5a). On the other hand,
hancement in OA mass with SOA formation and the degra- the abundance of the naCO carbonyl group increases by up
dation of levoglucosan through its reaction with OH and its to 40 %, suggesting that carbonyl production is the dominant
loss to the chamber walls (Bertrand et al., 2018b; Hennigan oxidation pathway for VOCs of CC emissions predominantly
et al., 2010; Zhao et al., 2014). when the hydroxyl radical is used (Fig. 1a). This observa-
The MIR spectra of hard wood lignin and fresh WB tion is consistent with the high carbonyl abundance in SOA
aerosols are very similar, suggesting the presence of sim- formed from the OH oxidation of alkane precursors, which
ilar molecular structures between the primary WB aerosol are abundant in CC VOCs, at close OH exposures to those
composition and its parent compound, lignin (Fig. 2a). One in this work (Lambe et al., 2012; Lim and Ziemann, 2009).
specific aspect of this similarity is the high absorbances of This does not, however, preclude the contribution of oxida-
the aCOH group in both samples. By comparing the MIR tion products of aromatic compounds, which are also abun-
spectra of fresh WB aerosols with that of lignin (Supplement dant in CC VOCs (Liu et al., 2017; Klein et al., 2018), in aged
Sect. S7), it can be inferred that the sharp peak at 1515 cm−1 CC OA. The absence of the broad carboxylic acid OH peak
and a part of the broader peak at 1600 cm−1 are attributed for these samples and the peak location of the carbonyl group
to aromatic rings in lignin structure (Hergert, 1960; Yang (1715 cm−1 ) in their MIR spectra (Fig. 2b) suggest that the
et al., 2007; Derkacheva and Sukhov, 2008) observed also majority of the carbonyl group in the OH-aged CC aerosols
in the spectrum of lignin monomers such as coniferyl al- is ketone (Pavia et al., 2008). An increase in the aCOH abun-
cohol (Bock and Gierlinger, 2019) and pyrolysis products dance is also observed in the CC aerosols with aging. This
of lignin with the same substitution pattern (Duarte et al., increase is more remarkable than that in the WB aerosols
2007; Simoneit et al., 1993). The peak at 1515 cm−1 , how- (Fig. 1).
ever, diminishes with aging, implying a change in aromatic The RONO2 signature becomes clearly visible in aged CC
ring substitution or ring opening by oxidant attack. The peak aerosols when the nitrate radial is used as oxidant (Fig. 2b)
around 1600 cm−1 is suppressed by the RONO2 peak around or when the hydroxyl radical is used in the presence of NOx
1630 cm−1 after aging. Overall, our analysis shows that the (> 50 ppb). This observation is consistent with VOC oxida-
large majority of the primary OA from WB emissions is com- tion pathways proposed by Kroll and Seinfeld (2008) and
posed of anhydrous sugars and lignin pyrolysis products. measured by Ayres et al. (2015). In addition, a new peak at
1350 cm−1 that can be attributed to the S=O group in sul-
3.3 Coal combustion – functional group composition fonates (Pavia et al., 2008) appears in some aged CC aerosols
(Fig. 2b).
Peak fitting analysis suggests that the aCH group from all The aromatic CH out-of-plane (OOP) absorption appears
compounds containing this FG (alkanes and other com- as a relatively stronger peak at 754 cm−1 compared to WB
pounds) constitutes around 60 wt %–80 wt % of primary CC aerosols in the spectra of CC aerosols and bituminous coal
OA – a larger fraction compared to fresh WB OA (Figs. 1b (Fig. 2b; Sobkowiak and Painter, 1992, 1995). The normal-
and S5b). An abundance of short and long-chain alkanes has ized CH OOP absorbances by total OA mass are, on average,
also been reported in VOC emissions of bituminous coal (Liu higher for CC aerosols compared WB, suggesting a higher
et al., 2017; Klein et al., 2018). The naCO group is the second contribution of this FG. The concentration of AMS fragment
most abundant FG in the fresh CC OA, constituting, on aver- ions corresponding to PAHs suggest that aromatics and PAHs
age, 15 % of its mass (Fig. 1a), much higher than its contri- of CC aerosols account for up to 7 % of total OA mass, al-
bution to WB emissions. This functional group has been re- though some underestimation is possible due to the limited
ported to constitute 5 wt %–15 wt % of bituminous coal VOC number of fragment ions considered and the fragmentation
emissions (Liu et al., 2017; Klein et al., 2018). The concen- of oxygenated aromatics and PAHs upon ionization (Supple-
tration of the COOH group is usually low in the primary CC ment Sect. S5). These measurements suggest lower concen-
aerosols (around 10 %; Fig. 1a). The primary CC aerosols trations of aromatic compounds in CC OA compared to CC
are estimated to have the lowest OM : OC ratios (1.35–1.5) VOC emissions measured by Liu et al. (2017) and Klein et al.
among all samples, which is justified by their strong aCH (2018).
absorbances (Fig. 2b). Inorganics (ammonium, sulfate, and The aged CC aerosols have slightly lower OM : OC ratios
nitrate) have prominent absorbances in the MIR spectra of compared to the aged WB aerosols (Fig. 1b). For both emis-
fresh (and aged) CC aerosols, which have not been observed sion sources, aerosols aged with the hydroxyl radial have
in the case of WB aerosols. The high abundance of inor- higher OM : OC ratios (approximately 0.2) than those aged
ganic salts can be attributed to the sulfur and nitrogen that with the nitrate radical (Fig. 1b). This can be attributed to the
are present in bituminous coal (Vasireddy et al., 2011). different rate constants of VOC reactions with nitrate and hy-
In the aged CC aerosols, the relative abundance of the aCH droxyl radicals (Ziemann and Atkinson, 2012). Furthermore,
group decreases drastically (on average 40 %), especially organonitrates, which are abundant when aerosols are aged
Atmos. Chem. Phys., 21, 10273–10293, 2021 https://doi.org/10.5194/acp-21-10273-2021A. Yazdani et al.: Primary and aged wood and coal burning OA 10281
with the nitrate radical, are not considered either in AMS OA Table 1. Importance of the first three principal components.
estimates or in MIR peak fitting. This exclusion causes the
underprediction of both the OM : OC ratio and OA concen- PC1 PC2 PC3
tration estimates when the nitrate radical is used. Standard deviation 0.046 0.019 0.01461
Proportion of variance 0.715 0.120 0.071
3.4 Coal combustion – primary signatures Cumulative proportion 0.715 0.835 0.907
Bituminous coal contains 69 wt %–86 wt % carbon, and its
chemical structure is formed by highly substituted rings
that are connected by alkyl or ether bridges (oxygen or its highest values at a few ion fragments: C2 H3 O+ , CO+ ,
sulfur) (Vasireddy et al., 2011). The MIR spectra of pri- CO2 + , CHO+ , C2 H3 + , C3 H3 + , and C3 H5 + . The loadings,
mary CC aerosols have weaker aromatic C=C absorbances which are informative about the most important variations
at 1610 cm−1 than bituminous coal (Fig. 2b). This peak is in the mass spectra, have also high values at a few mass
suppressed by the RONO2 peak at 1630 cm−1 with aging fragments, making their interpretation simple. The first PC,
(Fig. 2b). The carbonyl peak (1710 cm−1 ) observed in the which explains around 72 % of the variance alone, has high
spectra of the primary CC aerosols is absent in that of bitu- positive loadings of CO2 + and CO+ , CHO+ , and C2 H3 O+
minous coal (Fig. 2b), suggesting carbonyl formation during fragment ions (Fig. 3). The CO2 + fragment has been previ-
coal combustion. Zhang et al. (2015) also reported a similar ously ascribed to mono- and dicarboxylic acids (Canagaratna
carbonyl generation for coal oxidation at high temperatures. et al., 2007; Faber et al., 2017; Russell et al., 2009a; Frossard
We also observe that the aCH peaks are considerably sharper et al., 2014). The CO+ fragment is estimated directly from
in the spectra of fresh CC aerosols than the pulverized coal CO2 + (Aiken et al., 2008), and the other mentioned ion
(Fig. 2b), suggesting a higher relative contribution of this FG fragments represent other oxygenated species (Faber et al.,
in primary CC OA than in bituminous coal. 2017; Chhabra et al., 2011a). The high loadings of major
The analyses of Sect. 3.1–3.4 suggest that aerosol source oxygenated ion fragments and the empirical observation that
(WB and CC) and type (primary and aged with different primary and aged samples are separated along the PC1 axis
oxidants) are both drivers of variability in the MIR spec- (Fig. 4) suggest that the first PC indicates the general direc-
tra. These changes are substantially higher than uncertainties tion of aging and the extent of oxidation, which appear to be
associated with OA mass concentrations derived based on the major sources of variation in the data (based on the high
FTIR and AMS. Furthermore, we found that aged aerosols explained variance by PC1). As can be seen from Fig. 4, PC1
of WB and CC have distinguishable functional group com- scores are the lowest for primary CC and WB aerosols and in-
positions, suggesting that MIR spectra retain source class in- crease with aging for both WB and CC samples. The higher
formation at least up to the studied levels of aging. oxidation state of aged WB aerosols compared to aged CC
(i.e., higher PC1 score) aerosols is consistent with the high
3.5 Comparison between AMS mass spectra and FG abundance of COOH and naCO FGs in the aged WB and
composition of OA CC aerosols, respectively. The WB and CC samples that are
aged with the hydroxyl radical have higher PC1 scores than
In this section, we investigate the main differences in bulk those aged with the nitrate radical, indicating the former are
chemical composition of the primary and aged emissions more oxidized. The order of PC1 scores across the samples is
measured by the AMS and their FG content. We applied PCA reminiscent of the order of OM : OC ratios discussed earlier.
to the AMS mass spectra to facilitate their interpretation and The second PC, which explains about 12 % of the variance,
to better understand the major sources of variability in the mainly contrasts primary WB (with high abundance of lev-
spectra and their connection with the FG composition of OA. oglucosan and lignin) with primary CC (with high abundance
Moreover, we projected AMS PMF (positive matrix factor- of aCH) aerosols by high positive loadings of C2 H4 O2 + ,
ization) factors obtained by Elser et al. (2016) and Aiken representing levoglucosan fragmentation (Schneider et al.,
et al. (2009) (High Resolution AMS Spectral Database: http: 2006), and C8 H9 O2 + (Fig. S6), representing lignin fragmen-
//cires.colorado.edu/jimenez-group/HRAMSsd/, last access: tation (Tolbert and Ragauskas, 2017; Saito et al., 2005), and
20 April 2020) onto the PC space to compare and contrast negative loadings of Cx Hy + fragments, attributed to the aCH
the AMS spectra obtained from the chamber experiments group (Faber et al., 2017). In addition, this PC has high pos-
with AMS PMF factors of atmospheric samples. By apply- itive loadings of C2 H3 O+ , CHO+ mass fragments, and high
ing PCA, the dimensionality of the normalized AMS mass negative loadings CO+ and CO2 + (Fig. 3), differentiating be-
spectra was reduced from 330 fragment ions to 3 PCs while tween the COOH group and other oxygenated FGs such as
explaining around 91 % of the variance in the mass spectra aCOH (Faber et al., 2017). The primary CC aerosols have the
(Table 1). lowest PC2 scores due to high aCH content. Their PC2 scores
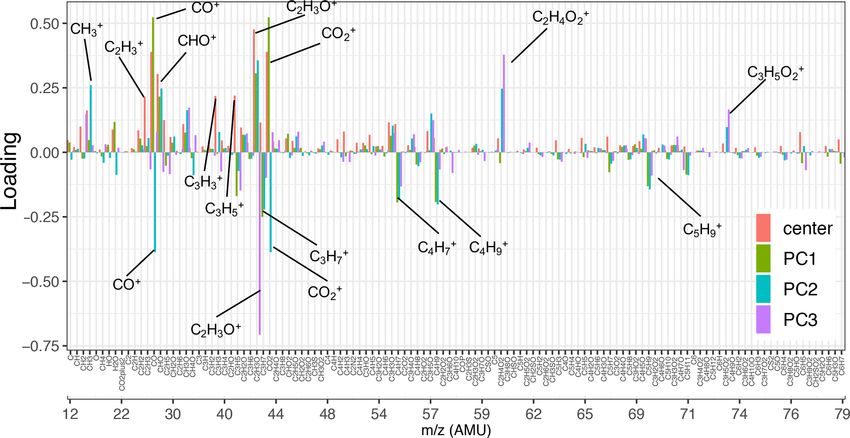
As can be seen from Fig. 3, the mean (center) mass spec- increase with aging (Fig. 4a), indicating production of CHO+
trum, which represents the average of all mass spectra, has and C2 H3 O+ fragments (non-acid oxygenated FGs, such as
https://doi.org/10.5194/acp-21-10273-2021 Atmos. Chem. Phys., 21, 10273–10293, 202110282 A. Yazdani et al.: Primary and aged wood and coal burning OA Figure 3. Loadings of the first three principal components and the normalized mean AMS mass spectrum (shown up to m/z 80). Fragment ions with high positive/negative loadings are indicated by their formula. Refer to Fig. S6 for the heavier fragments. the naCO and the aCOH groups) and decrease slightly before OOA; not in the range of Fig. 4). The location of the samples the end of aging probably due to the production of CO2 + (the in the f44 –f43 plot (far from the triangle vertex; Fig. 5) also COOH group) outweighing other oxygenated fragments. On suggests a moderate extent of oxidation for the aged WB and the other hand, the primary WB aerosols have the highest CC samples. PC2 scores (Fig. 4a) due to the high abundance of aCOH, The third PC, which explains 7 % of the variance, mainly levoglucosan, and lignin. The PC2 scores reduce drastically separates the aged aerosols based on the type of oxidant used with aging for WB aerosols, especially when the hydroxyl and has high negative loading of C2 H3 O+ and positive load- radical is used, suggesting the formation of the COOH group ings of the C2 H4 O2 + and C3 H5 O2 + fragments (Fig. 3). PC3 and degradation of levoglucosan and lignin (Fig. 4a). PC2 scores have the highest values for the primary WB aerosols scores are higher for WB and CC samples aged with the ni- due to the abundance of levoglucosan and decrease with ag- trate radical compared to those aged with the hydroxyl rad- ing (Fig. 4b) due to the degradation of levoglucosan and the ical (Fig. 4a) due to the lower concentration of the CO2 + generation of the C2 H3 O+ fragment (Fig. 5). PC3 scores are fragment ion (Figs. 5 and S7). lower for the primary CC aerosols due to the absence of lev- The first two principal components, which together ex- oglucosan and decrease further with aging due to the genera- plain 84 % of total variance, are able to separate aerosols tion of the C2 H3 O+ fragment. For both sources, the aerosols according to their oxidation state (PC1) and their source aged with the nitrate radical have considerably lower PC3 (PC2) and show that the trajectories of CC and WB OA scores (Fig. 4b) due to the high relative abundance of the start to converge, especially when aged with the hydroxyl C2 H3 O+ fragment (Figs. 5 and S7). The aged CC aerosols radical (Fig. 4a). This observation implies that the spec- with a high abundance of naCO also have relatively low PC3 tral differences between samples of the same or different scores (Fig. S8b), suggesting a higher C2 H3 O+ concentra- categories decrease with aging despite the higher oxidation tion for those samples (also observed from Fig. 5). This ob- state (contribution to PC1) of the aged WB compared to servation suggests that the species formed during aging with the aged CC aerosols. The primary WB aerosols on PC1– the nitrate radical and the naCO group produce higher con- PC2 biplot (Fig. 4a) are located close to biomass burning centrations of the C2 H3 O+ fragment. OA (BBOA), factors obtained by Aiken et al. (2009) and The PCA analysis shows that both aerosol source (WB and Elser et al. (2016), highlighting their chemical similarity. CC) and type (primary and aged with different oxidants) are The same is observed for CC aerosols with coal combustion responsible for variability in the AMS mass spectra (simi- OA (CCOA) and hydrocarbon-like OA (HOA) factors. The lar to the MIR spectra). We also found that the primary WB OH-aged aerosols are, however, more similar to the semi- and CC aerosols have similar mass spectra to the BBOA and volatile oxygenated OA (SV-OOA) factor, representing less HOA factors, respectively, and OH-aged OAs of both sources oxygenated OA (Fig. 4a), and have considerably lower PC1 are similar to the SV-OOA factor. Furthermore, the spectral compared to the aged OA (OOA) factor by Aiken et al. variations are consistent with our functional group analysis (2009), which represents aged SOA (i.e., more aged than SV- via FTIR, suggesting that the AMS mass spectra maintain Atmos. Chem. Phys., 21, 10273–10293, 2021 https://doi.org/10.5194/acp-21-10273-2021
A. Yazdani et al.: Primary and aged wood and coal burning OA 10283
spectra of atmospheric samples affected by burning and other
sources. Although the nitrate radical exposures in the cham-
ber experiments were comparable to those of atmospheric
samples, no comparable RONO2 bands were observed in am-
bient samples. This observation implies that organonitrates
potentially degrade later in the sequence of reactions due to
thermal decomposition (Barnes et al., 1990; Kroll and Sein-
feld, 2008) or due to hydrolysis in the particle phase (Day
et al., 2010; Ng et al., 2017; Liu et al., 2012). As a result,
the chamber WB aerosols aged with the nitrate radical were
excluded from this comparison due to their very prominent
RONO2 bands.
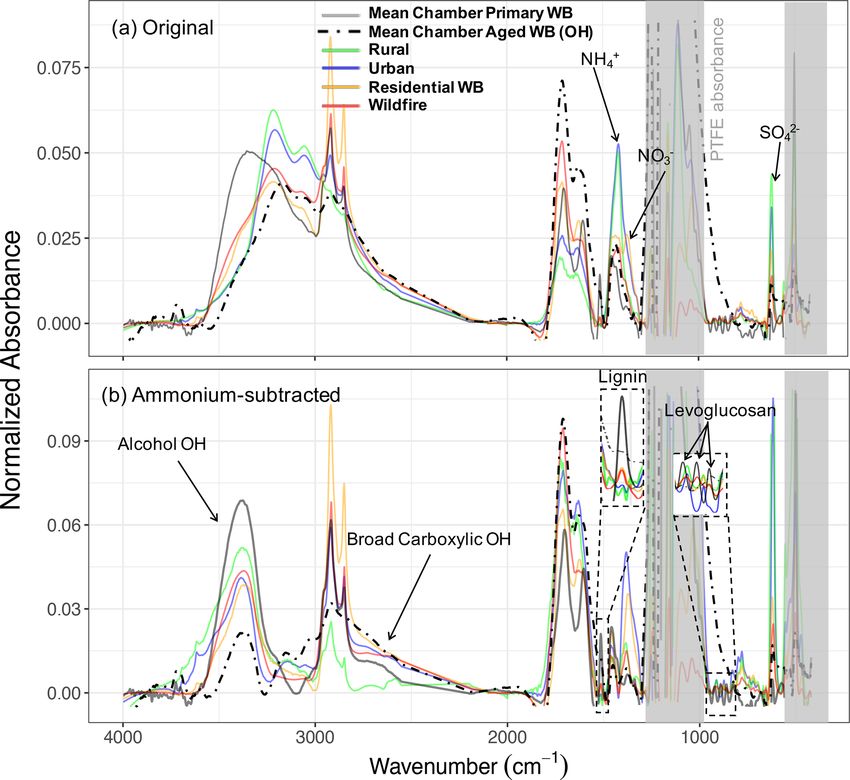
3.6.1 Mean spectra
The atmospheric samples were divided into four subgroups:
urban, rural, residential wood burning, and wildfire as de-
scribed in Sect. 2.4. The individual spectra were baseline-
corrected and blank-subtracted and then were normalized
(Euclidean norm) based on their absorbances in the 1300–
4000 cm−1 range. This procedure allowed us to make the
spectra with different absorbance magnitudes (i.e., different
aerosol mass concentrations) comparable. Thereafter, a sin-
gle mean spectrum was calculated for each subgroup and
used as its average representation. These spectra were com-
Figure 4. Biplots of PC2–PC1 (a), and PC3–PC1 (b) scores. The pared to those of fresh and aged WB OAs in the cham-
AMS measurements corresponding to filter sampling periods are ber. Since major inorganic compounds of fine aerosols (am-
color-coded by category. The AMS measurements out of filter sam- monium, sulfate, and nitrate) are also IR-active and their
pling periods are illustrated by gray dots and some oxidation trajec- absorbances overlap with those of organic FGs (especially
tories are indicated by dashed curves. AMS BBOA, CCOA, HOA, aCOH), the analysis of organic FGs in ambient samples is
and SV-OOA factors from Elser et al. (2016) (red) Aiken et al. not always straightforward. To mitigate this problem, ammo-
(2009) (black) are projected onto PCs for comparison. Average FG nium absorbances were subtracted from the mean spectra to
composition for each category estimated from the MIR spectra is obtain the pure contribution of organic compounds.
shown beside the category with the same color scheme as Fig. 1.
As can be seen from Fig. 6a, the mean spectrum of ru-
ral samples has strong absorptions in the ammonium (dou-
blets at 3200 and 3050 cm−1 ), nitrate (1400 cm−1 ), and sul-
some functional group and source class information even af- fate (620 cm−1 ) regions, while the peaks attributed to organic
ter aging and in spite of the extensive fragmentation (dis- compounds are relatively weak (e.g., very weak aCH and car-
cussed further by Yazdani et al., 2021a). However, even at bonyl CO peaks and indistinguishable aCOH absorption due
the moderate levels of aging of this work, a part of this in- to strong inorganic absorptions; Fig. 6a). The urban mean
formation only exists in higher PCs, which explain the lower spectrum also has strong ammonium and sulfate absorptions,
variance in the data (e.g., PC2 explains 12 % of the variance suggesting the abundance of inorganic compounds in urban
across source classes and oxidative aging studied in this work sites. The organic signatures in the urban spectrum, how-
and distinguishes OH-aged CC and NO3 -aged WB). These ever, are slightly stronger than those of rural sites with the
findings are consistent with past reports suggesting that AMS clear presence of broad carboxylic acid absorption (Fig. 6b).
is most sensitive to aging (Jimenez et al., 2009) and under- Neither rural nor urban mean spectra are similar to those of
scores the challenges in identifying source classes in highly chamber WB spectra.
aged atmospheric OA using AMS. The mean spectrum of residential wood burning samples
has prominent absorptions of ammonium, sulfate, and also
3.6 Atmospheric biomass-burning-influenced aerosols nitrate. Cold weather and high concentrations of nitric acid
resulting from fossil fuel combustion and biomass burning
One of the main purposes of chamber experiments is under- are believed to be the primary reasons for the presence of
standing the characteristics of biomass burning aerosols in ammonium nitrate on the filters in spite of being relatively
the atmosphere. We present a simplified comparison of the volatile (Chow et al., 2005; Seinfeld and Pandis, 2016). This
MIR spectra of WB aerosols in the chamber with the mean spectrum has considerably stronger signatures of organic
https://doi.org/10.5194/acp-21-10273-2021 Atmos. Chem. Phys., 21, 10273–10293, 202110284 A. Yazdani et al.: Primary and aged wood and coal burning OA Figure 5. Scatter plots of f44 (fCO2 + ) against f43 (fC2 H3 O+ ), f57 (fC4 H9 + ), f60 (fC2 H4 O2 + ), and f29 (fCHO+ ). Dashed lines show the outline of the triangle (Ng et al., 2010), and the black shapes show the location of PMF factors (Elser et al., 2016; Aiken et al., 2009; Ulbrich et al., 2009). Average FG composition for each category estimated from the MIR spectra are shown beside the category. Figure 4 legend is applicable here. compounds (Fig. 6b). Very sharp aCH peaks, strong acid relative abundance of aCOH is significantly higher in WB COOH absorptions, and a visible aCOH absorption on the aerosol, indicating the residential wood burning samples are left shoulder of the ammonium peak can be seen in the mean aged to some degree. spectrum of residential wood burning. Comparing this spec- In addition to FG identification, we can discuss the pres- trum with that of aged WB in the chamber reveals their strik- ence of specific marker compounds. A weak signature of ing similarities. Both spectra have close inorganic-to-organic lignin C=C (at 1515 cm−1 ) can be observed in the mean ratios that result in similar profiles in Fig. 6a. In addition, spectrum of residential wood burning (Fig. 6a). In addition, both spectra have visible alcohol and acid signatures, which weak levoglucosan absorbances are visible in some residen- are identified to be important in biomass burning aerosol tial spectra. Both mentioned signatures in burning-influenced composition (Corrigan et al., 2013b; Takahama et al., 2011; atmospheric samples are stronger than that of aged cham- Russell et al., 2011; Hawkins and Russell, 2010). Neverthe- ber WB and weaker than that of fresh chamber WB aerosols, less, the aCH absorption in the mean spectrum of residen- suggesting that most of these atmospheric samples have, on tial wood burning is stronger than that in the mean spectrum average, experienced aging within the range explored by our of aged WB in the chamber. This observation might be at- chamber experiments. tributed to the long-chain hydrocarbons existing in the cuti- The mean spectrum of wildfire samples is also very simi- cle wax of vegetation detritus that is absent in these chamber lar to that of residential wood burning except having slightly WB experiments (Hawkins and Russell, 2010). The spectral weaker aCH absorbances. Consequently, the strong COOH comparison of residential wood burning aerosols and fresh absorption and the visible lignin and levoglucosan signa- WB aerosols in the chamber shows that fresh WB lacks inor- tures are also the characteristics of the wildfire mean spec- ganics compared to residential wood burning. Moreover, the trum as they were for that of residential wood burning. The Atmos. Chem. Phys., 21, 10273–10293, 2021 https://doi.org/10.5194/acp-21-10273-2021
You can also read