Cheap flights to smaller cities: good news for local tourism? Evidence from Italy
←
→
Page content transcription
If your browser does not render page correctly, please read the page content below
Cheap flights to smaller cities: good news for local
           tourism? Evidence from Italy
        Andrea Alivernini∗, Alessio D’Ignazio†, Andrea Migliardi                  ‡

                             Bank of Italy

                                     August 2012

                                       Abstract
          In this paper we focus on the impact of low cost carriers on tourism.
      With respect to the previous literature our paper has the advantage
      of using a very rich dataset, including territorially disaggregated data
      on tourism expenditure. To ensure greater consistency we employ an
      instrumental variable estimator. Our results indicate that proximity to
      a low cost operating airport, measured in terms of travel time, exerts
      a positive effect on tourism receipts.

 JEL classification: R11, R40, L83
 Keywords: lowcost carriers, tourism receipts, urban growth

     We wish to thank Marco Alderighi, Luigi Benfratello, Enrico Beretta, Angela
Bergantino, Luigi Cannari, Massimo Gallo, Vincenzo Mariani, Andrea Neri, Claudio Piga
and Valerio Trombetta for their valuable comments and suggestions. The usual disclaimer
applies. The views expressed herein are those of the authors and do not necessarily reflect
those of the Bank of Italy.
   ∗
     Research Department, Bank of Italy, Via Nazionale 91, 00184 Roma, Italy. Email
address: andrea.alivernini@bancaditalia.it.
   †
     Research Department, Bank of Italy, Via Nazionale 91, 00184 Roma. Email address:
alessio.dignazio@bancaditalia.it.
   ‡
     Research Department, Bank of Italy, Branch of Genoa. Email address: an-
drea.migliardi@bancaditalia.it.
1 Introduction
From the late 1990s onwards, with the liberalization of civil aviation in Eu-
rope, the air transport market experienced a sharp increase in competition.
In 1997, following the introduction of full cabotage rights, Ryanair launched
its first international routes; since then, the low cost airline industry has
experienced unprecedented growth. According to Eurocontrol and ELFAA,
the market share of low cost carriers (LCCs) in Europe increased from 4 per
cent in 1998 to 38 per cent in 2010; ENAC-KPMG (2011) estimates a 18
per cent annual growth rate in the offered seats for LCCs in Europe over
the period 2004-2009, compared with zero growth for traditional airlines.
With the incumbent full service carriers (FSCs) crowding the available
(and costly) slots at the main hubs in the late 1990a, entrant low cost
carriers were forced to turn to cheaper secondary (local) airports; hence,
LCCs developed a new model of airline connectivity, based on point-to-point
routes rather than the hub-and-spoke network, characterizing the FSCs. By
targeting secondary airports, often far away from the main hubs, in many
cases the growth of LCCs in the 2000s provided powerful opportunities for
local development.
Airline routes affect the local economy through different channels. By
facilitating face-to-face contacts they enhance agglomeration, thus exerting
a positive influence (Glaeser, Kallal, Scheinkman and Shleifer (1992), Rosen-
thal and Strange (2001), Percoco (2010)). A second potentially significant
effect is linked to the improved accessibility of the territory following the
opening of a new route, leading, for instance, to an increase in the oppor-
tunities for new and incumbent firms (Brueckner (2003)), in the value of
real estate and to better opportunities for labour migration. A third chan-
nel concerns the impact of the airport related industry (i.e. handling, cargo,
aircraft manufacturers), on airports’ productivity (Bottasso, Conti and Piga
(2011)) and exports (Alderighi and Gaggero (2012)). Perhaps, however, the
most significant effect is the impact on tourism (Bieger and Wittmer (2006)).
On the other hand, there are also negative effects following the launch of a
new route, such as pollution, noise, aviacide and travel congestion (Williams
and Bal (2009), Campisi, Costa and Mancuso (2010)).
In this paper we focus on the impact of LCCs on tourism, also in the
light of the role that tourism plays in local development (OECD, European
Union). On a priori grounds, the theory does not provide clear guidance on
the impact of LCCs on tourism. On the one hand, LCCs are expected to
exert a positive impact on tourism demand by making flights more affordable
and by linking previously “disconnected” niche tourism markets to larger
cities. On the other hand, the availability of cheap flights could crowd out
other transport modes. Moreover, new cheap airline routes would be unlikely
to generate additional demand if the adjacent territories were unattractive.
Ultimately, the quantification of the net impact of LCCs on tourism
2is an empirical question. Despite the importance of the subject, however,
the research evidence is scarce and mainly anecdotal. With respect to the
previous literature our paper has the advantage of using a very rich dataset,
including territorially disaggregated data on international tourism receipts,
as well as an estimation method to ensure greater consistency.
We address the relationship between LCCs’ operativity and tourism ex-
penditure by exploiting a unique dataset on tourism expenditure in Italy. To
capture the local nature of the point-to-point air travel connection model,
we use province (NUTS3) level data on international tourism expenditure in
Italy, from 1998 to 2010, drawn from the Bank of Italy’s survey on tourism1 .
We integrate this dataset with the map of LCCs across all Italian airports
starting from 1998. Finally, we exploit geo-coding tools and Google street
maps to build a distance matrix between province chief towns and the full
set of airports, defined both in kilometre length and travel time (where the
latter also takes into account the characteristics of the streets connecting
the two points). Other data sources are provided by Istat and Enac (the
Italian civil aviation authority).
The use of highly disaggregated data on tourism receipts is one of the
distinguishing characteristics of this paper. To date, several papers have
dealt with the impact of the introduction of low cost flights on a number
of economic and tourism variables (in particular the number of tourists and
nights spent), but they have never focused on their impact on monetary
flows generated by low cost tourists, either at aggregate or disaggregate
level. Our work sheds light on the potential growth of a territory (measured
by the increase of receipts from international tourism demand) following the
introduction of low cost flights.
The identification of the net effects of LCCs is challenging, due to the
reverse causality issue: while airline routes could positively affect tourism,
growing tourism potential could also affect the strategic choices of the car-
riers. We reach a consistent estimate of the effect of LCCs via instrumental
variables. Our results indicate that proximity to a low-cost operating air-
port, measured in terms of travel time, has a positive effect on tourism
expenditure.
1
The sample survey on Italy’s international tourism has been conducted by the Bank
of Italy on a continuous basis since 1996. The survey consists in questioning a sample
of inbound and outbound travellers, who are approached and stopped at the borders. In
particular, the survey involves: around 150,000 annual face-to-face interviews to collect
information on travellers’ expenditure and on a set of detailed data regarding travellers’
characteristics and behaviour, and about 1,500,000 counting operations for disaggregating
the number of travellers - drawn from administrative sources - by country of residence.
The main aim is to assess the international expenditure of travellers, in order to compile
the “Travel” item of the country’s balance of payments (BOP), in compliance with the
standards of the 5th Balance of Payment Manual (BPM5) of the IMF. Moreover, the IIT
collects data on the number of travellers and nights spent.
32 Local development, tourism and the impact of
LCCs
Tourism is often listed as one of the key drivers of regional development
by both international institutions (OECD (2011), European Commission
(2010), European Parliament (2007)) and research papers (Graham, Pap-
atheodorou and Forsyth (2007)). In particular, Graham et al. (2007) claim
that the overall impact of additional inbound tourism on a regional econ-
omy is about 10 per cent of its expenditure. The EU introduced a number of
initiatives supporting tourism under the Structural Funds Programmes. In
Europe, the tourism industry generates more than 5 per cent of GDP (more
than 10 per cent if the related sectors are also considered), and continues
to show a positive trend; the World Tourism Organization estimates that
after the fall of -4.9 per cent registered in 2009, international tourist arrivals
to Europe rebounded by 2.9 per cent in 2010 and 5.8 per cent in 2011 (the
UNWTO World Tourism Barometer). The forecasts are for growth in 2012
as well.
In Italy tourism consumption (both international and domestic) repre-
sents about 5 per cent of GDP (Alivernini (2012))2 ; international tourism
receipts in Italy decreased at constant prices over the period 2000-2010 and
Italy’s tourism market share declined at an even faster pace. The same trend
was observed for the number of nights spent, affected by the decrease of the
average duration of international trips worldwide.
While tourism is an effective means of boosting growth in the local econ-
omy, it is not an easy tool to calibrate since it is affected by several factors
simultaneously, some of which can be considered fixed in the short to medium
term. Tourism depends, amongst others things, on the attractiveness of the
territory, its economic development, the role played by both local and central
government in promoting it but also on physical accessibility. As regards ac-
cessibility, by triggering the development of LCCs, the liberalization of civil
aviation of the late 1990s brought powerful opportunities for tourism growth
in many cities. Indeed, by targeting secondary airports, often located far
away from the main hubs, the introduction of LCCs produced a shock in the
connectivity map of Europe. Within a few years a series of new (and much
cheaper) links were created, often involving cities which up to then had not
been easily reachable (for instance airports in Sardinia and in Sicily, such
as the one in Trapani). At present (ENAC (2012)), airlines operate interna-
tional flights in 46 Italian airports; more than half of them are concentrated
in the three major airports (Rome, Milan and Venice). LCCs generally op-
erate in smaller airports and their flights are concentrated in those relatively
2
The appropriate statistical tool for estimating the contribution of tourism to the
economy of a country is the Tourism Satellite Account (TSA), which has not yet been
developed for Italy (a prototype will be presented in June 2012).
4close to hubs; often LCCs’ airports were converted from military use since
planning new airports would be too expensive both from an economic and
time perspective.
There are at least two reasons why the launch of low cost flights should
affect tourism positively. First, by improving the affordability of interna-
tional flights LCCs might generate additional tourism demand (Wei and
Hansen (2006)); second, by operating towards minor airports, they could
also play a role in boosting niche tourism markets in smaller regions, such as
residential or second home tourism (Ribeiro de Almeida (2011), Bieger and
Wittmer (2006)). However, LCCs could crowd out other transport sectors
(i.e. full service airlines, railways, coaches, ferryboats) without generating
additional demand. Moreover, even if they generated additional visitors,
these could self select as “low cost”-type also when it comes to spending
money in the visiting country, thereby producing negligible additional ex-
penditure. Moreover, by targeting secondary airports, often far away from
the city, LCCs could in any event have little impact on tourism, if the des-
tination towns have few tourism attractions and are badly connected with
the main cities; in this case, LCCs could be more effective in shaping cross-
border job-commuting patterns.
The empirical evidence on the impact of LCCs on tourism is both scarce
and partial; it focuses on single-airports’ analysis, carried out as case studies
or assessed by means of time series data. Moreover, while claims of a positive
relationship predominate, the econometric analysis does not always take
into account potential reverse causality bias. Rey, Myro and Galera (2011)
find that the expansion of LCCs’ activity has positively affected tourism in
Spain. Ribero de Almeida (2011) focuses on the development of LCCs in the
Algarve region in Portugal over the period 1996-2010; in her case study she
finds that greater accessibility boosted the regional niche tourism markets.
Whyte (2007) uses Australian data on domestic tourism and claims that
LCCs have not generated additional demand but have largely crowded out
other travel modes. Pulina and Cortes-Jimenez (2010) focus on the Italian
airport of Alghero; by exploiting time-series data on tourists’ arrivals they
find a positive impact of LCCs on tourism demand.
With respect to the existing literature on the impact of LCCs on tourism,
our work has the advantage of using a more highly disaggregated dataset.
In particular, we use province (NUTS3) information, which allow us to get
a clearer picture of the local impact of LCCs. Moreover, while to date
papers have focused on the impact of low cost in terms of tourist numbers
and nights spent, we try to shed some light on the relationship between the
growth of a territory and the availability of low cost flights by looking at the
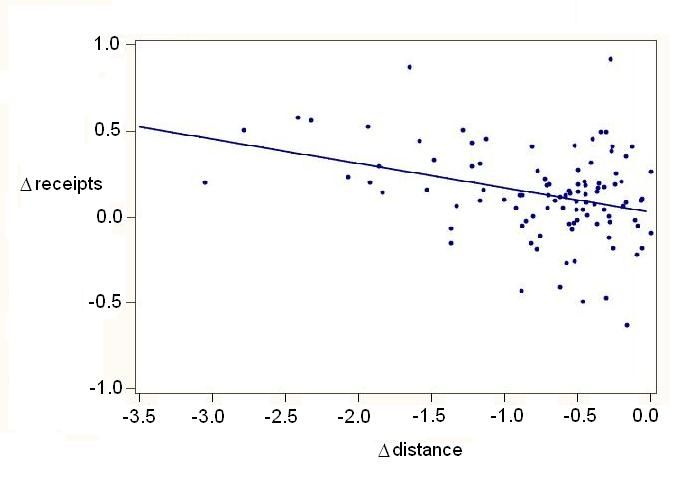
monetary flows of international tourism. Some preliminary insights about
research question can be drawn from figure 1, which displays the average
growth rate of international tourism receipts (NUTS3 level) and the average
fall-rate in the distance to the closest low-cost airport (we consider for each
5Figure 1: International tourism receipts and distance to low-cost operating airports
NUTS3 its capital city). The fitted line suggests that the distance could
play a positive role in shaping receipts. In the reminder of the paper we
investigate this preliminary finding using regression methods.
3 Data
The original database we used for the estimation draws on a number of ac-
curate sources. The dependent variable of the models is yearly expenditure
of foreign tourists in Italy at constant prices (henceforth tourism receipts or
tourism expenditure), disaggregated by Italian provinces (NUTS3) over the
years 1998-2010; the variable is drawn from the extensive survey on interna-
tional tourism carried out by the Bank of Italy. Tourism receipts are taken
at constant prices by deflating current values; for this, we used the defla-
tor of non-resident purchases in Italy (source: Istat, the Italian NSI, base
2005=100). Excursionists’ expenditure has been excluded from the total,
since it is mostly a local phenomenon concentrated in a few border provinces
in Northern Italy and it is mostly for shopping; in addition, excursionists
generally come to Italy through road border points, so the introduction of
low-fare flights should not be correlated with their expenditures.
The variable of interest of this paper is the distance of low cost airports
from province capital cities, obtained by means of geo-coding tools; distances
are calculated both by kilometre and travel time. Provincial time variant
characteristics include population and per capita income (at constant prices)
of the provinces. The former is drawn from the demographical database of
Istat, the latter from Istat’s Regional Statistics. The concept of ”low cost”
airport is crucial in our analysis. Since there are several airports where low
cost carriers and full service carriers operate, we consider as ”low cost”’ an
6airport in which the activity of LCCs can be deemed relevant. To this end,
it is important to assess the number of air connections and flights operated
in each Italian airport by LCCs and FSCs separately. The data are drawn
from the Official Airline Guide’s (OAG)3 very accurate and comprehensive
database. This provided us with the necessary information on the amount
of flights for each airport, disaggregated by operating airline, allowing us
to distinguish between flights operated by FSCs and LCCs for the whole
analysis period. Other data useful for devising the instrument are related
to some of their structural features: those on runway lengths and the size of
parking areas are drawn from Enac, those on the availability of an air traffic
control system from the Association for Private Transportation. Finally, we
perform a sample split exercise exploiting the infrastructures of the provinces
in terms of railways.
4 Empirical strategy and results
The aim of the paper is to assess the impact of LCCs operability on in-
ternational tourism expenditure across Italian provinces over the period
1998-2010. Formally, we estimate the effect through the following regres-
sion model
yit = α + β · distit + γ · Xit + δi + ηt + it (1)
where yit is the tourism expenditure in province i in year t; dist is the
distance (expressed in terms of travel time) between the province chief town
and the closest low cost operating airport; Xit is a vector of time-variant
characteristics of province i, such as per capita GDP; δi is a province fixed
effect; ηt is a year fixed effect.
If the choices of LCCs to launch new routes were completely random
conditional on observables, the parameter beta would consistently estimate
the impact of LCCs on tourism receipts. However, our variable of interest
is likely to be correlated with the error term, since provinces are heteroge-
neous across many aspects and some of their unobservable features could be
correlated with both tourism expenditure and LCCs operability. In order
to control for time-invariant heterogeneity across provinces, we estimate a
panel-FE model, exploiting the variability over time of the relevant variable.
Still, our estimates would suffer from at least two potential sources of
endogeneity. The first is that airports could have been selected by low cost
airline companies also in consideration of their tourism potential (reverse
causality). In this case, the OLS model would lead to an upward bias. A
second source of endogeneity would be the presence of time-variant omitted
variables (such as the role played by local authorities in promoting tourism),
causing a bias of our estimates in an undetermined direction.
3
We are indebted to KPMG and Pragma for making this database available to us.
7We overcome these endogeneity problems and reach identification through
an instrumental variable approach, where the source of exogeneity comes
from the physical features of Italian airports, measured at the end of the
1990s. While these features are certainly exogenous with respect to the
trend in tourism expenditure in the 2000s, they do play a part in the route
decisions taken by the LCCs in the 2000s. On the one hand, LCCs gen-
erally select secondary, smaller airports; on the other hand, they operate
through large aircrafts so the physical characteristics of the airport (namely
runway lengths and air traffic control systems) are, in addition to the size
of the airport, crucial in the choice of routes (Boeing, 2006; Enac, vari-
ous years). In particular, large aircrafts, such as Ryanair’s Boeing 737 and
EasyJet Airbus A319-A320, require at least 2000m runway for takeoff and
landing. Another condition for low cost carriers to operate is the presence
of air traffic control towers. This implies that we can estimate an exogenous
low cost operability-propensity for the whole set of Italian airports which
depends on their structural features only. We use the last available snapshot
of Italian airport LCCs operability (2010) and estimate the following cross
section model:
lcj2010 = α + β · runj1999 + γ · twrj1999 + δ · parkj1999 + (2)
where lc2010 is a dummy variable taking value one if the airport j operates as
low cost in 2010; run is a dummy taking value one if the length of the runway
is greater than 2000m; twr is a dummy taking value one if the airport has a
air traffic control tower; park is a categorical variable indicating the parking
area and it is included in the regression as a proxy for airports size. In order
to exclude those cases where the airport was enlarged during the observation
period precisely to host LCCs, we consider airports characteristics in 1999
(drawn from the Italian civil aviation authority’s report). The model is
estimated over a set of 49 airports. The results, reported in table 1, are
consistent with our prior expectations: while both runway and air traffic
control tower significantly and positively affect the probability of an airport
to become low-cost, such probability decreases in the size of the airport.
We then define, for each airport j, its low cost operability propensity
which depends on the airport structural features only as follows
lcprop
j b + βb · runj1999 + γ
=α b · twrj1999 + δb · parkj1999 (3)
This index turns out to be a very good predictor of the actual operativity-
type of the airport (low-cost vs full-service), leading to a correct prediction
for 84 per cent of the airports.
If our analysis were carried out at the airport level we could now use,
following Wooldridge (2002), this exogenous “treatment” propensity score
as an instrument for the probability of each airport to start operating as low
cost. However, since our analysis is carried out at the province level and our
8endogenous variable relates each city to several airports, we need to take a
step further in order to find our instrument. In particular, we follow the
methodology suggested by Duflo and Pande (2007)4 Saiz (2007), who use
predicted values as instrument for actual values.
The “structural” low cost propensity values lcprop
j and its power of order
two were then interacted with year dummies and used in a panel regression to
estimate the probability of low cost operability for the set of Italian airports
over the period 1998-2010 as follows:
2
lowcostjt = α + βt · lcprop
j dt + γt · lcprop
j dt + jt (4)
where lowcostjt is a dummy taking value one if airport j operates as low
cost in year t and dt is a binary J × T matrix of time dummies.
We then employed the model predicted values to build a year-airport
matrix of probabilities of operating as low cost, where the latter are ex-
plained by the exogenous airport structural “treatment” propensity com-
puted before, whose impact is allowed to vary across years. Finally, from
these values we derive a province-year theoretical matrix of distances be-
tween provinces and lowcost-predicted airports. The matrix of theoretical
distances constitutes our instrument for the matrix of observed distances in
the IV estimation of model (1).
We use two alternative definitions of low cost operability. In the first,
we look at the share of routes originated from the airport and consider the
latter as low cost if these count for at least 30 per cent of the total. In the
second, we label an airport as “low cost” if at least one among Ryanair and
EasyJet operates from there.
Finally, we perform two other analyses in order to shed some light on the
potential heterogeneous effects of low cost operability, respectively accord-
ing to the provinces infrastructure endowment and, in order to gain more
insights into geographical heterogeneity, to the two main areas of Italy.
The results (see table 2 below) indicate that low cost operability posi-
tively affects total tourism receipts. As the distance (in terms of travel time)
from the closest lowcost airport increases, tourism expenditure declines. IV
coefficients are somewhat larger in size with respect to OLS, accounting
for an elasticity of about 0,1 in expenditure. This result is robust to the
introduction of a dummy controlling for highly attractive events for interna-
tional tourists, such as the Jubilee in Rome and the Winter Olympic Games
in Turin. When we turn to leisure expenditure (table 3) we find a larger
elasticity of lowcost carriers, in line with the intuition that low cost flights
are addressed mostly to leisure tourist rather than to business travellers.
The results are robust to alternative definitions of lowcost operability. If we
4
They use river gradient in order to predict the number of dams per district and then
use the predicted number of dams in the district as an instrument for actual number of
dams.
9employ the alternative definition of lowcost operating airport (i.e., low-cost
operating airports are those where at least one among Ryanair and EasyJet
operate) our previous results are confirmed, although the IV estimates are
now larger in size (tables 4 and 5). In the last row of each column of the IV
estimates we show the F-statistic of the corresponding first stage regression,
which is always above the weak instrument threshold.
In order to assess the possible heterogeneous effects of low cost flights
according to the railways endowment, we estimate our model separately
for the better endowed provinces (top rank, above the median value of the
railways endowment index) and for the others (bottom rank, below the me-
dian) Our results suggest that the impact of LCCs has been greater in the
provinces characterized by a lower endowment of railways (tables 10 and
11). This seems to suggest that, in provinces where railway infrastructures
endowment is lower, low cost flights are suitable substitutes.
Finally, we run our estimates separately for each of the two main areas
of the country, in order to check for possible heterogeneous effects across
the Italian territory. Our results (see tables 7 and 6) show that the positive
impact of low-cost flights on tourism expenditure is referable entirely to the
South of the country, while there is no effect at all in the Centre and North.
The positive impact of lowcost flights on tourism expenditure in the South
could have operated at least through two different channels. Firstly, since in
the South incoming tourists mainly have to rely on flights (the endowment
of road and railway networks is low; Banca d’Italia (2011)), the introduction
of low fares routes allowed a large number of tourists to reach otherwise not-
affordable destinations. Secondly, lowcost flights directly reached previously
disconnected tourism “niche” markets (such as Alghero in Sardinia). On
the other hand, the absence of a statistically significant impact of lowcost
flights on tourism receipts in the Centre and North could reflect crowding
out effects between LCCs and FSCc and between LCCs and other cheap
transportation means such as long haul coaches or railways.
5 Robustness
As first robustness check, we lowered the threshold in terms of routes share
for an airport to be considered as low-cost operating from 30 per cent to
20 per cent. The new estimates, shown in tables 12 and 13, confirm our
previous results. The same qualitative findings hold also if we consider an
higher threshold (40 per cent; estimates not reported).
We also consider an alternative measure of distance. In particular, we
consider the mean distance between the cities and the three closest lowcost
operating airports rather than just the distance between the city and the
closest one. Results, reported in tables 14 and 15 are very similar to the
previous findings.
10In a third exercise, we modify our identification strategy and estimate
the lowcost operating propensity using 2006 airports data rather than 2010.
The reason is that from 2007 lowcost carriers started operating also from
some large airports and this could weaken our identification strategy, where
we hypothesize that lowcost carriers tend to select mainly smaller airports.
Results, reported in tables 16 and 17 support our previous findings, although
the estimated elasticities are now lower.
As a further robustness check, we devised an alternative IV strategy.
For each province we compute the number of airports within a range of 3
hours driving time, characterized by a runway of at least 2000m and an air
traffic control system (as said earlier, these are strictly necessary features for
LCCs to operate) and the average travel time. We then interacted these two
variables with year dummies and used them as instruments in the FE panel
model. The results support our previous findings, although, as expected, the
instruments are weaker than the ones used in the previous exercise (tables
8 and 9).
6 Conclusions
Tourism is considered one of the key drivers of regional development; this is
particularly true in Italy, a traditional destination for international trav-
ellers, where tourism consumption represents about 5 per cent of GDP.
Among the many different factors that affect tourism trends, the afford-
ability of international flights has been claimed to play a very important
role. This is why the presence of low cost carriers is often linked to tourism
growth in certain areas. This evidence, however, is both scarce and partial;
it mainly focuses on single-airports’ analysis, carried out as case studies or
assessed by means of time series data. Moreover, while claims of a positive
relationship predominate, the econometric analysis does not always take into
account potential reverse causality bias.
In this paper we try to fill this gap by using a novel dataset. In particular,
we use province (NUTS3) information on tourism expenditure over the years
1999-2010, which allow us to get a clearer picture of the local impact of
LCCs. In order to deal with endogeneity issues we follow an instrumental
variable approach, where the source of exogeneity comes from the physical
features of Italian airports, measured at the end of the 1990s.
Our results show that as the distance (in terms of travel time) from the
closest lowcost airport increases, tourism receipts drop, accounting for an
elasticity of about 0.1. The elasticity rises to about 0.3 if we consider an
alternative definition of low cost operability. The impact is slightly larger if
we focus on leisure tourism expenditure only. The impact of lowcost routes
on tourism is characterized by a marked heterogeneity across the country and
according to the provinces infrastructures endowment: it is referable entirely
11to the South and in the provinces with a lower infrastructures endowment
while there is no effect in the Centre and North.
References
Alderighi, M. and Gaggero, A. (2012). Do non-stop flights boost exports?,
mimeo .
Alivernini, A. (2012). Una valutazione delle spese turistiche fra il centro
nord e il mezzogiorno (1998-2008), Rivista di economia e statistica del
territorio 1-2012: 121–149.
Banca d’Italia (2011). Relazione annuale sul 2010, www.bancaditalia.it .
Bieger, T. and Wittmer, A. (2006). Air transport and tourism perspective
and challenges for destinations, airlines and governments, Journal of
Air Transport Management 12.
Bottasso, A., Conti, M. and Piga, C. (2011). Low cost carriers and air-
ports performance: empirical evidence from a panel of uk airports, The
Rimini Centre for Economic Analysis (RCEA), WP 11-48 .
Brueckner, J. (2003). Airline traffic and urban economic development, Urban
Studies 40 (8).
Campisi, D., Costa, R. and Mancuso, P. (2010). The effects of low cost
airlines growth in italy, Modern Economy .
Duflo, E. and Pande, R. (2007). Dams, Quarterly Journal of Economics
122(2): 601–646.
ENAC (2012). Dati di traffico 2011, www.enac.gov.it .
ENAC-KPMG (2011). Evoluzione del traffico low cost a livello europeo e
nazionale, www.enac.gov.it .
European Commission (2010). Europe, the world’s no 1 tourist destination
a new political framework for tourism in europe, www.ec.europa.eu .
European Parliament (2007). The consequences of the growing european
low-cost airline sector, DG for Internal Policies of the Union, 2007 .
Glaeser, E., Kallal, H., Scheinkman, J. and Shleifer, A. (1992). Growth of
cities, Journal of Political Economy 100: 1126–1152.
Graham, A., Papatheodorou, A. and Forsyth, P. (2007). Aviation and
Tourism - Implication for Leisure Travel, Ashgate Publishing Ltd.
12OECD (2011). Oecd studies on topurism italy, review of issues and policies,
OECD Publishing. http://dx.doi.org/10.1787/9789264114258-en .
Percoco, M. (2010). Airport activity and local development: Evidence from
italy, Urban Studies 47 (11): 427–443.
Pulina, M. and Cortes-Jimenez, I. (2010). Have low-cost carriers influenced
tourism demand and supply? the case of alghero, italy, Tourism Anal-
ysis 15: 617635.
Rey, B., Myro, R. L. and Galera, A. (2011). Effect of low-cost airlines on
tourism in spain. a dynamic panel data model, Journal of Air Transport
Management 17 (3): 163–167.
Ribeiro de Almeida, C. (2011). Low cost airlines, airports and tourism. the
case of faro airport, mimeo .
Rosenthal, S. S. and Strange, W. C. (2001). The determinants of agglomer-
ation, Journal of Urban Economics 50(2): 191229.
Saiz, A. (2007). Immigration and housing rents in american cities, Journal
of Urban Economics 61: 345–371.
Wei, W. and Hansen, M. (2006). An aggregate demand model for air pas-
senger traffic in the hub-and-spoke network, Transportation Research
Part A 40: 841851.
Whyte, R. (2007). Impacts of low cost carriers on regional tourism, mimeo .
Williams, A. M. and Bal, V. (2009). Low-cost carriers, economies of flows
and regional externalities, Regional Studies 43(5): 677–691.
Wooldridge, J. (2002). Econometric Analysis of Cross Section and Panel
Data, MIT Press, Cambridge, Mass.
13Tables
Table 1: Low cost propensity estimation - ‘share’ definition of low cost
VARIABLES lc2010
max runway1999 0.352*
(0.178)
twr1999 0.368**
(0.166)
small area1999 0.000
(0.000)
medium area1999 0.049
(0.244)
large area1999 -0.597**
(0.285)
Observations 49
R-squared 0.459
Percent correctly predicted 83.7
Robust standard errors in parentheses *** pTable 2: Total tourism expenditure - ‘share’ definition of low cost
ols iv
VARIABLES log(expend.) log(expend.) log(expend.) log(expend.)
log(distance) -0.065** -0.065** -0.106* -0.108*
(0.025) (0.025) (0.056) (0.057)
events 0.189*** 0.189***
(0.029) (0.035)
log(pc gdp) 0.03 0.054
(0.401) (0.308)
year dummies yes yes yes yes
Observations 1236 1236 1236 1236
R-squared 0.05 0.051
widstat e(widstat) e(widstat) 54.36 53.26
Robust standard errors in parentheses *** pTable 4: Total tourism expenditure - ‘top 2’ definition of low cost
ols iv
VARIABLES log(expend.) log(expend.) log(expend.) log(expend.)
log(distance) -0.043* -0.043* -0.332** -0.343**
(0.023) (0.023) (0.161) (0.169)
events 0.196*** 0.247***
(0.029) (0.058)
log(pc gdp) 0.033 0.306
(0.404) (0.365)
year dummies yes yes yes yes
Observations 1236 1236 1236 1236
R-squared 0.042 0.042
Number of codistat 103 103 103 103
widstat e(widstat) e(widstat) 12.82 12.11
Robust standard errors in parentheses *** pTable 6: Total tourism expenditure - ‘share’ definition of low cost - Centre & North
vs South & Islands
Centre & North South & Islands
ols iv ols iv
VARIABLES log(expend.) log(expend.) log(expend.) log(expend.)
log(distance) -0.012 -0.002 -0.095** -0.193**
(0.026) (0.057) (0.039) (0.098)
events 0.284*** 0.284***
(0.027) (0.032)
log(pc gdp) -0.044 -0.049 -0.163 0.054
(0.481) (0.352) (0.686) (0.615)
year dummies yes yes yes yes
Observations 744 744 492 492
R-squared 0.036 0.117
widstat e(widstat) 39.98 e(widstat) 20.39
Robust standard errors in parentheses *** pTable 8: Total tourism expenditure - ‘share’ definition of low cost - alternative IV
ols iv
VARIABLES log(expend.) log(expend.) log(expend.) log(expend.)
log(distance) -0.065** -0.066** -0.108*** -0.113***
(0.025) (0.025) (0.041) (0.042)
events 0.317***
(0.093)
log(pc gdp) 0.033 -0.230
(0.401) (0.244)
year dummies yes yes yes yes
Observations 1236 1236 1236 1236
R-squared 0.050 0.052 0.035 0.036
widstat e(widstat) e(widstat) 7.913 7.456
Robust standard errors in parentheses *** pTable 10: Total tourism expenditure - ‘share’ definition of low cost - railway en-
dowment split
top rank bottom rank
ols iv ols iv
VARIABLES log(expend.) log(expend.) log(expend.) log(expend.)
log(distance) -0.004 0.197 -0.111*** -0.206***
(0.025) (0.173) (0.032) (0.055)
events 0 0.154*** 0.158***
0 (0.041) (0.049)
log(pc gdp) -0.529 -0.973 0.289 0.215
(0.509) (0.597) (0.587) (0.446)
year dummies yes yes yes yes
Observations 612 612 624 624
R-squared 0.072 -0.078 0.089 0.064
widstat e(widstat) 10.6 e(widstat) 53.79
Robust standard errors in parentheses *** pTable 12: Total tourism expenditure - ‘20%share’ definition of low cost
ols iv
VARIABLES log(expend.) log(expend.) log(expend.) log(expend.)
log(distance) -0.047** -0.048** -0.273** -0.272**
(0.021) (0.021) (0.121) (0.122)
events 0.203*** 0.273***
(0.029) (0.061)
log(pc gdp) 0.013 0.107
(0.405) (0.327)
year dummies yes yes yes yes
Observations 1236 1236 1236 1236
R-squared 0.045 0.045 -0.134 -0.132
Number of codistat 103 103 103 103
widstat e(widstat) e(widstat) 14.19 14.03
Robust standard errors in parentheses *** pTable 14: Total tourism expenditure distance from 3 closest airports - share defi-
nition of low cost
ols iv
VARIABLES log(expend.) log(expend.) log(expend.) log(expend.)
log(distance3airports) -0.151*** -0.151*** -0.265* -0.263*
(0.045) (0.045) (0.142) (0.14)
events 0.173*** 0.162***
(0.03) (0.038)
log(pc gdp) -0.066 -0.11
(0.393) (0.3)
year dummies yes yes yes yes
Observations 1236 1236 1236 1236
R-squared 0.052 0.052 0.043 0.044
widstat e(widstat) e(widstat) 34.73 36.46
Robust standard errors in parentheses *** pTable 16: Total tourism expenditure 2006 propensity - share definition of low cost
ols iv
VARIABLES log(expend.) log(expend.) log(expend.) log(expend.)
log(distance) -0.047** -0.048** -0.187*** -0.189***
(0.021) (0.021) (0.059) (0.059)
events 0.203*** 0.247***
(0.029) (0.045)
log(pc gdp) 0.013 0.072
(0.405) (0.313)
year dummies yes yes yes yes
Observations 1236 1236 1236 1236
R-squared 0.045 0.045 -0.024 -0.025
widstat e(widstat) e(widstat) 50.94 50.6
Robust standard errors in parentheses *** pYou can also read