Chemotaxonomy of domesticated grasses: a pathway to understanding the origins of agriculture - Journal of Micropalaeontology
←
→
Page content transcription
If your browser does not render page correctly, please read the page content below
J. Micropalaeontology, 38, 83–95, 2019
https://doi.org/10.5194/jm-38-83-2019
© Author(s) 2019. This work is distributed under
the Creative Commons Attribution 4.0 License.

        Chemotaxonomy of domesticated grasses: a pathway to
              understanding the origins of agriculture
       Phillip E. Jardine1,2 , William D. Gosling3 , Barry H. Lomax4 , Adele C. M. Julier2 , and Wesley T. Fraser5,2
                   1 Institute
                           of Geology and Palaeontology, University of Münster, 48149 Münster, Germany
                         2 School
                               of Environment, Earth and Ecosystem Sciences, The Open University,
                                        Walton Hall, Milton Keynes, MK7 6AA, UK
           3 Department of Ecosystem and Landscape Dynamics, Institute for Biodiversity & Ecosystem Dynamics

                  (IBED), University of Amsterdam, P.O. Box 94240, 1090 GE Amsterdam, the Netherlands
                            4 Agriculture and Environmental Science, University of Nottingham,

                                 Sutton Bonington Campus, Leicestershire, LE12 5RD, UK
               5 Geography, Department of Social Sciences, Oxford Brookes University, Oxford OX3 0BP, UK

                                 Correspondence: Phillip E. Jardine (jardine@uni-muenster.de)

              Received: 20 December 2018 – Revised: 13 May 2019 – Accepted: 21 May 2019 – Published: 7 June 2019

       Abstract. The grass family (Poaceae) is one of the most economically important plant groups in the world
       today. In particular many major food crops, including rice, wheat, maize, rye, barley, oats and millet, are grasses
       that were domesticated from wild progenitors during the Holocene. Archaeological evidence has provided key
       information on domestication pathways of different grass lineages through time and space. However, the most
       abundant empirical archive of floral change – the pollen record – has been underused for reconstructing grass
       domestication patterns because of the challenges of classifying grass pollen grains based on their morphology
       alone. Here, we test the potential of a novel approach for pollen classification based on the chemical signature
       of the pollen grains measured using Fourier transform infrared (FTIR) microspectroscopy. We use a dataset
       of eight domesticated and wild grass species, classified using k-nearest neighbour classification coupled with
       leave-one-out cross validation. We demonstrate a 95 % classification success rate on training data and an 82 %
       classification success rate on validation data. This result shows that FTIR spectroscopy can provide enhanced
       taxonomic resolution enabling species level assignment from pollen. This will enable the full testing of the
       timing and drivers of domestication and agriculture through the Holocene.

1   Introduction                                                   logg, 1998; Leff et al., 2004; Meyer et al., 2012), which to-
                                                                   gether account for ∼ 63 % of total cultivated land area (Leff
The transition from a mobile, hunter–gatherer lifestyle to a       et al., 2004). Understanding the initial exploitation and do-
sedentary lifestyle centred on agriculture was one of the ma-      mestication of grasses and the spread of these lineages and
jor shifts in the history of human civilisation. While many        agricultural practices is therefore a key research endeavour,
different species of plants were successfully domesticated         including questions of when, where and why particular lin-
over the course of the Holocene, grasses (Poaceae) have been       eages were domesticated and what impact this had on human
a particular focus of exploitation, both for human consump-        societies and the landscapes in which they lived. A fuller un-
tion and as animal feed. Principal grass crops include wheat       derstanding of domestication may also play an important role
(Triticum), rice (Oryza), maize (Zea), barley (Hordeum), rye       in securing future food security (Charmet, 2011).
(Secale), oats (Avena), Sorghum, sugarcane (Saccharum),               Evidence for the domestication of grasses and the spread
and the millets (principally Eleusine, Panicum, Pennisetum         of agriculture has come from a variety of sources. A combi-
and Setaria, but also including other genera from within the       nation of modern and ancient DNA analysis (Dvorak et al.,
subfamilies Chloridoideae and Panicoideae) (Fig. 1a) (Kel-

Published by Copernicus Publications on behalf of The Micropalaeontological Society.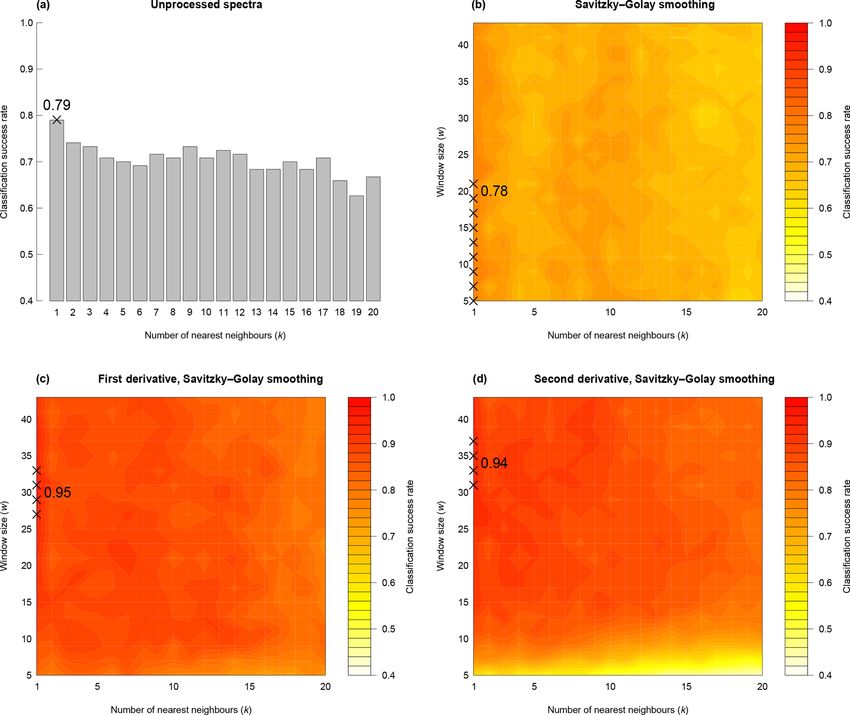
84                                                                    P. E. Jardine et al.: Chemotaxonomy of domesticated grasses

Figure 1. (a) Poaceae subfamily cladogram, redrawn from Soreng et al. (2015). BOP clade: subfamilies Bambusoideae, Oryzoideae and
Pooideae. PACMAD clade: subfamilies Panicoideae, Aristidoideae, Chloridoideae, Micrairoideae, Arundinoideae and Danthonioideae. The
genus names in parentheses are crop taxa mentioned in the text, and those in red are included in this study. (b) Hybridisation and domestication
pathway for wheat, showing relationships among taxa and their ploidy levels. All taxa except Aegilops speltoides are included in this study
(see also Table 1). Redrawn from International Wheat Genome Sequencing Consortium (2014), with additional information from Petersen
et al. (2006).

2006; International Wheat Genome Sequencing Consortium,                   1992; Dickson, 1988; Firbas, 1937; Joly et al., 2007; Köhler
2014; Marcussen et al., 2014; Mascher et al., 2016; Meyer                 and Lange, 1979; Rowley, 1960; Tweddle et al., 2005), al-
and Purugganan, 2013; Petersen et al., 2006), controlled                  though of these various characters grain size has been most
growth experiments (Cunniff et al., 2014; Preece et al., 2015,            commonly relied upon in routine palynological studies (Bot-
2017, 2018), and archaeobotanical remains of grasses and                  tema, 1992). Pollen grain size varies between 30 and 100 µm
grain processing (Crowther et al., 2016; Fuller, 2007; Piperno            among Poaceae species and broadly correlates with genome
et al., 2004; Savard et al., 2006; Vignola et al., 2017; Weiss et         size (Bennett, 1972). Since domesticated grasses are typi-
al., 2004; Willcox et al., 2007) have together provided a de-             cally polyploid they have larger pollen grains than their wild
tailed picture of when and where different taxa were domes-               type relatives, and this has led to a size-based circumscription
ticated, including the hybridisation pathways that produced               of a “Cerealia” type (Andersen, 1979; Beug, 1961, 2004;
the modern domesticated types (Fig. 1b), and why certain                  Bottema, 1992; Firbas, 1937; Joly et al., 2007; Tweddle et
species may have been selected for cultivation over others. A             al., 2005). In practice, however, there is often an overlap in
key outstanding challenge is the need for better spatially and            size between wild and domesticated pollen types, especially
temporally resolved data on the first appearances of domesti-             outside of northwest Europe where wild grasses frequently
cated species and their subsequent diffusion to other regions,            exceed the 40 µm Cerealia size cut-off (Bottema, 1992; Joly
which will in turn enable a fuller understanding of the role              et al., 2007; Tweddle et al., 2005). Pollen size is also known
that climatic and environmental changes played in shaping                 to be influenced by processing procedures, and storage and
the origins and spread of agriculture (Larson et al., 2014).              mounting media, with both acetolysis and storage in glyc-
   Of the different sources of empirical evidence for histor-             erol leading to a size increase (Christensen, 1946; Cushing,
ical vegetation change, pollen provides the most abundant                 1961; Faegri and Deuse, 1960; Reitsma, 1969; Sluyter, 1997;
and widespread records, but is also one of the most challeng-             see also Jardine and Lomax, 2017, for review).
ing to utilise for tracking grass domestication and agricul-                 Variations in pollen grain surface sculpture have been used
tural practices through time. This is because pollen morphol-             as a basis for dividing grains up into broad types, such as
ogy is highly similar across the ∼ 12 000 species (Soreng et              the Hordeum type, Triticum type, Avena type and Setaria
al., 2015) within Poaceae (Strömberg, 2011). Poaceae pollen               type of Köhler and Lange (1979). Additional information
grains are all morphologically simple, being more or less                 on grain morphology has then been used to separate out in-
spherical with a single, annulate pore and a scabrate to are-             dividual taxa, such as Secale cereale L. (rye) being distin-
olate surface sculpture (Köhler and Lange, 1979; Mander et                guished from other members of the Hordeum type by grain
al., 2013). Attempts to distinguish among and between wild                shape and pore position (Dickson, 1988; Köhler and Lange,
grasses and their domesticated relatives have relied on a com-            1979). These sculpturing types are, however, not phyloge-
bination of grain size and shape, pore diameter and position,             netically or taxonomically meaningful and occur across the
annulus width and thickness, and exine structure and mi-                  grass phylogeny (Mander and Punyasena, 2016). Triticum
crosculpture (Andersen, 1979; Beug, 1961, 2004; Bottema,                  monococcum (domesticated einkorn) has been assigned to

J. Micropalaeontology, 38, 83–95, 2019                                                          www.j-micropalaeontol.net//38/83/2019/
P. E. Jardine et al.: Chemotaxonomy of domesticated grasses                                                                      85

the Hordeum rather than the Triticum type based on scan-            at the John Innes Centre, and the Avena and Hordeum plants
ning electron microscopy (SEM) analysis of its exine mi-            were grown and sampled in greenhouses. We sampled three
crosculpture (for example Köhler and Lange, 1979), and the          plants from each species, except for T. monococcum (domes-
Hordeum, Triticum, Avena and Setaria types all occur in             ticated einkorn) where only two plants were in anthesis at
both the PACMAD and BOP clades (Fig. 1a) (Mander and                the time of sampling. Four to six anthers were collected from
Punyasena, 2016). Surface and structural micro-features are         each plant and combined together to give a sufficient quantity
also challenging to unambiguously identify using light mi-          of pollen for chemical analysis. This means that each sample
croscopy, even if high magnification and/or phase contrast          represents a whole plant, rather than an individual anther.
are employed (Andersen and Bertelsen, 1972; Mander et al.,             We used Fourier transform infrared (FTIR) microspec-
2013; Rowley, 1960; Tweddle et al., 2005). While sophis-            troscopy to generate chemical data, because it is an efficient
ticated computational image-based classification approaches         method that has demonstrated success in pollen characterisa-
have been developed on Poaceae pollen (Mander et al., 2013)         tion and classification studies (Bağcıoğlu et al., 2015, 2017;
they have not yet been applied to crop domestication prob-          Bell et al., 2018; Bernard et al., 2015; Dell’Anna et al., 2009;
lems, and since they rely on SEM imaging would be costly            Depciuch et al., 2018; Domínguez et al., 1998; Fraser et al.,
and time consuming to perform on the large numbers of               2012, 2014; Gottardini et al., 2007; Jardine et al., 2015, 2017;
specimens and samples required to make meaningful insight           Julier et al., 2016; Lomax et al., 2008; Pappas et al., 2003;
into the topic (Julier et al., 2016). Finally, all size, shape      Steemans et al., 2010; Watson et al., 2007; Zimmermann,
and sculpturing characters may be influenced by taphonomy           2010, 2018; Zimmermann and Kohler, 2014; Zimmermann
(Bottema, 1992; Jardine and Lomax, 2017), and it is not clear       et al., 2015a, b, 2016). The pollen samples were picked onto
how useful they are, even in combination, for examining the         ZnSe windows for FTIR analysis, which was carried out us-
earliest phases of wild grass hybridisation and domestication.      ing a Thermo Scientific (Waltham, MA, USA) Nicolet Nexus
   Recent research has demonstrated the potential of us-            FTIR bench unit, attached to a Continuum IR microscope fit-
ing the chemical signature of pollen grains as an alter-            ted with an MCT-A liquid nitrogen-cooled detector, run in
native means of classification. Non-destructive vibrational         transmission mode using a Reflachromat 15× objective. To
spectroscopic methods such as Fourier transform infrared            remove atmospheric H2 O and CO2 interference within spec-
(FTIR) and Raman spectroscopy have been applied to pollen           tra, the entire system (bench unit, microscope and sample
and spore classification problems in both plants and fungi          stage) was purged with air that has been dried and scrubbed
(Bağcıoğlu et al., 2015; Dell’Anna et al., 2009; Ivleva et al.,   of CO2 using a Peak Scientific (Billerica, MA, USA) ML85
2005; Julier et al., 2016; Pappas et al., 2003; Schulte et al.,     purge unit. We collected eight replicate spectra from each
2008; Zimmermann, 2010, 2018; Zimmermann and Kohler,                sample using an aperture size of 100 µm × 100 µm at 256
2014; Zimmermann et al., 2015a, b, 2016) and have demon-            scans per replicate and a resolution of 4 cm−1 . A background
strated a high degree of accuracy in discriminating between         scan of a blank region of the ZnSe window was taken before
closely related taxa. Zimmermann (2018) applied FTIR to             each sample scan.
chemically profile and separate two morphological similar              Data analyses were carried out in R v.3.4.2 (R Core Team,
species of pine (Pinus mugo Turra and Pinus sylvestris L.). A       2017) using the packages baseline v.1.2-1 (Liland and Mevik,
further FTIR study based on grasses of tropical West Africa         2015), caret v.6.0-77 (Kuhn, 2017), class v.7.3-14 (Venables
(Julier et al., 2016) revealed a subfamily level classification     and Ripley, 2002), corrplot v.0.84 (Wei and Simko, 2017),
success rate of 80 %, suggesting that this approach might be        e1071 v.1.6-8 (Meyer et al., 2017) and prospectr v.0.1.3
useful for distinguishing among different species of domes-         (Stevens and Ramirez-Lopez, 2013). Although some pollen
ticated and wild grasses. Here we test this possibility on a        chemistry studies (e.g. Bağcıoğlu et al., 2015, 2017; Zim-
dataset of grass crops and their wild progenitors, with a view      mermann and Kohler, 2014) have cropped FTIR spectra to
to developing pollen chemotaxonomy as a viable archaeob-            the 1900 to 700 cm−1 region (i.e. the “fingerprint” region),
otanical tool.                                                      preliminary analysis showed that with our dataset this de-
                                                                    creased classification success by 1 % to 2 %. While this sug-
                                                                    gests that the majority of relevant information for classifica-
2   Materials and methods                                           tion is in the fingerprint region, we proceeded with the full
                                                                    4000 to 690 cm−1 range to maximise classification success
Anthers from eight species of domesticated and wild grasses         and analyse inter-taxon differences across the entire spec-
(Table 1) were collected from the John Innes Centre, Nor-           tra. We corrected baseline drift by subtracting a second-order
wich, UK (52.62◦ N, 1.22◦ E), in May and June 2014. All             polynomial baseline from each spectrum. Variations in sam-
species are from the subfamily Pooideae (Fig. 1a), with             ple thickness will control the absolute height of spectra, so
Triticum (wheat), Aegilops (goat grass) and Hordeum (bar-           each spectrum was z score standardised by subtracting the
ley) from the tribe Triticeae and Avena (oat) from the tribe        mean value and dividing by the variance. We used principal
Poeae. The Triticum and Aegilops plants were grown out-             component analysis (PCA) and cluster analysis for data vi-
doors as part of the bread wheat domestication demonstration        sualisation and exploration (Varmuza and Filzmoser, 2009).

www.j-micropalaeontol.net//38/83/2019/                                                  J. Micropalaeontology, 38, 83–95, 2019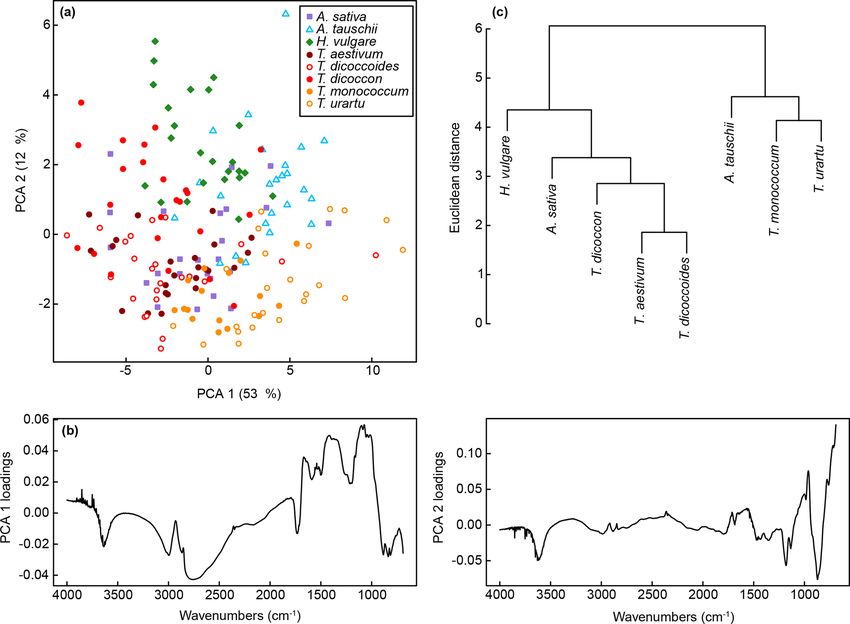
86                                                                   P. E. Jardine et al.: Chemotaxonomy of domesticated grasses

Table 1. Taxa included in the analysis. See Fig. 2c for pollen photographs for each taxon.

     Taxon                                                       Common name            Wild or domesticated   Number of plants sampled
     Avena sativa L.                                             Oat                    D                                             3
     Aegilops tauschii Coss.                                     Goat grass             W                                             3
     Hordeum vulgare L.                                          Barley                 D                                             3
     Triticum aestivum L.                                        Bread wheat            D                                             3
     Triticum dicoccoides (Körn. ex Asch. & Graebn.) Schweinf.   Wild emmer             W                                             3
     Triticum dicoccon (Schrank) Schübl.                         Domesticated emmer     D                                             3
     Triticum monococcum L.                                      Domesticated einkorn   D                                             2
     Triticum urartu Thumanjan ex Gandilyan                      Wild einkorn           W                                             3

The PCA was run on the sample spectra, and the cluster anal-             fications from the cross validation procedure (Varmuza and
ysis was run on the mean spectrum for each taxon, with the               Filzmoser, 2009). We varied k (the number of nearest neigh-
aim of exploring the main inter-taxon chemical relationships.            bours in the k-nn classification) and w (the window size
The cluster analysis was run using the Euclidean distance and            of the Savitzky–Golay smoothing), and tested classification
with the unweighted pair group method with arithmetic mean               success for all combinations of k = 1 to k = 20 and w = 5
(UPGMA) linkage algorithm.                                               to w = 43. For simplicity we kept p, the polynomial degree
   To test the classification potential of the chemical data, the        for the Savitzky–Golay smoothing, fixed to 3. Once the best
dataset was split randomly into training (two-thirds of the              combination of parameters had been selected from the train-
samples) and validation (one-third of the samples) subsets.              ing set, this was then applied to the validation set and k-nn
For the taxa with three plants sampled this involved selecting           classification run using the training set to classify the spec-
one plant at random and assigning the spectra from it to the             tra. Again, the classification success rate was calculated as
validation set. For T. monococcum, where only two plants                 the percentage of correct classifications. We used confusion
were sampled, 5 of the 16 spectra were randomly selected                 matrices to investigate among-taxon patterns in classification
and assigned to the validation set.                                      success rates. The raw data and R code for running the anal-
   We used k nearest neighbour (k-nn) classification, which              yses are available from figshare (Jardine et al., 2019).
assigns unknown spectra to groups (species) based on the
most chemically similar spectra (the “nearest neighbours”)
                                                                         3   Results
from the training set (Julier et al., 2016; Varmuza and Filz-
moser, 2009). The parameter k is the number of nearest
                                                                         FTIR spectra of the grass pollen grains (Fig. 2) show many
neighbours used for classification and is user selected. Where
                                                                         of the same absorbance peaks as have been demonstrated
k > 1 the classification is determined by majority vote, and
                                                                         in previous studies of pollen chemistry (Bağcıoğlu et al.,
in the case of a tie the group assignment is chosen at random
                                                                         2015, 2017; Fraser et al., 2012, 2014; Jardine et al., 2015,
(Venables and Ripley, 2002). We used the Euclidean distance
                                                                         2017; Julier et al., 2016; Watson et al., 2007; Zimmermann,
measure to determine between-sample chemical similarity.
                                                                         2010, 2018; Zimmermann and Kohler, 2014; Zimmermann
   In addition to running the k-nn classification on the un-
                                                                         et al., 2015a, b, 2016), including a broad OH band cen-
processed IR spectra, we tested the impact of Savitzky–
                                                                         tred on 3300 cm−1 ; peaks representing lipids at 2925 cm−1
Golay smoothing and taking first and second derivatives of
                                                                         (asymmetric CHn stretching), 2850 cm−1 (asymmetric CHn
the smoothed spectra. Savitzky–Golay smoothing fits poly-
                                                                         stretching), 1740 cm−1 (C=O stretching) and 1465 cm−1
nomial curves to successive windows across a data series,
                                                                         (CH2 deformation); proteins at 1650 cm−1 (amide 1: C=O
with a larger window size increasing the amount of smooth-
                                                                         stretching) and 1550 cm−1 (amide II: combination of NH de-
ing (Julier et al., 2016; Varmuza and Filzmoser, 2009). Tak-
                                                                         formation and C−N stretching); and carbohydrates in the
ing derivatives of the spectra can bring out smaller spectral
                                                                         1200 to 900 cm−1 region (C−O−C and C−OH stretch-
details to aid in classification but also increases the level of
                                                                         ing). The sporopollenin outer pollen wall (exine) is asso-
noise in the analysis (Julier et al., 2016; Varmuza and Filz-
                                                                         ciated with peaks at 1160 and 860 cm−1 , which relate to
moser, 2009) and so was only carried out on the Savitzky–
                                                                         aromatic ring vibrations (C−H deformation and stretching)
Golay smoothed spectra.
                                                                         (Bağcıoğlu et al., 2015; Watson et al., 2007). Previously
   We used leave-one-out cross validation (LOOCV) on the
                                                                         identified aromatic peaks at 1600 and 1510 cm−1 (both C=C
training dataset to find the best combination of parameters
                                                                         stretching) (Bağcıoğlu et al., 2015; Jardine et al., 2015, 2017;
for classification. LOOCV treats each spectrum as an un-
                                                                         Watson et al., 2007) are not clearly present in the FTIR spec-
known sample and classifies it based on the group member-
                                                                         tra and may be obscured by nearby protein-related peaks.
ship of the rest of the dataset. The classification success rate
                                                                         Only subtle differences among the taxa are discernible in the
can then be calculated as the percentage of correct classi-
                                                                         spectra, most obviously in the 1200 to 900 cm−1 region that

J. Micropalaeontology, 38, 83–95, 2019                                                        www.j-micropalaeontol.net//38/83/2019/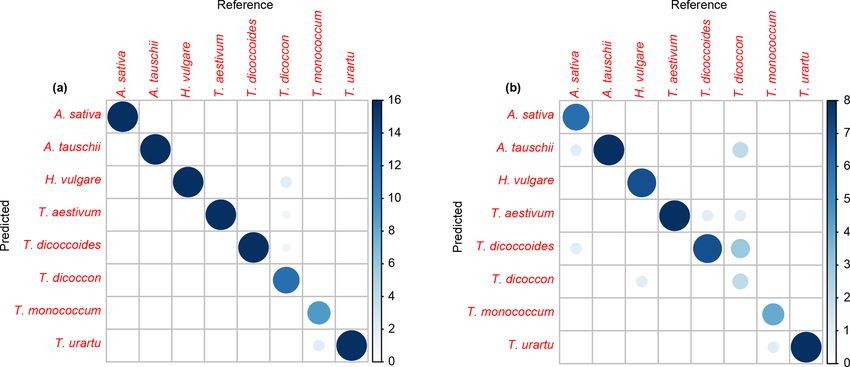
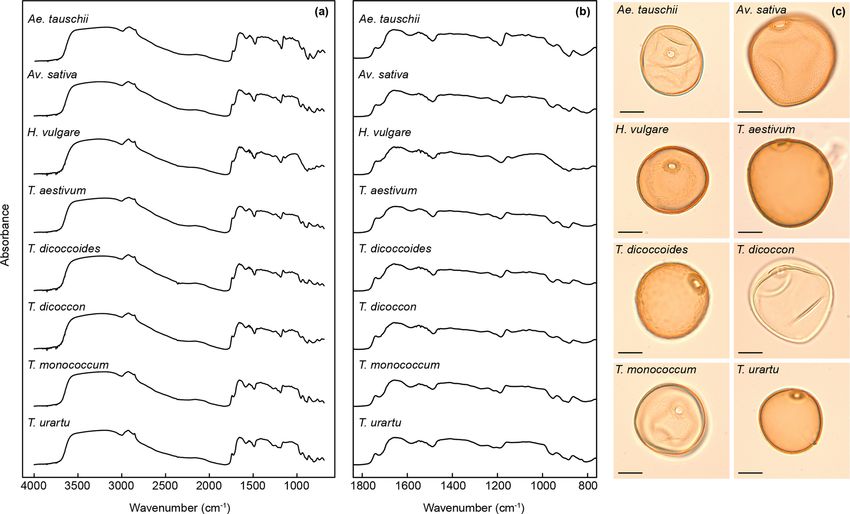
P. E. Jardine et al.: Chemotaxonomy of domesticated grasses                                                                          87

Figure 2. FTIR spectra showing the mean spectrum for each species across (a) the entire 4000 to 690 cm−1 range analysed and (b) the 1800
to 800 cm−1 region. See Fig. S1 for derivatised spectra. (c) Photographs of analysed grass species; scale bars are 20 µm.

relates to carbohydrates (Fig. 2). Derivatised spectra (Fig. S1       and the other comprises Aegilops tauschii, T. monococcum
in the Supplement) show these differences more clearly, but           and T. urartu, with the Triticum species forming subclusters
the spectra are still highly similar among taxa.                      within the two main clusters. As with the PCA the wild vari-
   The first two axes of a PCA on the unprocessed (i.e. z             eties of einkorn and emmer occur close to the domesticated
score standardised but not smoothed or differentiated) spec-          varieties within the cluster dendrogram.
tra account for 65 % of the variation in the dataset (Figs. 3a           For the training dataset, the maximum classification suc-
and S1a). Clear within-taxon groupings of samples are dis-            cess rate was 95 %, with Savitzky–Golay smoothed first
cernible in ordination space, although there is considerable          derivative spectra, k = 1 and w = 27, 29, 31 or 33 (Figs. 4
overlap among the taxa. Most Triticum samples plot out at             and S1a, Table 2). Misclassified samples from this combi-
the lower end of axis two, along with Avena. Wild emmer               nation of parameters were from T. dicoccon (four samples)
and einkorn (T. dicoccoides and T. urartu, respectively) also         and T. monococcum (two samples), with all samples from
occur close to their domesticated varieties (T. dicoccon and          the remaining six taxa being correctly classified (Fig. 5a).
T.monococcum, respectively). Loading plots (Fig. 3b) show             The next best combination of parameters was with Savitzky–
that samples occurring higher on axis one have higher peaks           Golay smoothed second derivative spectra (94 %; Fig. S1b),
in the 1700 to 1000 cm−1 region, and lower values at higher           then unprocessed spectra (79 %) and finally Savitzky–Golay
wavenumbers; this may in part be driven by residual baseline          smoothed spectra (78 %) (Fig. 4 and Table 2). In all cases the
effects. Axis two loadings show less of a clear signal except         choice of k was more critical than the choice of w for max-
for a peak at 1000 cm−1 , which again likely relates to varia-        imising the classification success rate, although there was
tions in carbohydrates (Bağcıoğlu et al., 2015). Higher PCA         a relatively broad tolerance for both when first or second
axes, each successively accounting for a smaller percentage           derivative spectra were used (Fig. 4).
of the variation in the dataset, demonstrate further separation          Based on the results from the training dataset, the valida-
among taxa (Fig. S2c and e).                                          tion dataset was classified using Savitzky–Golay smoothed
   A cluster analysis of the unprocessed taxon mean spectra           first derivative spectra, with k = 1 and w = 29 (Fig. S1a). A
(Fig. 3c) shows two main clusters. One comprises H. vulgare,          success rate of 82 % was achieved with this combination of
Avena sativa, T. dicoccon, T. aestivum and T. dicoccoides,            parameters. As with the training dataset the majority of mis-

www.j-micropalaeontol.net//38/83/2019/                                                     J. Micropalaeontology, 38, 83–95, 2019
88 P. E. Jardine et al.: Chemotaxonomy of domesticated grasses
Figure 3. (a) PCA of unprocessed FTIR spectra. Values in parentheses show the percentage variance explained by each PCA axis. See
Fig. S2 for PCA axes three to six. (b) Loadings for PCA axes one and two. (c) Cluster analysis of unprocessed FTIR spectra, based on the
mean spectrum for each species.
Table 2. Maximum classification success rate on the training dataset, with the best parameter combinations from the different spectral
processing approaches. k is the number of nearest neighbours in the k-nn classification algorithm, and w is the window size in the Savitzky–
Golay smoothing algorithm.
Processing Maximum success rate k w
Unprocessed 79 % 1 n/a
Savitzky–Golay smoothing 78 % 1 5 to 21
Savitzky–Golay smoothing, first derivative 95 % 1 27 to 33
Savitzky–Golay smoothing, second derivative 94 % 1 31 to 37
n/a – not applicable
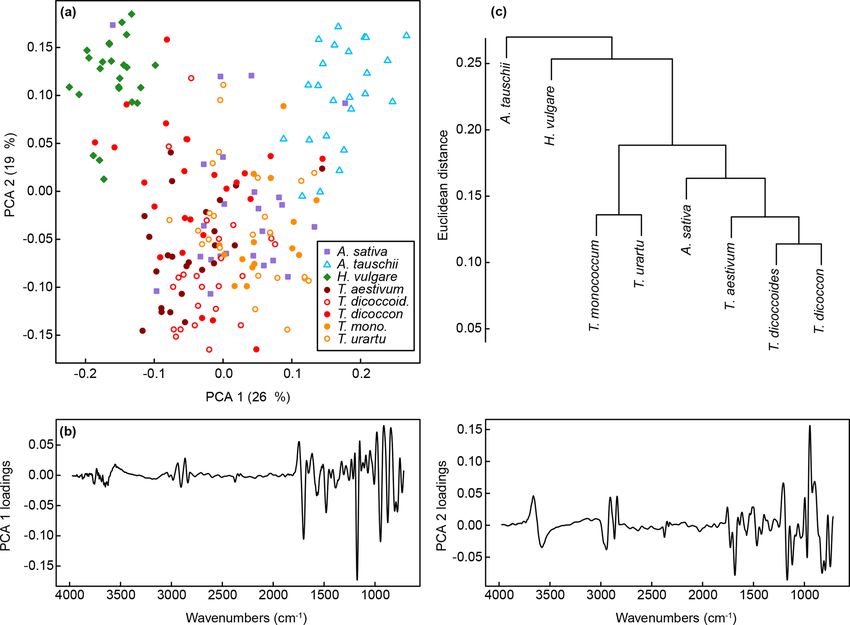
classified samples were from T. dicoccon (six samples), with among spectra occurs in the fingerprint region, with differ-
additional misclassifications of Avena sativa (two samples), ences in the 1200 to 900 cm−1 region again being important.
H. vulgare (one sample), T. dicoccoides (one sample) and T. A cluster analysis of the taxon mean spectra processed
monococcum (one sample) (Fig. 5b). with the classification parameters (Fig. 6c) shows one cluster
A PCA of the whole dataset using the classification pa- comprising the Triticum and Avena samples, with H. vulgare
rameters shows a pronounced arch effect, with one gradient and Aegilops tauschii branching off from this. The wild va-
on axis one curving round onto axis two (Fig. 6a). Samples rieties of einkorn and emmer occur in subclusters with the
of H. vulgare and Aegilops tauschii occur at either end of the domesticated varieties within the main Triticum and Avena
gradient, with samples from the other taxa appearing in over- cluster.
lapping groups in the middle. Together these two axes ac-
count for 45 % of the variation in the data (Fig. S2b), and as
with the unprocessed data further separation among taxa oc- 4 Discussion
curs on higher PCA axes (Fig. S2d and f). Loading plots for
axes one and two (Fig. 6b) confirm that most of the variation Our results demonstrate a classification success rate of 95 %
in the training dataset and 82 % in the validation dataset.
J. Micropalaeontology, 38, 83–95, 2019 www.j-micropalaeontol.net//38/83/2019/P. E. Jardine et al.: Chemotaxonomy of domesticated grasses 89 Figure 4. Classification success rate with variations in number of nearest neighbours (k), smoothing window size (w) and differentiation (m). In each panel crosses show the parameter combinations with the highest classification success rate. For (b) to (d), hotter colours denote a higher classification success rate. Figure 5. Confusion matrices for k-nn classification. (a) Training dataset and (b) validation dataset. www.j-micropalaeontol.net//38/83/2019/ J. Micropalaeontology, 38, 83–95, 2019
90                                                                 P. E. Jardine et al.: Chemotaxonomy of domesticated grasses

Figure 6. (a) PCA of FTIR spectra processed with Savitzky–Golay smoothing and first derivatives. Values in parentheses show the percentage
variance explained by each PCA axis. “T. dicoccoid.” represents T. dicoccoides; “T. mono.” represents T. monococcum. See Fig. S2 for PCA
axes three to six. (b) Loadings for PCA axes one and two. (c) Cluster analysis of FTIR spectra processed with Savitzky–Golay smoothing
and first derivatives based on the mean spectrum for each species.

These findings show that FTIR-based chemotaxonomy has                  and Aegilops tauschii. The PCA plots (Figs. 3 and 6) also
considerable potential as a means of classifying Poaceae               show that the T. dicoccon spectra are more widely dispersed
pollen to study grass domestication, and the spread of agri-           in ordination space versus those from the other taxa, sug-
culture and landscape change over the last 10 kyr. The abil-           gesting that T. dicoccon is more chemically variable than the
ity to generate species level count data from grass pollen             other species considered here and therefore more challeng-
would allow a much fuller use of the palynological record              ing to classify successfully. Nevertheless, the classification
in archaeobotanical studies and would provide an additional            accuracy demonstrated here is comparable to that of other
tool to complement other lines of evidence such as grass               chemical and morphological grass pollen classification stud-
seeds and chaff, starch grains and, more recently, DNA data            ies (Julier et al., 2016; Mander et al., 2013, 2014), justifying
from sedimentary deposits and ancient grains (Crowther et              further research in this area.
al., 2016; Fuller, 2007; Mascher et al., 2016; Piperno et al.,            Consistent with previous studies (Julier et al., 2016;
2004; Savard et al., 2006; Vignola et al., 2017; Weiss et al.,         Woutersen et al., 2018), we have found that processing the
2004; Willcox et al., 2007).                                           FTIR spectra with smoothing and differentiation improves
   More generally, these results show that closely related taxa        the classification success rate (Table 2). The taxa in this study
can be successfully classified based on their chemical sig-            are closely related and chemically highly similar (Fig. 2), and
nature alone. In the present dataset this includes discrimi-           working with derivatised spectra (Fig. S1) allows small-scale
nating between ancestors and their direct descendants (e.g.            spectral features to be enhanced for use in multivariate data
T. urartu and T. monococcum; T. dicoccoides and T. dicoc-              exploration and classification approaches. Our results also
con; Fig. 1b), and between parent taxa and their hybridised            show that not only does processing improve the separation
offspring (e.g. T. aestivum as a hybrid of T. dicoccon and             among taxa, it also influences their relative multivariate sim-
Aegilops tauschii; Fig. 1b), although it was also in these             ilarity and dissimilarity, and therefore the position of taxa rel-
cases that the majority of misclassifications occurred (Fig. 5).       ative to each other in the PCA ordination and cluster analysis
The decrease in classification success rate from the training          (Figs. 3 and 6). The processing approaches selected there-
dataset to the validation dataset is mostly accounted for by T.        fore have implications for exploring phylogenetic patterns
dicoccon being misclassified as T. dicoccoides, T. aestivum            in chemical data (Julier et al., 2016), or even using chem-

J. Micropalaeontology, 38, 83–95, 2019                                                      www.j-micropalaeontol.net//38/83/2019/
P. E. Jardine et al.: Chemotaxonomy of domesticated grasses                                                                     91

istry as a phylogenetic estimation tool in the fossil record. In     confident that taxonomic signals will be recoverable from
the present case processing the spectra with Savitzky–Golay          processed fossil and subfossil material.
smoothing and differentiation brings all Triticum species to-           Third, in common with a number of other studies that have
gether into one group, which makes sense from a classifi-            tested the potential for classifying pollen using chemical or
cation and a phylogenetic point of view. However, Aegilops           morphological data (Dell’Anna et al., 2009; Holt and Beb-
tauschii is then fully separated out from Triticum even though       bington, 2014; Holt and Bennett, 2014; Holt et al., 2011;
the two are very closely related, and Avena sativa is grouped        Julier et al., 2016; Mander et al., 2013, 2014; Zimmermann
in with Triticum even though it belongs to a separate tribe          et al., 2016; Woutersen et al., 2018), this research has fo-
from all other taxa in the dataset. The presence of a phyloge-       cused on a relatively small dataset comprising only a few
netic signal in pollen chemical data, and its recoverability in      species. For this technique to be widely applied it will need
FTIR spectra, whilst intriguing, requires further investigation      to be tested on a much larger number of taxa, with each ide-
with larger datasets.                                                ally being sampled from multiple individuals representing
   To make this technique fully applicable to palaeoecologi-         a range of environments (Holt and Bebbington, 2014), in-
cal and archaeological settings, three relatively simple limi-       cluding variations in ultraviolet B (UVB) regime since this
tations in the current study will need to be addressed. First, to    is known to influence pollen chemistry via the formation of
maximise the quality of the FTIR spectra the data here were          UVB absorbing compounds (UACs) (Jardine et al., 2016;
generated on groups of grains in a 100 µm × 100 µm window,           Lomax et al., 2008). This will provide a more realistic es-
resulting in identification being made on a number of grains         timate of classification success when mixed, and potentially
(8–10) rather than on the individual specimens that would            diverse, subfossil and fossil assemblages are analysed, as
need to be classified in fossil and subfossil samples. While         well as forming the basis of a chemical library that could be
FTIR spectra from individual pollen grains have typically            used as a training set for classification in archaeobotanical
suffered from scattering effects or increased noise (Zimmer-         and palaeoecological applications.
mann et al., 2016, 2015a; Zimmermann, 2018), this may be                Further enhancements to this approach may be possible by
overcome by specific mounting approaches, such as a layer            incorporating pollen grain size or surface sculpture informa-
of soft paraffin between sheets of polyethylene foil (Zim-           tion into the classification procedure. As already noted, the
mermann et al., 2016). An alternative to this methodological         size variation across Poaceae pollen grains broadly scales
approach is the application of new instrumentation such as           with genome size, with generally larger grains in domesti-
FTIR imaging systems, which combine high sample through-             cated types than in wild types (Andersen, 1979; Andersen
put with a high spatial resolution (achievable pixel resolution      and Bertelsen, 1972; Bennett, 1972; Beug, 1961, 2004; Bot-
of ∼ 0.5 µm2 ), enabling multiple high-quality spectra to be         tema, 1992; Firbas, 1937; Tweddle et al., 2005). If combined
gathered from individual pollen grains. Raman microspec-             with chemical data, pollen grain size, along with pore and
troscopy might form a valuable alternative data acquisition          annulus size, may be useful for improving the classifica-
approach, where the resolution can also be ≤ 2 µm and mul-           tion of wild types and their domesticated descendants. Sur-
tiple measurements are obtainable from single specimens              face sculpturing, as already utilised by the computational im-
(Bağcıoğlu et al., 2015; Gottardini et al., 2007; Ivleva et al.,   age analysis classification approach of Mander et al. (2013),
2005; Pummer et al., 2013; Schulte et al., 2008, 2009, 2010;         could together with chemistry data offer a powerful set of
Zimmermann, 2010; Zimmermann et al., 2015a).                         tools. A challenge to integrating these different data types,
   Second, the dataset presented here was generated from             however, is constructing a robust and efficient workflow.
fresh pollen grains that include proteins, lipids and carbohy-       FTIR imaging systems allow for measurements of grain size
drates, as opposed to the isolated pollen walls that are present     quite readily, but it would be considerably harder to capture
in sedimentary deposits (Jardine et al., 2015, 2017). The suc-       SEM images of the same grains for computational feature
cess of this technique therefore needs to be tested on iso-          analysis.
lated sporopollenin, either by acetolysing the pollen grains or         We have used FTIR spectroscopic data from pollen grains
via other processing methods (e.g. Domínguez et al., 1998;           to demonstrate that high levels of classification success are
Gonzalez-Cruz et al., 2018; Loader and Hemming, 2000;                obtainable for differentiating among domesticated grasses
Mundargi et al., 2016). Demonstrating the success of the             and their wild relatives. This approach therefore offers much
technique on acetolysed grains would be particularly valu-           potential for leveraging further information from Holocene
able, because this would allow many existing sets of pro-            pollen data, for reconstructing the spread of agriculture and
cessed pollen samples to be utilised (Jardine et al., 2016). A       its impact on ecosystems and environments. It also has the
recent FTIR study on Nitraria pollen (Woutersen et al., 2018)        potential to improve on current size-based classifications of
has shown clear species level taxonomic differentiation on           domesticated and wild grasses, or sculpture-based classifica-
chemically isolated single pollen grains, and our previous           tions of polyphyletic groups of taxa. Future studies need to
work (Jardine et al., 2015, 2016, 2017) has demonstrated that        focus on expanding the number of taxa, and working with
components of the sporopollenin biomacromolecule are sta-            isolated sporopollenin from single pollen grains, to provide a
ble after exposure to acetolysis procedures. We are therefore

www.j-micropalaeontol.net//38/83/2019/                                                  J. Micropalaeontology, 38, 83–95, 2019
92                                                                      P. E. Jardine et al.: Chemotaxonomy of domesticated grasses

more realistic test of classification potential in archaeological            B proxy for Northwest Africa, Holocene, 28, 1382–1394,
settings.                                                                    https://doi.org/10.1177/0959683618777072, 2018.
                                                                           Bennett, M. D.: Nuclear DNA Content and Minimum Generation
                                                                             Time in Herbaceous Plants, P. Roy. Soc. B-Biol. Sci., 181, 109–
Code and data availability. The data and code required to run                135, 1972.
these analyses are available on figshare: https://doi.org/10.6084/m9.      Bernard, S., Benzerara, K., Beyssac, O., Balan, E., and Brown
figshare.8046395 (Jardine et al., 2019).                                     Jr., G. E.: Evolution of the macromolecular structure of
                                                                             sporopollenin during thermal degradation, Heliyon, 1, e00034,
                                                                             https://doi.org/10.1016/j.heliyon.2015.e00034, 2015.
                                                                           Beug, H. J.: Leitfaden der Pollenbestimmung, Gustav Fischer Ver-
Supplement. The supplement related to this article is available
                                                                             lag, Stuttgart, 1961.
online at: https://doi.org/10.5194/jm-38-83-2019-supplement.
                                                                           Beug, H. J.: Leitfaden der Pollenbestimmung für Mitteleuropa und
                                                                             angrenzende Gebiete, Pfeil, München, 2004.
                                                                           Bottema, S.: Prehistoric cereal gathering and farming in the Near
Author contributions. PEJ, WDG, BHL, ACMJ and WTF de-                        East: the pollen evidence, Rev. Palaeobot. Palyno., 73, 21–33,
signed the study. PEJ carried out the sampling, generated and anal-          1992.
ysed the data, and led the writing of the paper with input from            Charmet, G.: Wheat domestication: lessons for the future, C. R.
WDG, BHL, ACMJ and WTF.                                                      Biol., 334, 212–220, https://doi.org/10.1016/j.crvi.2010.12.013,
                                                                             2011.
                                                                           Christensen, B. B.: Measurement as a means of identifying fossil
Competing interests. The authors declare that they have no con-              pollen, Danmarks Geologiske Undersøgelse (Series) IV, 3, 1–22,
flict of interest.                                                           1946.
                                                                           Crowther, A., Lucas, L., Helm, R., Horton, M., Shipton, C., Wright,
                                                                             H. T., Walshaw, S., Pawlowicz, M., Radimilahy, C., Douka, K.,
Acknowledgements. We thank Mike Ambrose at the John Innes                    Picornell-Gelabert, L., Fuller, D. Q., and Boivin, N. L.: Ancient
Centre for helping with pollen sampling. We also acknowledge sup-            crops provide first archaeological signature of the westward Aus-
port from the Open Access Publication Fund of the University of              tronesian expansion, P. Natl Acad. Sci. USA, 113, 6635–6640,
Münster.                                                                     https://doi.org/10.1073/pnas.1522714113, 2016.
                                                                           Cunniff, J., Wilkinson, S., Charles, M., Jones, G., Rees,
                                                                             M., and Osborne, C. P.: Functional traits differ between
Financial support. This research has been supported by the Nat-              cereal crop progenitors and other wild grasses gathered
ural Environment Research Council (grant no. NE/K005294/1).                  in the Neolithic fertile crescent, Plos One, 9, e87586,
                                                                             https://doi.org/10.1371/journal.pone.0087586, 2014.
                                                                           Cushing, E. J.: Size increase in pollen grains mounted in thin slides,
Review statement. This paper was edited by Luke Mander and                   Pollen et Spores, 3, 265–274, 1961.
reviewed by two anonymous referees.                                        Dell’Anna, R., Lazzeri, P., Frisanco, M., Monti, F., Malvezzi
                                                                             Campeggi, F., Gottardini, E., and Bersani, M.: Pollen discrim-
                                                                             ination and classification by Fourier transform infrared (FT-
                                                                             IR) microspectroscopy and machine learning, Anal Bioanal.
                                                                             Chem., 394, 1443–1452, https://doi.org/10.1007/s00216-009-
References                                                                   2794-9, 2009.
                                                                           Depciuch, J., Kasprzyk, I., Drzymała, E., and Parlinska-Wojtan, M.:
Andersen, T. S.: Identification of wild grasses and cereal pollen,           Identification of birch pollen species using FTIR spectroscopy,
  Danmarks Geologiske Undersoegelse, Arbog, 1978, 69–92,                     Aerobiologia, 34, 525–538, https://doi.org/10.1007/s10453-018-
  1979.                                                                      9528-4, 2018.
Andersen, T. S. and Bertelsen, F.: Scanning Electron Microscope            Dickson, C.: Distinguishing cereal from wild grass pollen: some
  Studies of Pollen of Cereals and other Grasses, Grana, 12, 79–             limitations, Circaea, 5, 67–71, 1988.
  86, https://doi.org/10.1080/00173137209428830, 1972.                     Domínguez, E., Mercado, J. A., Quesada, M. A., and Heredia, A.:
Bağcıoğlu, M., Zimmermann, B., and Kohler, A.: A multi-                    Isolation of intact pollen exine using anhydrous hydrogen fluo-
  scale vibrational spectroscopic approach for identification and            ride, Grana, 37, 93–96, 1998.
  biochemical characterization of pollen, Plos One, 10, 1–19,              Dvorak, J., Akhunov, E. D., Akhunov, A. R., Deal, K. R., and Luo,
  https://doi.org/10.1371/journal.pone.0137899, 2015.                        M. C.: Molecular characterization of a diagnostic DNA marker
Bağcıoğlu, M., Kohler, A., Seifert, S., Kneipp, J., Zimmermann,            for domesticated tetraploid wheat provides evidence for gene
  B., and McMahon, S.: Monitoring of plant-environment in-                   flow from wild tetraploid wheat to hexaploid wheat, Mol. Biol.
  teractions by high-throughput FTIR spectroscopy of pollen,                 Evol., 23, 1386–1396, https://doi.org/10.1093/molbev/msl004,
  Methods Ecol. Evol., 8, 870–880, https://doi.org/10.1111/2041-             2006.
  210x.12697, 2017.                                                        Faegri, K. and Deuse, P.: Size variations in pollen grains with dif-
Bell, B. A., Fletcher, W. J., Ryan, P., Seddon, A. W. R., Wogelius,          ferent treatment, Pollen et Spores, 2, 293–298, 1960.
  R. A., and Ilmen, R.: UV-B-absorbing compounds in mod-
  ern Cedrus atlantica pollen: The potential for a summer UV-

J. Micropalaeontology, 38, 83–95, 2019                                                          www.j-micropalaeontol.net//38/83/2019/
P. E. Jardine et al.: Chemotaxonomy of domesticated grasses 93 Firbas, F.: Der Pollenanalytysche Nachweis des Getreidebaus, Jardine, P. E., Gosling, W. D., Lomax, B. H., Julier, A. C. M., and Zeitschrift für Botanik, 31, 447–478, 1937. Fraser, W. T.: Data and code from “Chemotaxonomy of domes- Fraser, W. T., Scott, A. C., Forbes, A. E. S., Glasspool, I. ticated grasses: a pathway to understanding the origins of agri- J., Plotnick, R. E., Kenig, F., and Lomax, B. H.: Evolu- culture”, figshare, https://doi.org/10.6084/m9.figshare.8046395, tionary stasis of sporopollenin biochemistry revealed by un- 2019. altered Pennsylvanian spores, New Phytol., 196, 397-401, Joly, C., Barillé, L., Barreau, M., Mancheron, A., and Visset, L.: https://doi.org/10.1111/j.1469-8137.2012.04301.x, 2012. Grain and annulus diameter as criteria for distinguishing pollen Fraser, W. T., Watson, J. S., Sephton, M. A., Lomax, B. grains of cereals from wild grasses, Rev. Palaeobot. Palyno., 146, H., Harrington, G. J., Gosling, W. D., and Self, S.: 221–233, https://doi.org/10.1016/j.revpalbo.2007.04.003, 2007. Changes in spore chemistry and appearance with in- Julier, A. C. M., Jardine, P. E., Coe, A. L., Gosling, W. D., Lomax, creasing maturity, Rev. Palaeobot. Palyno., 201, 41–46, B. H., and Fraser, W. T.: Chemotaxonomy as a tool for inter- https://doi.org/10.1016/j.revpalbo.2013.11.001, 2014. preting the cryptic diversity of Poaceae pollen, Rev. Palaeobot. Fuller, D. Q.: Contrasting patterns in crop domestication Palyno., 235, 140–147, 2016. and domestication rates: recent archaeobotanical in- Kellogg, E. A.: Relationships of cereal crops and other grasses, P. sights from the Old World, Ann. Bot., 100, 903–924, Natl. Acad. Sci. USA, 95, 2005–2010, 1998. https://doi.org/10.1093/aob/mcm048, 2007. Köhler, E. and Lange, E.: A contribution to distinguishing cereal Gonzalez-Cruz, P., Uddin, M. J., Atwe, S. U., Abidi, N., and Gill, from wild grass pollen grains by LM and SEM, Grana, 18, 133– H. S.: Chemical Treatment Method for Obtaining Clean and In- 140, https://doi.org/10.1080/00173137909424973, 1979. tact Pollen Shells of Different Species, ACS Biomater. Sci. Eng., Kuhn, M.: caret: Classification and Regression Training, R pack- 4, 2319–2329, https://doi.org/10.1021/acsbiomaterials.8b00304, age version 6.0-77, available at: https://CRAN.R-project.org/ 2018. package=caret (last access: 5 June 2019), 2017. Gottardini, E., Rossi, S., Cristofolini, F., and Benedetti, L.: Use Larson, G., Piperno, D. R., Allaby, R. G., Purugganan, M. D., An- of Fourier transform infrared (FT-IR) spectroscopy as a tool for dersson, L., Arroyo-Kalin, M., Barton, L., Climer Vigueira, C., pollen identification, Aerobiologia, 23, 211–219, 2007. Denham, T., Dobney, K., Doust, A. N., Gepts, P., Gilbert, M. T., Holt, K. A. and Bebbington, M. S.: Separating morphologically Gremillion, K. J., Lucas, L., Lukens, L., Marshall, F. B., Olsen, similar pollen types using basic shape features from digital K. M., Pires, J. C., Richerson, P. J., Rubio de Casas, R., Sanjur, images: A preliminary study, Appl. Plant Sci., 2, 1400032, O. I., Thomas, M. G., and Fuller, D. Q.: Current perspectives and https://doi.org/10.3732/apps.1400032, 2014. the future of domestication studies, P. Natl. Acad. Sci. USA, 111, Holt, K. A. and Bennett, K. D.: Principles and meth- 6139–6146, https://doi.org/10.1073/pnas.1323964111, 2014. ods for automated palynology, New Phytol., 203, 735–742, Leff, B., Ramankutty, N., and Foley, J. A.: Geographic distribution https://doi.org/10.1111/nph.12848, 2014. of major crops across the world, Global Biogeochem. Cy., 18, Holt, K. A., Allen, G., Hodgson, R., Marsland, S., and Flen- GB1009, https://doi.org/10.1029/2003gb002108, 2004. ley, J.: Progress towards an automated trainable pollen Liland, K. H. and Mevik, B.-H.: baseline: Baseline Correction of location and classifier system for use in the palynol- Spectra, R package version 1.2-1, available at: https://CRAN. ogy laboratory, Rev. Palaeobot. Palyno., 167, 175–183, R-project.org/package=baseline (last access: 5 June 2019), 2015. https://doi.org/10.1016/j.revpalbo.2011.08.006, 2011. Loader, N. J. and Hemming, D. L.: Preparation of pollen for stable International Wheat Genome Sequencing Consortium: A carbon isotope analyses, Chem. Geol., 165, 339–344, 2000. chromosome-based draft sequence of the hexaploid bread Lomax, B. H., Fraser, W. T., Sephton, M. A., Callaghan, T. wheat (Triticum aestivum) genome, Science, 345, 1251788, V., Self, S., Harfoot, M., Pyle, J. A., Wellman, C. H., and https://doi.org/10.1126/science.1251788, 2014. Beerling, D. J.: Plant spore walls as a record of long-term Ivleva, N. P., Niessner, R., and Panne, U.: Characterization changes in ultraviolet-B radiation, Nat. Geosci., 1, 592–596, and discrimination of pollen by Raman microscopy, Anal. https://doi.org/10.1038/ngeo278, 2008. Bioanal. Chem., 381, 261–267, https://doi.org/10.1007/s00216- Mander, L. and Punyasena, S. W.: Grass pollen sur- 004-2942-1, 2005. face ornamentation: a review of morphotypes and Jardine, P. E. and Lomax, B. H.: Is pollen size a robust proxy for taxonomic utility, J. Micropalaeontol., 35, 121–124, moisture availability?, Rev. Palaeobot. Palyno., 246, 161–166, https://doi.org/10.1144/jmpaleo2015-025, 2016. https://doi.org/10.1016/j.revpalbo.2017.06.013, 2017. Mander, L., Li, M., Mio, W., Fowlkes, C. C., and Punyasena, S. W.: Jardine, P. E., Fraser, W. T., Lomax, B. H., and Classification of grass pollen through the quantitative analysis of Gosling, W. D.: The impact of oxidation on spore and surface ornamentation and texture, P. Roy. Soc. B-Biol. Sci., 280, pollen chemistry, J. Micropalaeontol., 34, 139–149, 20131905, https://doi.org/10.1098/rspb.2013.1905, 2013. https://doi.org/10.1144/jmpaleo2014-022, 2015. Mander, L., Baker, S. J., Belcher, C. M., Haselhorst, D. S., Ro- Jardine, P. E., Fraser, W. T., Lomax, B. H., Sephton, M. A., Shana- driguez, J., Thorn, J. L., Tiwari, S., Urrego, D. H., Wesseln, C. han, T. M., Miller, C. S., and Gosling, W. D.: Pollen and spores as J., and Punyasena, S. W.: Accuracy and consistency of grass biological recorders of past ultraviolet irradiance, Sci. Rep.-UK, pollen identification by human analysts using electron micro- 6, 1–8, https://doi.org/10.1038/srep39269, 2016. graphs of surface ornamentation, Appl. Plant. Sci., 2, 1400031, Jardine, P. E., Abernethy, F. A. J., Lomax, B. H., Gosling, W. D., https://doi.org/10.3732/apps.1400031, 2014. and Fraser, W. T.: Shedding light on sporopollenin chemistry, Marcussen, T., Sandve, S. R., Heier, L., Spannagl, M., Pfeifer, M., with reference to UV reconstructions, Rev. Palaeobot. Palyno., Consortium, T. I. W. G. S., Jakobsen, K. S., Wulff, B. B. H., 238, 1–6, https://doi.org/10.1016/j.revpalbo.2016.11.014, 2017. Steuernagel, B., Mayer, K. F. X., and Olsen, O.-A.: Ancient hy- www.j-micropalaeontol.net//38/83/2019/ J. Micropalaeontology, 38, 83–95, 2019
94                                                                      P. E. Jardine et al.: Chemotaxonomy of domesticated grasses

   bridizations among the ancestral genomes of bread wheat, Sci-           Reitsma, T. J.: Size modification of recent pollen grains under dif-
   ence, 345, 1250092, https://doi.org/10.1126/science.1251788,               ferent treatments, Rev. Palaeobot. Palyno., 9, 175–202, 1969.
   2014.                                                                   Rowley, J. R.: The Exine Structure of “Cereal” and
Mascher, M., Schuenemann, V. J., Davidovich, U., Marom, N.,                   “Wild” Type Grass Pollen, Grana Palynologica, 2, 9–15,
   Himmelbach, A., Hubner, S., Korol, A., David, M., Reiter,                  https://doi.org/10.1080/00173136009429441, 1960.
   E., Riehl, S., Schreiber, M., Vohr, S. H., Green, R. E., Daw-           Savard, M., Nesbitt, M., and Jones, M. K.: The role of wild
   son, I. K., Russell, J., Kilian, B., Muehlbauer, G. J., Waugh,             grasses in subsistence and sedentism: new evidence from
   R., Fahima, T., Krause, J., Weiss, E., and Stein, N.: Genomic              the northern Fertile Crescent, World Archaeol., 38, 179–196,
   analysis of 6,000-year-old cultivated grain illuminates the do-            https://doi.org/10.1080/00438240600689016, 2006.
   mestication history of barley, Nat. Genet., 48, 1089–1093,              Schulte, F., Lingott, J., Panne, U., and Kneipp, J.: Chemical char-
   https://doi.org/10.1038/ng.3611, 2016.                                     acterization and classification of pollen, Anal. Chem., 80, 9551–
Meyer, R. S. and Purugganan, M. D.: Evolution of crop species:                9556, https://doi.org/10.1021/ac801791a, 2008.
   genetics of domestication and diversification, Nat. Rev. Genet.,        Schulte, F., Mäder, J., Kroh, L. W., Panne, U., and Kneipp, J.:
   14, 840–852, https://doi.org/10.1038/nrg3605, 2013.                        Characterization of Pollen Carotenoids with in situ and High-
Meyer, R. S., DuVal, A. E., and Jensen, H. R.: Patterns and pro-              Performance Thin-Layer Chromatography Supported Resonant
   cesses in crop domestication: an historical review and quantita-           Raman Spectroscopy, Anal. Chem., 81, 8426–8433, 2009.
   tive analysis of 203 global food crops, New Phytol., 196, 29–48,        Schulte, F., Panne, U., and Kneipp, J.: Molecular changes
   https://doi.org/10.1111/j.1469-8137.2012.04253.x, 2012.                    during pollen germination can be monitored by Ra-
Meyer, D., Dimitriadou, E., Hornik, K., Weingessel, A., and                   man microspectroscopy, J. Biophotonics, 3, 542–547,
   Leisch, F.: e1071: Misc Functions of the Department of Statis-             https://doi.org/10.1002/jbio.201000031, 2010.
   tics, Probability Theory Group (Formerly: E1071), TU Wien, R            Sluyter, A.: Analysis of maize (Zea mays subsp. mays) pollen: nor-
   package version 1.6-8, available at: https://CRAN.R-project.org/           malizing the effects of microscope-slide mounting media on di-
   package=e1071 (last access: 5 June 2019), 2017.                            ameter determinations, Palynology, 21, 35–39, 1997.
Mundargi, R. C., Potroz, M. G., Park, J. H., Seo, J., Tan, E. L.,          Soreng, R. J., Peterson, P. M., Romaschenko, K., Davidse, G.,
   Lee, J. H., and Cho, N. J.: Eco-friendly streamlined process for           Zuloaga, F. O., Judziewicz, E. J., Filgueiras, T. S., Davis,
   sporopollenin exine capsule extraction, Sci. Rep.-UK, 6, 19960,            J. I., and Morrone, O.: A worldwide phylogenetic classifica-
   https://doi.org/10.1038/srep19960, 2016.                                   tion of the Poaceae (Gramineae), J. Syst. Evol., 53, 117–137,
Pappas, C. S., Tarantilis, P. A., Harizanis, P. C., and Polissiou,            https://doi.org/10.1111/jse.12150, 2015.
   M. G.: New Method for Pollen Identification by FT-IR Spec-              Steemans, P., Lepot, K., Marshall, C. P., Le Herisse, A., and Javaux,
   troscopy, Appl. Spectrosc., 57, 23–27, 2003.                               E. J.: FTIR characterisation of the chemical composition of Sil-
Petersen, G., Seberg, O., Yde, M., and Berthelsen, K.: Phylo-                 urian miospores (cryptospore and trilete spores) from Gotland,
   genetic relationships of Triticum and Aegilops and evidence                Sweden, Rev. Palaeobot. Palyno., 162, 577–590, 2010.
   for the origin of the A, B, and D genomes of common                     Stevens, A. and Ramirez-Lopez, L.: An introduction to the
   wheat (Triticum aestivum), Mol. Phylogenet. Evol., 39, 70–82,              prospectr package, R package Vignette, R package version 0.1.3,
   https://doi.org/10.1016/j.ympev.2006.01.023, 2006.                         available at: https://cran.r-project.org/web/packages/prospectr/
Piperno, D. R., Weiss, E., Holst, I., and Nadel, D.: Processing of            vignettes/prospectr-intro.pdf (last access: 5 June 2019), 2013.
   wild cereal grains in the Upper Palaeolithic revealed by starch         Strömberg, C. A. E.: Evolution of Grasses and Grass-
   grain analysis, Nature, 430, 670–673, 2004.                                land Ecosystems, Ann. Rev. Earth Pl. Sc., 39, 517–544,
Preece, C., Livarda, A., Wallace, M., Martin, G., Charles, M.,                https://doi.org/10.1146/annurev-earth-040809-152402, 2011.
   Christin, P. A., Jones, G., Rees, M., and Osborne, C. P.: Were          Tweddle, J. C., Edwards, K. J., and Fieller, N. R. J.: Multivari-
   Fertile Crescent crop progenitors higher yielding than other wild          ate statistical and other approaches for the separation of cereal
   species that were never domesticated?, New Phytol., 207, 905–              from wild Poaceae pollen using a large Holocene dataset, Veg.
   913, https://doi.org/10.1111/nph.13353, 2015.                              Hist. Archaeobot., 14, 15–30, https://doi.org/10.1007/s00334-
Preece, C., Livarda, A., Christin, P. A., Wallace, M., Martin, G.,            005-0064-0, 2005.
   Charles, M., Jones, G., Rees, M., and Osborne, C. P.: How did           Varmuza, K. and Filzmoser, P.: Introduction to Multivariate Statisti-
   the domestication of Fertile Crescent grain crops increase their           cal Analysis in Chemometrics, CRC Press, Boca Raton, 336 pp.,
   yields?, Funct. Ecol., 31, 387–397, https://doi.org/10.1111/1365-          2009.
   2435.12760, 2017.                                                       Venables, W. N. and Ripley, B. D.: Modern Applied Statistics with
Preece, C., Clamp, N. F., Warham, G., Charles, M., Rees, M., Jones,           S, Springer, New York, 2002.
   G., and Osborne, C. P.: Cereal progenitors differ in stand harvest      Vignola, C., Masi, A., Balossi Restelli, F., Frangipane, M.,
   characteristics from related wild grasses, J. Ecol., 106, 1286–            Marzaioli, F., Passariello, I., Stellato, L., Terrasi, F., and
   1297, https://doi.org/10.1111/1365-2745.12905, 2018.                       Sadori, L.: δ 13 C and δ 15 N from 14 C-AMS dated cereal
Pummer, B. G., Bauer, H., Bernardi, J., Chazallon, B., Facq, S.,              grains reveal agricultural practices during 4300–2000 BC at
   Lendl, B., Whitmore, K., and Grothe, H.: Chemistry and mor-                Arslantepe (Turkey), Rev. Palaeobot. Palyno., 247, 164–174,
   phology of dried-up pollen suspension residues, J. Raman. Spec-            https://doi.org/10.1016/j.revpalbo.2017.09.001, 2017.
   trosc., 44, 1654–1658, https://doi.org/10.1002/jrs.4395, 2013.          Watson, J. S., Septhon, M. A., Sephton, S. V., Self, S., Fraser, W. T.,
R Core Team: R: A language and environment for statistical com-               Lomax, B. H., Gilmour, I., Wellman, C. H., and Beerling, D. J.:
   puting, Vienna, Austria, R Foundation for Statistical Computing,           Rapid determination of spore chemistry using thermochemolysis
   2017.                                                                      gas chromatography-mass spectrometry and micro-Fourier trans-

J. Micropalaeontology, 38, 83–95, 2019                                                           www.j-micropalaeontol.net//38/83/2019/
P. E. Jardine et al.: Chemotaxonomy of domesticated grasses                                                                             95

  form infrared spectroscopy, Photochem. Photobiol., 6, 689–694,         Zimmermann, B.: Chemical characterization and identification of
  https://doi.org/10.1039/b617794h, 2007.                                  Pinaceae pollen by infrared microspectroscopy, Planta, 247,
Wei, T. and Simko, V.: R package “corrplot”: Visualization of a            171–180, https://doi.org/10.1007/s00425-017-2774-9, 2018.
  Correlation Matrix, R package version 0.84, available at: https:       Zimmermann, B. and Kohler, A.: Infrared spectroscopy
  //github.com/taiyun/corrplot (last access: 5 June 2019), 2017.           of pollen identifies plant species and genus as well
Weiss, E., Wetterstrom, W., Nadel, D., and Bar-Yosef,                      as environmental conditions, Plos One, 9, 1–12,
  O.: The broad spectrum revisited: evidence from plant                    https://doi.org/10.1371/journal.pone.0095417.t001, 2014.
  remains, P. Natl. Acad. Sci. USA, 101, 9551–9555,                      Zimmermann, B., Bagcioglu, M., Sandt, C., and Kohler, A.: Vi-
  https://doi.org/10.1073/pnas.0402362101, 2004.                           brational microspectroscopy enables chemical characterization
Willcox, G., Fornite, S., and Herveux, L.: Early Holocene cul-             of single pollen grains as well as comparative analysis of plant
  tivation before domestication in northern Syria, Veg. Hist.              species based on pollen ultrastructure, Planta, 242, 1237–1250,
  Archaeobot., 17, 313–325, https://doi.org/10.1007/s00334-007-            https://doi.org/10.1007/s00425-015-2380-7, 2015a.
  0121-y, 2007.                                                          Zimmermann, B., Tkalčec, Z., Mešić, A., and Kohler, A.:
Woutersen, A., Jardine, P. E., Bogotá-Angel, G., Zhang, H.-X., Sil-        Characterizing aeroallergens by infrared spectroscopy
  vestro, D., Antonelli, A., Gogna, E., Erkens, R. H. J., Gosling, W.      of fungal spores and pollen, Plos One, 10, 1–22,
  D., Dupont-Nivet, G., and Hoorn, C.: A novel approach to study           https://doi.org/10.1371/journal.pone.0124240, 2015b.
  the morphology and chemistry of pollen in a phylogenetic con-          Zimmermann, B., Tafintseva, V., Bağcıoğlu, M., Høegh
  text, applied to the steppe-desert taxon Nitraria L. (Nitrariaceae),     Berdahl, M., and Kohler, A.: Analysis of Allergenic Pollen
  PeerJ, 6, e5055, https://doi.org/10.7717/peerj.5055, 2018.               by FTIR Microspectroscopy, Anal. Chem., 88, 803–811,
Zimmermann, B.: Characterization of Pollen by Vibrational Spec-            https://doi.org/10.1021/acs.analchem.5b03208, 2016.
  troscopy, Appl. Spectrosc., 64, 1364–1373, 2010.

www.j-micropalaeontol.net//38/83/2019/                                                       J. Micropalaeontology, 38, 83–95, 2019
You can also read