CHENIERE ENERGY, INC - CORPORATE PRESENTATION January 2016 - Cheniere Energy: LNG

Page created by June Leonard
 
CONTINUE READING
CHENIERE ENERGY, INC - CORPORATE PRESENTATION January 2016 - Cheniere Energy: LNG
CHENIERE ENERGY, INC.
CORPORATE PRESENTATION   January 2016
CHENIERE ENERGY, INC - CORPORATE PRESENTATION January 2016 - Cheniere Energy: LNG
Forward Looking Statements
    This presentation contains certain statements that are, or may be deemed to be, “forward-looking statements” within the meaning of Section 27A of the Securities Act of 1933, as amended, and Section 21E of the
    Securities Exchange Act of 1934, as amended. All statements, other than statements of historical facts, included or incorporated by reference herein are “forward-looking statements.” Included among “forward-
    looking statements” are, among other things:
                statements regarding the ability of Cheniere Energy Partners, L.P. to pay distributions to its unitholders or Cheniere Energy Partners LP Holdings, LLC to pay dividends to its shareholders;
                statements regarding Cheniere Energy Inc.’s, Cheniere Energy Partners LP Holdings, LLC’s or Cheniere Energy Partners, L.P.’s expected receipt of cash distributions from their respective subsidiaries;
                statements that Cheniere Energy Partners, L.P. expects to commence or complete construction of its proposed liquefied natural gas (“LNG”) terminals, liquefaction facilities, pipeline facilities or other
                 projects, or any expansions thereof, by certain dates or at all;
                statements that Cheniere Energy, Inc. expects to commence or complete construction of its proposed LNG terminals, liquefaction facilities, pipeline facilities or other projects by certain dates or at all;
                statements regarding future levels of domestic and international natural gas production, supply or consumption or future levels of LNG imports into or exports from North America and other countries
                 worldwide, or purchases of natural gas, regardless of the source of such information, or the transportation or other infrastructure, or demand for and prices related to natural gas, LNG or other
                 hydrocarbon products;
                statements regarding any financing transactions or arrangements, or ability to enter into such transactions;
                statements relating to the construction of our proposed liquefaction facilities and natural gas liquefaction trains (“Trains”) and the construction of the Corpus Christi Pipeline, including statements
                 concerning the engagement of any engineering, procurement and construction ("EPC") contractor or other contractor and the anticipated terms and provisions of any agreement with any EPC or other
                 contractor, and anticipated costs related thereto;
                statements regarding any agreement to be entered into or performed substantially in the future, including any revenues anticipated to be received and the anticipated timing thereof, and statements
                 regarding the amounts of total LNG regasification, liquefaction or storage capacities that are, or may become, subject to contracts;
                statements regarding counterparties to our commercial contracts, construction contracts and other contracts;
                statements regarding our planned development and construction of additional Trains, including the financing of such Trains;
                statements that our Trains, when completed, will have certain characteristics, including amounts of liquefaction capacities;
                statements regarding our business strategy, our strengths, our business and operation plans or any other plans, forecasts, projections or objectives, including anticipated revenues, capital expenditures,
                 maintenance and operating costs, EBITDA, project EBITDA, project cash flow, distributable cash flow, deconsolidated cash flow, pre-tax cash flow and pre-tax cash flow per share, any or all of which are
                 subject to change;
                statements regarding projections of revenues, expenses, earnings or losses, working capital or other financial items;
                statements regarding legislative, governmental, regulatory, administrative or other public body actions, approvals, requirements, permits, applications, filings, investigations, proceedings or decisions;
                statements regarding our anticipated LNG and natural gas marketing activities; and
                any other statements that relate to non-historical or future information.
    These forward-looking statements are often identified by the use of terms and phrases such as “achieve,” “anticipate,” “believe,” “contemplate,” “develop,” “estimate,” “example,” “expect,” “forecast,” “goals,”
    “opportunities,” “plan,” “potential,” “project,” “propose,” “subject to,” “strategy,” “target,” and similar terms and phrases, or by use of future tense. Although we believe that the expectations reflected in these forward-
    looking statements are reasonable, they do involve assumptions, risks and uncertainties, and these expectations may prove to be incorrect. You should not place undue reliance on these forward-looking statements,
    which speak only as of the date of this presentation. Our actual results could differ materially from those anticipated in these forward-looking statements as a result of a variety of factors, including those discussed in
    “Risk Factors” in the Cheniere Energy, Inc., Cheniere Energy Partners, L.P. and Cheniere Energy Partners LP Holdings, LLC Annual Reports on Form 10-K filed with the SEC on February 20, 2015, which are
    incorporated by reference into this presentation. All forward-looking statements attributable to us or persons acting on our behalf are expressly qualified in their entirety by these ”Risk Factors.” These forward-looking
    statements are made as of the date of this presentation, and other than as required under the securities laws, we undertake no obligation to publicly update or revise any forward-looking statements.

2
CHENIERE ENERGY, INC - CORPORATE PRESENTATION January 2016 - Cheniere Energy: LNG
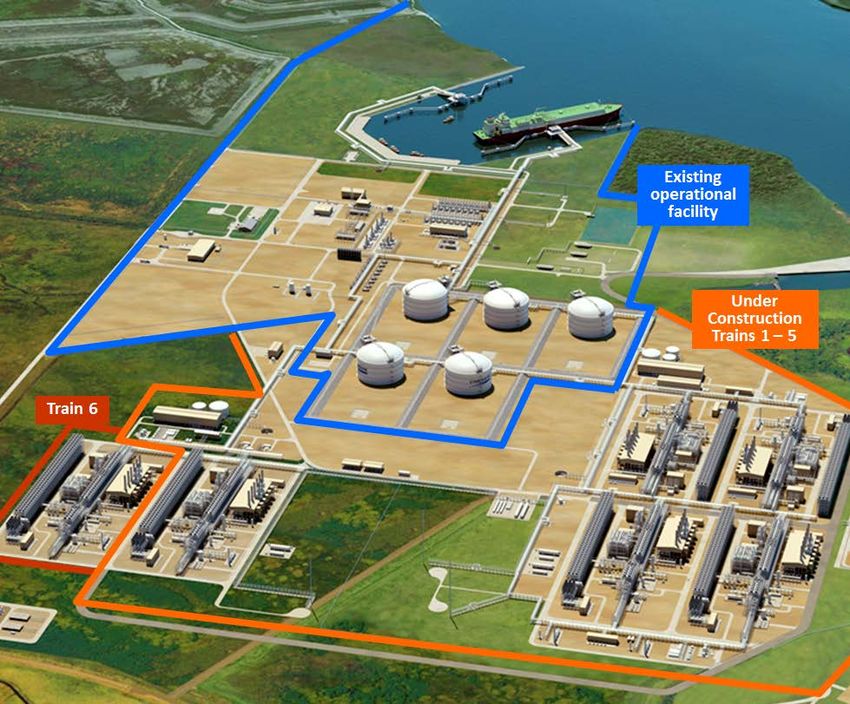
Cheniere LNG Platform Underway

     31.5 mtpa                   ~87%                        Cash flows from
     currently under             LNG volumes contracted      fixed fees -
     construction                                            not tied to
                                 20-year contracts with      commodity prices
                                 fixed fees, no price
     7 trains, design capacity   reopeners, and parent as    Long term SPAs support debt
     of 4.5 mtpa each            counterparty or guarantor   service coverage

     ~$30B                       ~$4.3B                      Flexible, Scalable,
     capital spend                                           Industry-leading
                                 annual fixed fees           platform
                                 Stable cash flows
     Significant investment in   underpinned by investment
     U.S. infrastructure         grade counterparties

3
CHENIERE ENERGY, INC - CORPORATE PRESENTATION January 2016 - Cheniere Energy: LNG
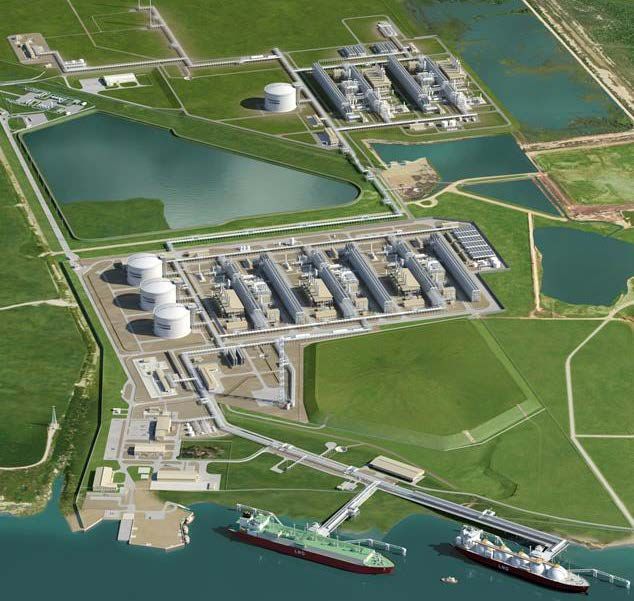
Executing on Strategy
     Complete construction on 7 LNG trains on an accelerated basis, on time and on budget

     Transition to an operating company, first cargo expected from Sabine Pass late February/March 2016

     Continue commercialization of additional LNG trains and excess LNG volumes

     Seek additional growth initiatives with emphasis on accretive projects and optimization of shareholder
      returns

4
CHENIERE ENERGY, INC - CORPORATE PRESENTATION January 2016 - Cheniere Energy: LNG
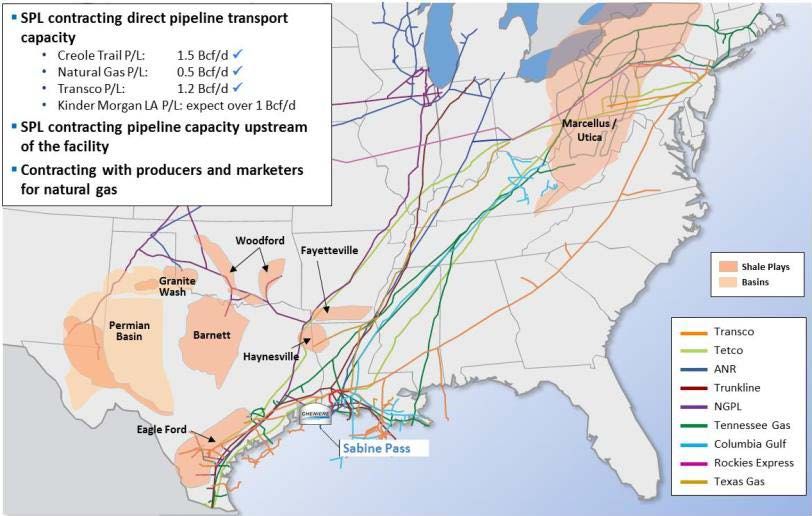
Cheniere Projected Cash Flow Build-Up With 7 Trains
                                                                                                                              CQP                                            CCL                            CEI Standalone
     ($ in billions, except per share amounts)                                                                      (SPL T1-5/ SPLNG/CTPL)                                 CCL T1-2

     Project EBITDA to CEI (net of minority interests)                                                                                                 $1.0*                                $1.3                                   $2.3

     Plus: Management fees to CEI                                                                                                                                                                                                    0.1

     Less: CEI G&A                                                                                                                                                                                                                 (0.3)

     CEI Standalone EBITDA                                                                                                                                                                                                         $2.1

     Less: CCL project interest expense                                                                                                                                                                                            (0.5)

     Less: CEI-level interest expense                                                                                                                                                                                              (0.0)

     Pre-tax CEI cash flow                                                                                                                                                                                                         $1.6

     Pre-tax CEI cash flow per share                                                                                                                                                                                            $5.8(1)

     Pre-tax CEI cash flow per share (no CMI sales)                                                                                                                                                                             $4.2(1)

     Estimates based on fixed fees underpinned by 20-year SPAs representing ~87% of capacity
     Remaining capacity estimated to be sold based on prevailing market spreads

    * Represents expected cash flows from ownership in CQP and CQH, net of interest expense
    Note: See “Forward Looking Statements” Slide. For supplementary financial details, see slide 26.
    Cash flow build up scenario above assumes refinancing of SPL and CCH credit facilities with non-amortizing project bonds and remaining equity requirements funded by operating cash flow and cash on hand.
    Scenario which includes CMI sales assumes market spreads of ~$2.50 as of December 2015.
    EBITDA, project EBITDA, pre-tax cash flow and pre-tax cash flow per share are non-GAAP measures. EBITDA is computed as earnings before interest, taxes, depreciation and amortization. We have not made any forecast of net income,
    which would be the most comparable financial measure under GAAP, and we are unable to reconcile differences between these forecasted non-GAAP measures and net income. Non-GAAP measures have limitations as an analytical
    tool and should not be considered in isolation or in lieu of an analysis of our results as reported under GAAP, and should be evaluated only on a supplementary basis.
    (1) Assumes ~277 million CEI shares outstanding – assumes conversion of $1.0 billion PIK Convertible Notes due 2021 and $1.0 billion Senior Secured Convertible Notes due 2025 at $93.64/share.

5
CHENIERE ENERGY, INC - CORPORATE PRESENTATION January 2016 - Cheniere Energy: LNG
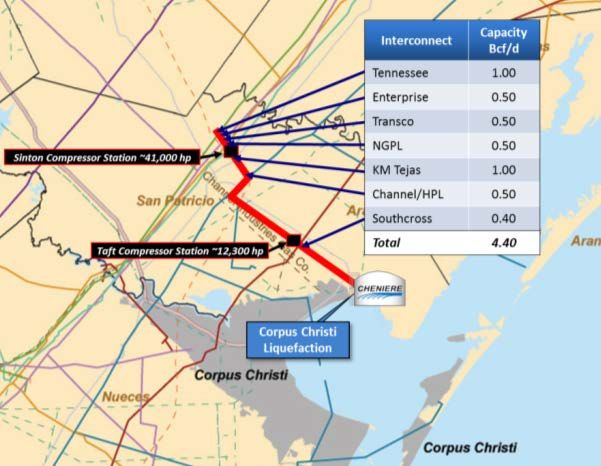
Maintenance & Operating Cost Estimates
     Maintenance Buildup for SPL (T1-5) and CCL (T1-2) Combined                         Estimated Annualized Amount
     ($ in mm, includes escalation averaged over 20 years)                                      (Cash basis)

     Ongoing labor expense                                                                                       $ 40

     GE contract(1) and other general maintenance contracts                                                       150

     Spare parts                                                                                                      30

     Other vendor contracts / maintenance support                                                                     20

     Capital maintenance budget                                                                                       30

     Total estimated annualized cash costs                                                                       $270

     Total as % of EPC capital costs                                                                            ~1.5%

     Amounts above include all expected maintenance costs for SPL and CCL on a combined basis (operating
      and capex) averaged over 20 years; estimated costs are ~1.5% of the total EPC costs of the trains
      (industry norm)
     GE covers highest risk components; turbines and compressor wear parts replaced every 6 years; SPL
      contract in place, CCL contract expected to be signed in 2016
           GE guarantees equipment performance and provides 24/7 monitoring services
     Property and equipment covered by comprehensive insurance to mitigate risk of expense due to damage,
      failure, natural disaster, etc.
     These expense estimates have been reviewed by the Lenders’ independent engineer
     Cheniere staff at SPL includes LNG industry experience of 47 professionals from 20 operating
      liquefaction terminals worldwide: ~600 years of liquefaction experience on site

(1) Estimate includes base cost, performance incentives, and escalation to 2020.

6
CHENIERE ENERGY, INC - CORPORATE PRESENTATION January 2016 - Cheniere Energy: LNG
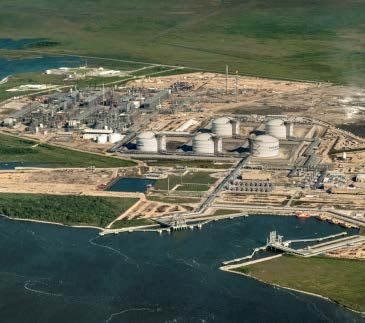
Cheniere Summary Organization

                                                                                                      Cheniere Energy, Inc.
    Public                                                                                             (NYSE MKT: LNG)
    19.9%

                      80.1% Interest                                           100% Interest                               100% Interest                                 100% Interest                                100% Interest

           Cheniere Energy Partners LP                                                                                   Cheniere                                    Corpus Christi
                  Holdings, LLC                                         Cheniere Energy                                Marketing, LLC                              Liquefaction, LLC                              Other Project
                                                                        Partners GP, LLC                                  (“CMI”)                                       (“CCL”)                                   Developments
               (NYSE MKT: CQH)

                                                                                                              • Int’l LNG marketing                         • Liquefaction facilities
                     55.9% Interest (1)
                                                               2.0% Interest & Incentive                      • SPAs with SPL and CCL                       • 9 mtpa under construction
                                                                      Dist. Rights                            • LNG vessel charters                         • 4.5 mtpa under
           Cheniere Energy Partners, L.P.                                                                                                                     development
                 (NYSE MKT: CQP)                                                                                                                            • 10.1 Bcf of storage
                                                                              Blackstone (BX) 29.0% (1)
                                                                                                                                                            • 2 berths
                                                                              Public 13.1% (1)

                            100% Interest

             Sabine Pass LNG, L.P.                                    Sabine Pass                                     Cheniere Creole Trail
                  (“SPLNG”)                                        Liquefaction, LLC                                     Pipeline, L.P.
                                                                        (“SPL”)                                            (“CTPL”)

       •     Regasification facilities                     • Liquefaction facilities                              • 1.5 Bcf/d capacity for SPL
       •     4.0 Bcf/d of capacity                         • 22.5 mtpa under construction                         • Provides gas supply for SPL
       •     17.0 Bcf of storage                           • 4.5 mtpa under development
       •     2 berths

Note: This organizational chart is provided for illustrative purposes only, is not and does not purport to be a complete organizational chart of Cheniere.
(1) Blackstone’s reported ownership interest is based solely on ownership of Class B units. As Class B units accrete Blackstone will increase its ownership percentage, and the public and CQH will have reduced ownership
      percentages.

7
CHENIERE ENERGY, INC - CORPORATE PRESENTATION January 2016 - Cheniere Energy: LNG
Cheniere’s Key Businesses
Unmatched scale and first-mover advantage provide industry-leading platform for further asset
integration

    LNG Platform
     Developing/constructing LNG terminals located along Gulf of Mexico
     7 Trains, 31.5 mtpa under construction; 2 Trains, 9.0 mtpa permitted, ready for commercialization
     Scalable platform
     SPL T1-5 and CCL T1-2 underpinned by long-term contracts with investment grade counterparties or
      parent guarantor

    Gas Procurement
     Providing feedstock for LNG production
     Redundant pipeline capacity ensures reliable gas deliverability
     Upstream pipeline capacity provides access to diverse supply sources

    Cheniere Marketing
     LNG sales provided to customers on a short, mid, and long-term basis
     Up to 9 mtpa LNG volumes expected from SPL T1-6 and CCL T1-3
     LNG offered DES or FOB, tied to indices such as Henry Hub, TTF and NBP
     LNG vessels chartered for DES sales
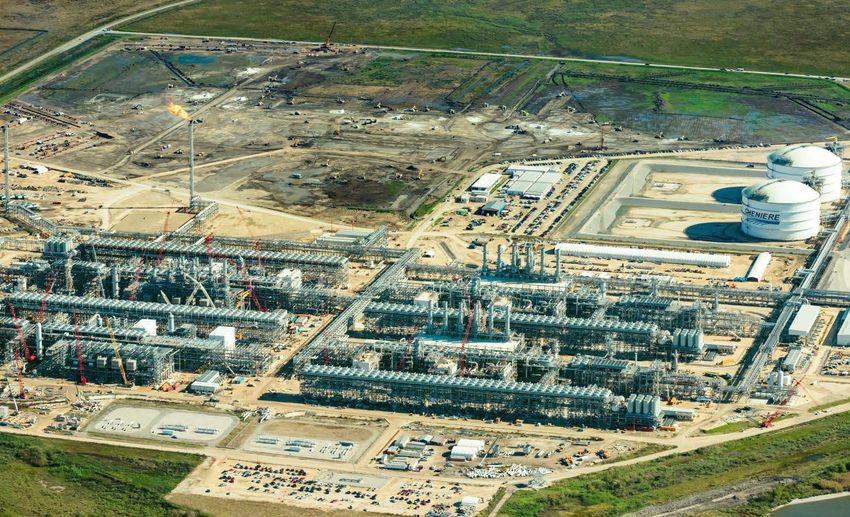
8
Cheniere LNG Platform Along Gulf Coast

                                             Sabine Pass Liquefaction Project
                                              6 train development – 27 mtpa
                                                 (~3.8 Bcf/d in export capacity)
                                              Trains 1-5 are under construction
                                              First LNG cargo expected late
                                                 February/March 2016

                                             Corpus Christi LNG Terminal
                                              5 train development – 22.5 mtpa
                                                 (~3.2 Bcf/d in export capacity)
                                                Trains 1-2 are under construction
                                                First LNG expected in late 2018
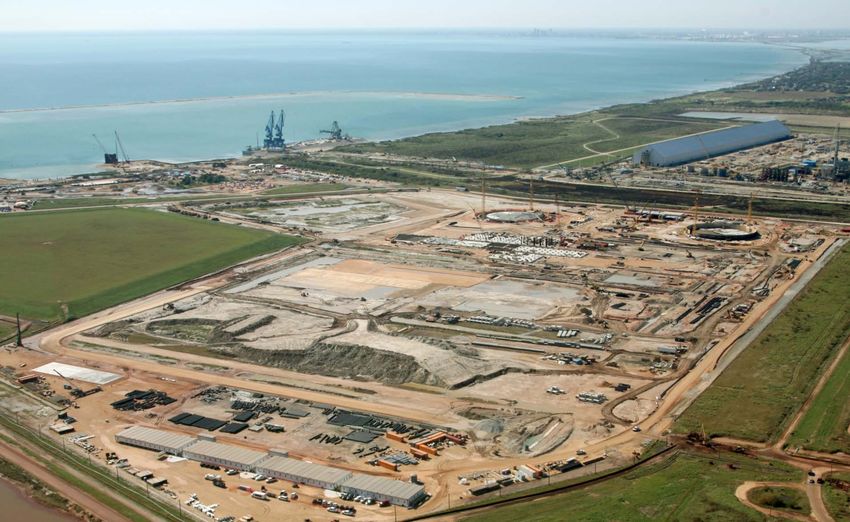
9
Aerial View of SPL Construction – December 2015

                                     Train 6 Under Development

                           Train 5

                                           T5 Soil Stabilization

                                                                   T1 Methane Cold Box
                 Train 3                                                        T1 Ethylene Cold Box

                                                                                         Air Coolers
                                                                                                       Propane Condenser Area

                                                                                                                        Train 1

     Train 4

                                                                                                                 Train 2
               T3-4 Gas Meter

                                               T1-2 Gas Meter

10
Aerial View of CCL Construction – December 2015

                                         Tank C             Tank B
                                                       Under Development      Tank A
                        T1 Foundation

                                                                           Train 1

                                                                 Train 2

                                                  Train 3
                                             Under Development

11
Cheniere LNG Projects: Attractive Features
  Cheniere LNG SPAs: LNG price tied to Henry Hub, offer destination flexibility, upstream gas procurement
   services, no lifting requirements
  SPAs with investment grade off-takers featuring parent as counterparty or guarantor & pricing with HH +
   fixed fee (no price reopeners)
  EPC contractor: proven track record of execution; proven liquefaction technology

Sabine Pass Customers

         BG Gulf Coast LNG      Gas Natural Fenosa          Korea Gas Corporation     GAIL (India) Limited   Total Gas & Power N.A.    Centrica plc

Corpus Christi Customers

          PT Pertamina                                                  Gas Natural        Woodside Energy         Électricité de     EDP Energias de
            (Persero)        Endesa S.A.         Iberdrola S.A.          Fenosa               Trading                 France           Portugal S.A.

12
Forecast Cheniere LNG Portfolio Summary
                                                             SPL                 CCL                       SPL       CCL
            (in MTPA)
     (in MTPA)                                            Trains 1-5          Trains 1-2
                                                                                               Total
                                                                                                          Train 6   Train 3
                                                                                                                              Total

      Design Capacity                                         22.5                9.0          31.5         4.5       4.5     40.5

      Under Construction                                      22.5                9.0          31.5          -         -      31.5

      LT SPAs sold to date                                   19.8                 7.7           27.4
                                                                                                             -       1.5(1)   28.8
      (% sold)                                           (~88% sold)          (~86% sold)   (~87% sold)

      Excess Volumes/CMI                                       2.7                1.3           4.1        TBD       TBD      TBD

   Trains under construction underpinned by long term SPAs
   Continuing commercialization of additional trains; FID expected upon, among other things, obtaining
    sufficient long term SPAs to underpin financing required and obtaining financing (permits already
    obtained)

(1) Includes ~0.7 mtpa contract with CMI for Central El Campesino in Chile.

13
CEI Standalone EBITDA Forecast with Additional Trains

    Illustrative cash flow build-up                                       ($ in billions)
                                                                                                                                                                                             Run-rate scenarios
                                                                                                                                                                          7 trains                    8 trains                   9 trains

      SPL T1-5/6 and SPLNG via GP/IDR and CQH                                                                                                                                $1.0*                      $1.0*                      $1.3*

      Management fees                                                                                                                                                        $0.1                        $0.1                       $0.1

      CCL T1-2/3                                                                                                                                                             $1.3                        $2.0                       $2.0
      CMI profit share                                                                                                                                                          -                           -                          -
      Total                                                                                                                                                                  $2.4                        $3.1                       $3.3
       Less CEI G&A                                                                                                                                                         ($0.3)                      ($0.3)                    ($0.3)

      CEI Standalone EBITDA                                                                                                                                                  $2.1                        $2.8                       $3.0

    Estimated EBITDA for CEI standalone based on addition of Train 8 (Corpus Christi Train 3) and Train 9
     (Sabine Pass Train 6)

* Represents expected cash flows from ownership in CQP and CQH, net of interest expense.
Note: See “Forward Looking Statements” Slide. For supplementary financial details, see slide 26
       Cash flow build up scenario above assumes refinancing of SPL and CCH credit facilities with non-amortizing project bonds and remaining equity requirements funded by operating cash flow and cash on hand.
       Scenario assumes full utilization of capacity available and excess volumes sold by CMI at prevailing market spreads of ~$2.50/mmbtu as of December 2015.
       8 train case assumes additional ~2.1MTPA of 20-year SPAs at $3.50/mmbtu on CCL Train 3; 9 train case assumes 1.5MTPA of 20-year SPAs at $3.50/mmbtu on SPL Train 6.
       EBITDA is a non-GAAP measure. EBITDA is computed as earnings before interest, taxes, depreciation and amortization. We have not made any forecast of net income, which would be the most comparable financial measure under GAAP, and we
       are unable to reconcile differences between forecasted EBITDA and net income. Non-GAAP measures have limitations as an analytical tool and should not be considered in isolation or in lieu of an analysis of our results as reported under GAAP, and
       should be evaluated only on a supplementary basis.

 14
Gas Procurement: Sabine Pass Terminal
  Securing feedstock for LNG
   production with balanced portfolio
   approach
      To date, have entered into term gas
       supply contracts with producers under
       1-7 year contracts aggregating
       approximately 2 Tcf.
      Supply contracts cover ~50% of the
       required daily load for Trains 1-4 at
       Sabine Pass
      Pricing averages HH - $0.10 discount
  Redundant pipeline capacity helps
   ensure reliable gas deliverability
      Secured firm pipeline transportation
       capacity of approximately ~4.2 Bcf/d
       of deliverability into Sabine Pass, or
       ~160% of the total load for Trains 1-4
  Upstream pipeline capacity provides
   access to diverse supply sources
      High degree of visibility into our ability
       to consistently deliver gas to Sabine
       Pass on a variable basis at Henry
       Hub flat

15
Gas Procurement: Corpus Christi Terminal
  CCL contracted long-term direct and upstream
   pipeline transport capacity for Trains 1 and 2
      –      Tennessee P/L:       0.3 Bcf/d 
      –      KM Tejas P/L:        0.25 Bcf/d 
                                                                         Marcellus /
      –      NGPL P/L:            0.385 Bcf/d                             Utica
      –      Transco P/L:         0.4 Bcf/d 
  Negotiating with producers for term gas supply                                      NGPL
                                                                                       Tennessee Gas
                                                                                       HPL
                                                                                       KM Tejas
                                                                                       Oasis
                                                                                       Enterprise
                                              Woodford

                              Granite
                              Wash

                                                           Haynesville
                   Permian              Barnett
                    Basin

                     Eagle Ford

                                                    Corpus Christi
     Shale Plays
     Basins

16
Cheniere Marketing
Platform for LNG sales - short, mid, long-term sales, FOB or DES basis

 Scale for up to 9 mtpa including
  LNG purchases from Cheniere                                                 London, U.K.
  terminals and other places
 SPAs with SPL and CCL for all LNG             Washington, D.C.
  volumes not sold to 3rd parties
 ~560 million MMBtu sold to date to
  investment-grade counterparties, 1-                                 Houston, TX                              Singapore
  5 yr. terms, prices linked to HH or
  European indices such as TTF, NBP
      ~150 million MMBtu at HH + fixed fee
      ~410 million MMBtu into Europe             Santiago, Chile

 Chartered LNG vessels for DES
  sales
 Developing complementary,
  high-value markets through
                                              Chartered LNG Vessels             SPA with SPL   SPAs with CCL
  small-scale asset investments
 Professional staff based in London,
  Houston, Washington, Santiago, and
  Singapore

17
LNG Market Prices Profitable for Cheniere
Cheniere can profitably sell LNG given lower prices
 Market price sensitivity

 Europe LNG Sale Price ($/MMBtu)                                                                        $5.00              $6.00   $7.00    $8.00

 Implied margin                                                                                         $1.00              $2.00   $3.00    $4.00

 Asia LNG Sale Price ($/MMBtu)                                                                          $7.00              $8.00   $9.00   $10.00

 Implied margin                                                                                         $2.00              $3.00   $4.00    $5.00

  As shown in sensitivity table above, Cheniere can profitably sell LNG into key demand centers even in
   periods of lower market prices
  If LNG prices remain at lower levels, we would expect global LNG demand to increase, thus signaling the
   need for more liquefaction projects
  Cheniere positioned as a low-cost supplier

Assumes Henry Hub price of $3.00/MMBtu, shipping cost to Europe of $0.50/MMBtu and shipping cost to Asia of $1.50/MMBtu.

18
Growth Projects
Leverage core competencies – platform for future growth projects

  ~$6B in near term major growth projects focused on expansions of liquefaction capacity

     Growth Project                                                                                     Estimated Unlevered Costs

     Corpus Christi Train 3                                                                                               ~$3B(1)

     Sabine Pass Train 6                                                                                                  ~$2.5B

     Total Growth Projects ready for commercialization                                                                    ~$5.5B

     Estimated Combined Unlevered cost per ton                                                                             ~$610

  Assessing additional project opportunities to drive future growth
          Permitting process initiated for Corpus Christi Trains 4 & 5
          Domestic gas pipeline infrastructure opportunities
          International infrastructure investments for projects where Cheniere would be the LNG supplier

(1) Based on current EPC contract.

19
Projected Global LNG Demand by 2025
Demand expected to increase 193 mtpa to 436 mtpa by 2025, a 6% CAGR
Average of 23 mtpa new liquefaction capacity needed each year(1)

                                                  Europe

                                          31        78      92

                                         2015      2020    2025

                                                                                    Asia
                                                                                                   305
                 Americas                                                             260
                                                                        184
           22       19       23
                                          Middle East/N. Africa
                                                                          2015       2020        2025
          2015     2020     2025                     10       17
                                            6
                                           2015     2020    2025

                                                                      Source: Wood Mackenzie
                                                                      Q3 2015 LNG Tool
                                                                      (1) Assumes 85% utilization of nameplate capacity

20
U.S. to Be One of Top Three LNG Suppliers
     Projected Liquefaction Capacity

                     94
                    mtpa

                                   ~50
                                   mtpa
                     64                                                                     77                                                  81
                    mtpa                                                                           68                                          mtpa
                    under           31.5                                                   mtpa   mtpa
       1.4          const.         mtpa
      mtpa                         under                                                                                            26
                                   const.                                                                                          mtpa
       2014         2025           2025                                                    2014    2025                            2014         2025
 United States Cheniere                                  AP     AP
                                                                                               Qatar                                Australia
                                Sabine Pass T1-6
                                Corpus Christi T1-5

                                                         MEG    MEG
                                                                       Rest of World
                                                                       Includes Existing and
                                                         AB     AB     Under Construction
                                                                       Projects
                                                                       2014: 171 mtpa
                                                                       2025: 189 mtpa
                                                         2014   2025
     Source: Wood Mackenzie Q3 2015, Cheniere research                                                    2014 Global LNG Liquefaction Capacity: ~37 Bcf/d

21
Cheniere Competitive Advantage: Low Cost
  The U.S. is one of the lowest cost natural gas providers in the world
  U.S. liquefaction project costs are also significantly lower due to less project development needed
  Breakeven LNG price for Cheniere LNG export facilities is one of the lowest compared to other proposed
   LNG projects

Estimated breakeven LNG pricing range, Delivered Ex-Ship to Asia

                            $20

                                                                                                                                                                                                           $16.70

                                                                                                            $14.70
     LNG prices ($/MMBtu)

                            $15
                                                                                                                                            $13.60
                                                                                                                                                                            $13.20

                                                                             $10.20                                                                                         $11.80                         $11.90
                            $10
                                                                                                                                            $11.20
                                              $8.50

                                                                                                             $8.80
                                                                              $8.40
                                              $7.50
                            $5
                                      Cheniere Gulf Coast                  West Africa                  Southeast Asia                    East Africa                 Western Canada                Northwest Australia

Source:                       Cheniere Research, Wood Mackenzie, company filings and investor materials.
Note:                         Breakeven prices derived assuming unlevered after-tax returns of 10% on all other projects over construction plus 20 years of operation at 90% utilization. Henry Hub at $3.00/MMBtu

22
In Summary
  Primary focus on completing construction of 7 LNG trains on an accelerated basis, on time and on
   budget

  2 additional trains fully permitted and ready for commercialization – Cheniere positioned to grow as
   low-cost provider to market with projected growing demand

  Cheniere volumes remain profitable in key LNG demand centers despite broad weakness in
   commodity markets

  Leverage core competencies to develop additional projects with emphasis on accretive projects and
   optimization of shareholder returns

23
CHENIERE ENERGY, INC.
APPENDIX
Cheniere’s Debt Summary – January 2016
      ($ in millions)
                                                                                                Cheniere Energy, Inc.                                               Convertible Debt
                                                                                                                                                                     $1,000 PIK Convertible Notes due 2021 (4.875%)
                                                                                                 (NYSE MKT: LNG)                                                     $625 Convertible Notes due 2045 (4.250%)

  Cheniere Energy Partners                                                                                                                                                              Trains 1-2 Equity
                                                                         CQP GP                               Cheniere Marketing, LLC                     Cheniere CCH                   $1,000 Senior Secured
      LP Holdings, LLC                                                   (& IDRs)                                      (CMI)                              Holdco II, LLC                  Convertible Notes due
     (NYSE MKT: CQH)                                                                                                                                                                      2025

                                                                                                                                                    Cheniere Corpus Christi             Trains 1-2 Debt
                                                        Cheniere Energy Partners,                                                                       Holdings, LLC                    ~$8,400 Credit Facility due
                                                          L.P. (NYSE MKT: CQP)                                                                              (CCH)                         20223

                                                                                                                      Sabine Pass                         Corpus Christi
      Sabine Pass LNG, L.P.                                   Creole Trail Pipeline                                                                     Liquefaction, LLC
                                                                                                                   Liquefaction, LLC
            (SPLNG)                                                  (CTPL)                                                                                   (CCL)
                                                                                                                         (SPL)
Sr Secured Notes                                         $400 Term Loan due 2017 (L+325)                     Trains 1-5 Debt                        Pertamina SPA (79.4 Tbtu / yr)
 $1,666 due 2016 (7.50%)                                                                                     $4,600 Credit Facilities due 20201    Endesa SPA (117.3 Tbtu / yr)
 $420 due 2020 (6.50%)                                                                                       $2,000 Notes due 2021 (5.625%)
                                                                                                              $1,000 Notes due 2022 (6.250%)        Iberdrola SPA (39.7 Tbtu / yr)
            Total TUA (1 Bcf/d)                             SPL Firm Transport (1.5 Bcf/d)                    $1,500 Notes due 2023 (5.625%)        Gas Natural (78.2 Tbtu / yr)
                                                                                                              $2,000 Notes due 2024 (5.750%)
                                                                                                              $2,000 Notes due 2025 (5.625%)         Woodside (44.1 Tbtu / yr)
          Chevron TUA (1 Bcf/d)
                                                                                                              $1,200 Working Capital Facility            EDF (40.0 Tbtu / yr)
                                                                                                               due 20202
              SPL TUA (2 Bcf/d)                                                                                                                          EDP (40.0 Tbtu / yr)
                                                                                                                   BG SPA (286.5 Tbtu / yr)
                                                                                                                                                               CMI SPA
(1) Includes $2,850 million term loan facility, $1,150 million Republic of Korea (“ROK”) covered facility
                                                                                                              Gas Natural SPA (182.5 Tbtu / yr)
and $600 million ROK direct facility. Interest on the term loan facility is L+175 bps during construction
and operation. Under the ROK credit facilities, interest includes L+175 on the direct portion and L+130          KOGAS SPA (182.5 Tbtu / yr)
on the covered portion during construction and operation. In addition, SPL will pay 45 bps for
insurance/guarantee premiums on any drawn amounts under the covered tranches. These credit                          GAIL (182.5 Tbtu / yr)
facilities mature on the earlier of December 31, 2020 or the second anniversary of Train 5 completion
date.
(2) Interest on the working capital facility is L+175.                                                              Total (104.8 Tbtu / yr)
(3) Interest on the term loan facility is L+225 bps during construction and L+250 bps during operation.
This credit facility matures on the earlier of May 13, 2022 or the second anniversary of project                   Centrica (91.3 Tbtu / yr)
completion date .
Note: This organizational chart is provided for illustrative purposes only, is not and does not purport to
be a complete organizational chart of Cheniere.
                                                                                                                           CMI SPA

 25
Cheniere Cash Flow Build-Up With 7 Trains
($ in billions, except for per share amounts)                                                                     CQP                          Corpus Christi
                                                                                                 (SPL T1-5/SPLNG/CTPL)                            (CCL T1-2)                                    Total                CEI standalone
CEI cash flow build up (2021 estimated amounts)
 Project EBITDA / Deconsolidated for standalone                                                                          $3.0                               $1.3                                $4.3                               $2.3(1)
 Less: Project-level interest expense                                                                                   ($1.0)                             ($0.5)                              ($1.5)                             ($0.5)
   Distributable cash flow from project                                                                                  $2.1                               $0.8                                $2.9                               $1.8
 % cash flows to CEI (Adjusted for minority interests)                                                                   49%                              100%
 Project cash flows to CEI (Adjusted for minority interests)                                                             $1.0                               $0.8                                                                   $1.8
   Total project cash flows to CEI                                                                                       $1.0                               $0.8                                                                   $1.8
 Plus: Management fees to CEI                                                                                                                                                                                                      $0.1(1)
 Less: CEI G&A                                                                                                                                                                                                                    ($0.3)(1)
                                                                                                                                                                                                                                        (3)
 Less: CEI-level interest expense                                                                                                                                                                                                 ($0.0)
 CEI cash flow                                                                                                                                                                                                                     $1.6
 CEI cash flow per share                                                                                                                                                                                                           $5.8
Current debt outstanding
 SPL and CCL project-level debt outstanding(2)                                                                         $13.1                                $8.4                              $21.5                                   –
 SPLNG and CTPL project-level debt outstanding                                                                          $2.5                                   –                               $2.5                                   –
                                                                                                                                                                                                                                       (3)
 CEI-level debt outstanding                                                                                                –                                   –                                  –                                $0.6
  Total debt outstanding                                                                                               $15.6                                $8.4                              $24.0                                $0.6

   Trains under construction financed with non-recourse project debt – SPL T1-5 (CQP) and CCL T1-2 (CEI)
   27.4 MTPA under 20-year SPAs; excess LNG assumed sold at current market prices and shipping rates
   For scenario above, estimated tax payments of ~15% of CEI pre-tax cash flow projected to start in
    2023/24
 Note: See “Forward Looking Statements” slide. Cash flow build up scenario above assumes refinancing of SPL and CCH credit facilities with non-amortizing project bonds.
 SPL, SPLNG, CTPL and CCL-level project debt shown above are non-recourse to CEI.
 EBITDA, project EBITDA, distributable cash flow, project cash flow, deconsolidated cash flow, pre-tax cash flow and pre-tax cash flow per share are non-GAAP measures. EBITDA is computed as earnings before interest, taxes, depreciation and
 amortization. We have not made any forecast of net income, which would be the most comparable financial measure under GAAP, and we are unable to reconcile differences between forecasted non-GAAP measures and net income. Non-
 GAAP measures have limitations as an analytical tool and should not be considered in isolation or in lieu of an analysis of our results as reported under GAAP, and should be evaluated only on a supplementary basis.
 (1) ~$2.3 billion of deconsolidated cash flow to CEI calculated as ~$1.0 billion of CQP distributable cash flow (net of minority interest), plus ~$1.3 billion of CCL Trains 1‐2 EBITDA. CEI standalone EBITDA is estimated to be ~$2.1 billion
       calculated as ~$2.3 billion of deconsolidated cash flow to CEI, plus $0.1 billion of management fees, less ~$0.3 billion of CEI G&A.
 (2) CCL project-level debt issued at Cheniere Corpus Christi Holdings, LLC (CCH) entity.
 (3) Assumes ~277 million CEI shares outstanding for 7-train case – assumes conversion of $1.0 billion PIK Convertible Notes due 2021 and $1.0 billion Senior Secured Convertible Notes due 2025 at $93.64/share.
 Source: Bloomberg, DTN ProphetX and Platts

26
Conversion - Class B and Subordinated Units
  Class B Units:
   Mandatory conversion: within 90 days of the substantial completion of Train 3
   Optional conversion by a Class B unitholder may occur at any of the following times:
            After 83 months from issuance of EPC notice to proceed
            Prior to the record date for a quarter in which sufficient cash from operating surplus is generated to distribute $0.425 to
             all outstanding common units and the common units to be issued upon conversion
            Thirty (30) days prior to the mandatory conversion date
            Within a 30-day period prior to a significant event or a dissolution

  Subordinated Units:
   Subordinated units will convert into common units on a one-for-one basis, provided that there are no
    cumulative common unit arrearages, and either of the below distribution hurdles is met:
            For three consecutive, non-overlapping four-quarter periods, the distribution paid from “Adjusted Operating Surplus”(1)
             to all outstanding units(2) equals or exceeds $0.425 per quarter
            For four consecutive quarters, the distribution paid from “Contracted Adjusted Operating Surplus”(1) to all outstanding
             units(2) equals or exceeds $0.638 per quarter

(1)   As defined in CQP’s partnership agreement.
(2)   Includes all outstanding common units (assuming conversion of all Class B units), subordinated units and any other outstanding units that are senior or equal in right of distribution to the subordinated units.

27
Sabine Pass Liquefaction Project (SPL)
                                                                                                    Current Facility
                                                                                                       ~1,000 acres in Cameron Parish, LA
                                                                                                       40 ft. ship channel 3.7 miles from coast
                                                                                                       2 berths; 4 dedicated tugs
                                                                                                       5 LNG storage tanks (~17 Bcfe of storage)
                                                                                                       5.3 Bcf/d of pipeline interconnection

                                                                                                    Liquefaction Trains 1 – 5: Fully Contracted
                                                                                                       Lump Sum Turnkey EPC contracts w/ Bechtel
                                                                                                       T1 & T2 EPC contract price ~$4.1B
                                                                                                          Overall project ~97% complete (as of 12/2015)
                                                                                                          Operations estimated 2016
                                                                                                       T3 & T4 EPC contract price ~$3.8B
                                                                                                          Overall project ~80% complete (as of 12/2015)
                                                                                                          Operations estimated 2017
                                                                                                       T5 EPC contract price ~$2.9B
                                                                                                          Construction commenced June 2015

                                                                                                    Liquefaction Train 6
Artist’s rendition                                                                                     FID upon obtaining commercial contracts and
Design production capacity is expected to be ~4.5 mtpa per train, using ConocoPhillips’ Optimized       financing
Cascade® Process

  Significant infrastructure in place including storage, marine and pipeline interconnection facilities; pipeline quality natural gas
                                              to be sourced from U.S. pipeline network

28
SPL Estimated Cash Flows
Trains 1-5 and Trains 1-6
 SPL estimated cash flows

 ($ in billions)                                                                                                                                   SPL Trains 1-5 SPL Trains 1-6
      Long term SPAs                                                                                                                                         $2.9           $3.2
      CMI SPA payment(1)                                                                                                                                               $0.4                            $0.9
                                                  (2)
      Commodity payments, net                                                                                                                                          $0.3                            $0.4
      Total SPL revenues                                                                                                                                               $3.6                            $4.4
                                          (3)
      SPLNG TUA payments                                                                                                                                              ($0.4)                         ($0.4)
      Plant O&M                                                                                                                                                       ($0.3)                         ($0.3)
                                (4)
      Plant maintenance capex                                                                                                                                         ($0.2)                         ($0.2)
      Pipeline costs (primary plant and upstream pipelines)                                                                                                           ($0.2)                         ($0.2)
      Total SPL operating expenses                                                                                                                                    ($1.1)                         ($1.2)
      SPL EBITDA                                                                                                                                                       $2.6                            $3.3
                                                                    (5)
      Less: Project-level interest expense                                                                                                                            ($0.8)                         ($0.9)
      SPL distributable cash flow to CQP                                                                                                                               $1.8                           $2.3

Note:    EBITDA and distributable cash flow are non-GAAP measures. EBITDA is computed as earnings before interest, taxes, depreciation and amortization. We have not made any forecast of net income, which
         would be the most directly comparable financial measure under GAAP, and we are unable to reconcile differences between forecasts of these non-GAAP measures and net income. Non-GAAP measures
         have limitations as an analytical tool and should not be considered in isolation or in lieu of an analysis of our results as reported under GAAP, and should be evaluated only on a supplementary basis.
         Assumes future long term contracting of additional 1.5 MTPA at SPL Train 6 (total of 21.25 MTPA of long term SPAs at SPL Trains 1-6) at $3.50 per MMBtu.
(1)      CMI SPA payment assumes 100% utilization at $3.00/MMBtu.
(2)      Assumes $5.00/MMBtu natural gas price and that off-takers lift 100% of their full contractual entitlement. Amounts are net of estimated natural gas to be used for the liquefaction process.
(3)      Includes payments related to reassignment of Total TUA SPLNG capacity and export fees paid to SPLNG.
(4)      Majority of costs shown are fixed and covered under multi-year service and supply agreements with equipment and service providers.
(5)      Assumes debt at SPL refinanced at 6.00% annual interest rate.

29
SPL Construction Schedules Trains 1 – 5

                                                                                BG DFCD

                                                                           April/May 2016
                                                                                              GN DFCD

                                                                            June 2016
                                                                                             KOGAS DFCD
     Early Engineering
                                                                                                Jun 2017
                                                                                            April 2017
                                                                                                            GAIL DFCD
                                                                                                                Mar 2018
                                                                                                    Sept 2017
                                                                                                                           TOTAL & CENTRICA DFCD
                                                                                                                                       Dec 2019
                                                                                                                                   Oct 2019

  Stage 1 (Trains 1&2) overall project progress as of Dec 2015 is 97.4% complete vs. Target Plan of 99.2%:
           Engineering, Procurement, Subcontracts and Construction are 100%, 100%, 87.1% and 96.2% complete against
            Target Plan of 99.9%, 100%, 93.1% and 99.6% respectively
  Stage 2 (Trains 3&4) overall project progress as of Dec 2015 is 79.5% complete vs. Target Plan of 85.7%:
           Engineering, Procurement, Subcontracts and Construction are 100%, 100%, 51.8% and 55.3% complete against
            Target Plan of 99.1%, 100%, 73.0% and 67.2% respectively
  Stage 3 (Train 5) overall project progress:
           NTP on Train 5 issued to Bechtel on June 30th
           Soil stabilization civil works are in progress and the current plan estimates Train 5 operational in 52 months from NTP

Note: Based on Guaranteed Substantial Completion Dates per EPC contract.

30
Sabine Pass Liquefaction SPAs
  ~20 mtpa “take-or-pay” style commercial agreements
  ~$2.9B annual fixed fee revenue for 20 years

                                        BG Gulf Coast LNG              Gas Natural Fenosa          Korea Gas Corporation            GAIL (India) Limited         Total Gas & Power N.A.             Centrica plc

Annual Contract
Quantity (MMbtu)                         286,500,000 (1)                   182,500,000                  182,500,000                    182,500,000                   104,750,000 (1)                91,250,000

Annual Fixed Fees (2)                     ~$723 MM (3)                     ~$454 MM                      ~$548 MM                       ~$548 MM                       ~$314 MM                     ~$274 MM

Fixed Fees $/MMBtu(2)                     $2.25 - $3.00                        $2.49                        $3.00                          $3.00                          $3.00                        $3.00

LNG Cost                                   115% of HH                      115% of HH                   115% of HH                     115% of HH                      115% of HH                   115% of HH

Term of Contract (4)                         20 years                        20 years                     20 years                        20 years                       20 years                     20 years

                                           BG Energy                       Gas Natural
Guarantor                                                                                                    N/A                            N/A                         Total S.A.                      N/A
                                          Holdings Ltd.                     SDG S.A
Guarantor/Corporate
                                             A-/A2/A-                   BBB/Baa2/BBB+                   A+/Aa3/AA-                    NR/Baa2/BBB-                    AA-/Aa1/AA-                   A-/Baa1/A-
Credit Rating (5)
Fee During Force
                                        Up to 24 months                 Up to 24 months                      N/A                            N/A                            N/A                          N/A
Majeure
                                     Train 1 + additional
Contract Start                                                                Train 2                      Train 3                         Train 4                        Train 5                      Train 5
                                  volumes with Trains 2,3,4
  (1) BG has agreed to purchase 182,500,000 MMBtu, 36,500,000 MMBtu, 34,000,000 MMBtu and 33,500,000 MMBtu of LNG volumes annually upon the commencement of operations of Trains 1, 2, 3 and 4, respectively.
  Total has agreed to purchase 91,250,000 MMBtu of LNG volumes annually plus 13,400,000 MMBtu of seasonal LNG volumes upon the commencement of Train 5 operations.
  (2) A portion of the fee is subject to inflation, approximately 15% for BG Group, 13.6% for Gas Natural Fenosa, 15% for KOGAS and GAIL (India) Ltd and 11.5% for Total and Centrica.
  (3) Following commercial in service date of Train 4. BG will provide annual fixed fees of approximately $520 million during Trains 1-2 operations and an additional $203 million once Trains 3-4 are operational.
  (4) SPAs have a 20 year term with the right to extend up to an additional 10 years. Gas Natural Fenosa has an extension right up to an additional 12 years in certain circumstances.
  (5) Ratings are provided by S&P/Moody’s/Fitch and subject to change, suspension or withdrawal at anytime and are not a recommendation to buy, hold or sell any security.

 31
Corpus Christi LNG Terminal
                                                                                               Proposed 5 Train Facility
                                                                                                  >1,000 acres owned and/or controlled
                                                                                   Initiated      2 berths, 4 LNG storage tanks
                                                                                 Development       (~13.5 Bcfe of storage)
                                                                                  Trains 4-5

                                                                                               Key Project Attributes
                                                                                                  45 ft. ship channel 14 miles from coast
                                                                                                  Protected berth
                                                                                                  Premier Site Conditions
                                                                                                  23-mile 48” and 42” parallel pipelines will connect
                                                                                                   to several interstate and intrastate pipelines

                                                                                               Liquefaction Trains 1-2: Under Construction
                                                                                                  Lump Sum Turnkey EPC contracts w/ Bechtel
                                                                             Train 3              T1 & T2 EPC contract price ~$7.5B
        Under                                                                                     Construction commenced May 2015
     Construction                                                                                 Operations estimated 2018
      Trains 1-2

                                                                                               Liquefaction Train 3: Partially Contracted
                                                                                                  0.8 mtpa contracted to date
                                                                                                  Targeting additional 2.1 mtpa
                                                                                                  FID upon obtaining commercial contracts and
                                                                                                   financing

                                                                                               Liquefaction Trains 4-5: Initiated Development
 Artist’s rendition
                                                                                                  Permit process started June 2015
Design production capacity is expected to be ~4.5 mtpa per train, using ConocoPhillips’
Optimized Cascade® Process

                                                    Commenced Construction on Trains 1-2 in May 2015

32
CCL Estimated Cash Flows
Trains 1-2 and Trains 1-3
     CCL estimated cash flows

     ($ in billions)                                                                                                                                   CCL Trains 1-2 CCL Trains 1-3
       Long term SPAs                                                                                                                                            $1.4           $1.9
                                      (1)
       CMI SPA payment                                                                                                                                                     $0.2                           $0.5
                              (2)
       Commodity payments, net                                                                                                                                             $0.1                           $0.1
       Total CCL revenues                                                                                                                                                  $1.7                           $2.5
       Plant O&M                                                                                                                                                         ($0.2)                          ($0.2)
                                 (3)
       Plant maintenance capex                                                                                                                                           ($0.1)                          ($0.1)
       Pipeline costs (primary plant and upstream pipelines)                                                                                                             ($0.1)                          ($0.2)
       Total CCL operating expenses                                                                                                                                      ($0.4)                          ($0.5)
       CCL EBITDA                                                                                                                                                          $1.3                           $2.0
                                                                       (4)
       Less: Project-level interest expense                                                                                                                              ($0.5)                          ($0.7)
       CCL distributable cash flow to CEI                                                                                                                                 $0.8                            $1.3

Note:       EBITDA and distributable cash flow are non-GAAP measures. EBITDA is computed as earnings before interest, taxes, depreciation and amortization. We have not made any forecast of net
            income, which would be the most directly comparable financial measure under GAAP, and we are unable to reconcile differences between
            forecasts of these non-GAAP measures and net income. Non-GAAP measures have limitations as an analytical tool and should not be considered in isolation or in lieu of an analysis of our results as reported
            under GAAP, and should be evaluated only on a supplementary basis.
             Assumes future long term contracting of additional ~2.1 MTPA at CCL Train 3 (total of 10.5 MTPA of long term SPAs at CCL Trains 1-3) at $3.50 per MMBtu.
(1)         CMI SPA payment assumes 100% utilization at $3.00/MMBtu.
(2)         Assumes $5.00/MMBtu natural gas price and that off-takers lift 100% of their full contractual entitlement. Amounts are net of estimated natural gas to be used for the liquefaction process.
(3)         Majority of costs shown related to service-based payments to be contracted over a multi-year term.
(4)         Assumes debt at CCL refinanced at 6.00% annual interest rate.

33
Corpus Christi Liquefaction Project Schedule

                                                                                             Train 1 DFCD

                                                                                                             Oct 2019
                                                                                      Feb 2019

                                                                                                                        Train 2 DFCD

                                                                                                                               July 2020
                                                                                                 June 2019

  Stage 1 (Trains 1&2) overall project progress as of December 2015:
          Engineering, Procurement, and Construction has progressed to 93.6%, 41.9%, and 2.2% compared to a plan of
           87.3%, 24.9%, and 3.7% respectively.
          NTP issued, construction commenced for Trains 1-2 in May 2015

Note: Based on Guaranteed Substantial Completion Dates per EPC contract.

34
Corpus Christi Liquefaction SPAs
  SPA progress: ~8.42 mtpa “take-or-pay” style commercial agreements
  ~$1.5B annual fixed fee revenue for 20 years

                                       PT Pertamina                                                                                               Woodside Energy           Électricité de   EDP Energias de
                                         (Persero)                 Endesa S.A.               Iberdrola S.A.          Gas Natural Fenosa              Trading                   France         Portugal S.A.
Annual Contract
Quantity (TBtu)                             79.36                     117.32                      39.68                      78.20                      44.12                  40.00             40.00

Annual Fixed Fees (1)                   ~$278 MM                   ~$411 MM                   ~$139 MM                   ~$274 MM                   ~$154 MM                ~$140 MM          ~$140 MM

Fixed Fees $/MMBtu (1)                     $3.50                      $3.50                       $3.50                      $3.50                      $3.50                  $3.50             $3.50

LNG Cost                               115% of HH                 115% of HH                  115% of HH                 115% of HH                 115% of HH              115% of HH        115% of HH

Term of Contract (2)                     20 years                    20 years                   20 years                   20 years                   20 years               20 years           20 years

                                                                                                                         Gas Natural                Woodside
Guarantor                                   N/A                        N/A                         N/A                                                                          N/A               N/A
                                                                                                                          SDG, S.A.               Petroleum, LTD
Guarantor/Corporate
                                     BB+/Baa3/BBB-              BBB/Baa2/BBB+              BBB/Baa1/BBB+              BBB/Baa2/BBB+             BBB+/Baa1/BBB+               A+/A1/A         BB+/Baa3/BBB-
Credit Rating (3)

Contract Start                       Train 1 / Train2                 Train 1              Train 1 / Train 2                Train 2                    Train 2                Train 2           Train 3

 (1) 12.75% of the fee is subject to inflation for Pertamina; 11.5% for Woodside; 14% for all others
 (2) SPA has a 20 year term with the right to extend up to an additional 10 years.
 (3) Ratings are provided by S&P/Moody’s/Fitch and subject to change, suspension or withdrawal at anytime and are not a recommendation to buy, hold or sell any security.

 35
FERC Applications for Liquefaction Projects
                                                            FERC               FERC                  FERC                          Scheduled                                    DOE
                                        Quantity                                                                       EIS /                                                                   Under
LNG Export Projects                                       Pre-filing         Application          Scheduling                       Date for EIS       FERC Approval            Non FTA
                                         Bcf/d                                                                          EA                                                                  Construction
                                                            Date               Date              Notice Issued                        or EA                                     Final

Sabine Pass Liquefaction T1-4              2.8             7/26/10              1/31/11             12/16/11            EA                                4/16/12               8/7/12          
Cameron LNG T1-3                            1.7            4/30/12             12/10/12             11/21/13            EIS          4/30/14              6/19/14               9/10/14         
                                            1.4
Freeport LNG
                                            0.4
                                                          12/23/10              8/31/12              1/6/14             EIS          6/16/14              7/30/14              11/14/14         
Dominion Cove Point LNG                     1.0             6/1/12              4/1/13               3/12/14            EA           5/15/14              9/29/14                5/7/15         
Corpus Christi Liquefaction T1-3           2.1            12/13/11              8/31/12             2/12/14             EIS          10/8/14             12/30/14               5/12/15       T1-2:  
Sabine Pass Liquefaction T5-6              1.38            2/27/13              9/30/13             11/03/14            EA           12/12/14             4/6/15                6/26/15        T5:
Jordan Cove Energy                       1.2/0.8           2/29/12              5/22/13              7/16/14            EIS          9/30/15

Oregon LNG                                 1.25             7/3/12              6/7/13               4/17/15            EIS          2/12/16

Lake Charles LNG                            2.0            3/30/12              3/25/14              1/26/15            EIS          8/14/15             12/17/15

Magnolia                                   1.08            3/20/13              4/30/14              4/30/15            EIS          11/16/15

Southern LNG                                0.5            12/5/12              3/10/14                                 EA

Golden Pass                                 2.6            5/16/13              7/7/14               6/26/15            EA            3/4/16

Gulf LNG                                    1.3            12/6/12              6/19/15                                 EIS

Cameron LNG Expansion T4-5                 1.4             2/24/15              9/28/15                                 EIS

  6 projects have received FERC approval and final DOE approval for Non FTA

Source: Office of Fossil Energy, U.S. Department of Energy; U.S. Federal Energy Regulatory Commission; Company releases
Note: National Environmental Policy Act (NEPA) empowers FERC as the lead Federal agency to prepare an Environmental Impact Statement in cooperation with other state and federal agencies

36
U.S. LNG Export Projects
                                                                                                                                                   Quantity
                                                                                                                         Company                                   DOE         FERC       Contracts
                                                                                                                                                    (Bcf/d)

                                                                                                                         Cheniere Sabine                                                     Fully
                                                                                                                                                      2.2          Fully permitted
                                                                                                                         Pass T1 – T4                                                     Subscribed
         Oregon LNG                                                                                                                                                                          Fully
                                                                                                                         Freeport                     1.8          Fully permitted        Subscribed

                                                                                                                                                                                             Fully
                                                                                                                         Lake Charles                 2.0          FTA                   Subscribed
Jordan Cove                                                                                      Dominion Cove Point     Dominion Cove                                                       Fully
                                                                                                                                                      1.0          Fully permitted
                                                                                                                         Point                                                            Subscribed

                                                                                                                                                                                             Fully
                                                                                                                         Cameron LNG T1-3             1.7          Fully permitted        Subscribed
                                                   Lake Charles
                                                                                                Southern LNG
                                               Golden Pass                                                               Jordan Cove                 1.2/0.8       FTA         
                                                                              Gulf LNG
                                            Freeport LNG
                                                                                                                         Oregon LNG                   1.25         FTA         
                                                                              Magnolia
                                     Corpus Christi                      Cameron LNG                                     Cheniere Corpus                                                   Partially
                                                                                                                                                      2.1          Fully permitted
                                                                                                                         Christi T1 – T3                                                  Subscribed
                                                                   Sabine Pass
                                                                                                                         Cheniere Sabine                                                      T5
                                                                                                                                                      1.3          Fully permitted
                                                                                                                         Pass T5 – T6                                                     Subscribed

                                                                                                                                                                                             Fully
                                                                                                                         Southern LNG                 0.5          FTA                   Subscribed

                                                                                                                                                                                           Partially
                                                                                                                         Magnolia LNG                 0.5          FTA                   Subscribed
          Under Construction

          Filed FERC Application                                                                                                                                                             Fully
                                                                                                                         Golden Pass LNG              2.0          FTA                   Subscribed

                                                                                                                         Gulf LNG                     1.3          FTA         

                                                                                                                         Cameron LNG T4-5             1.4          FTA         
                                                                                                                       Plus other proposed LNG export projects that have not filed a FERC application.
     Source: Office of Oil and Gas Global Security and Supply, Office of Fossil Energy, U.S. Department of Energy;     Excelerate has requested that FERC put on hold the review its application.
     U.S. Federal Energy Regulatory Commission; Company releases
                                                                                                                       Application filing = v   FERC scheduling notice issued = 

37
CHENIERE ENERGY, INC.
INVESTOR RELATIONS CONTACTS

Randy Bhatia
Director, Finance and Investor Relations – (713) 375-5479, randy.bhatia@cheniere.com

Katy Cox
Senior Analyst, Investor Relations – (713) 375-5079, katy.cox@cheniere.com
You can also read