Cherwell District Council State of the District's Housing 2018
←
→
Page content transcription
If your browser does not render page correctly, please read the page content below
Appendix 4

Cherwell District Council
State of the District’s Housing 2018
CONTENTS
                                                                     Page

1.   Introduction                                                       3

2.   People: our population, housing demand and local housing need      4

     2.1 Population and migration
     2.2 Local housing demand and need
     2.3 Housing needs of specialist groups in the population

3.   Place: our housing stock and housing supply                       20

     3.1 Existing housing stock
     3.2 Housing supplu]y

4.   Conclusion                                                        37

     Appendix 1                                                        38

                                             2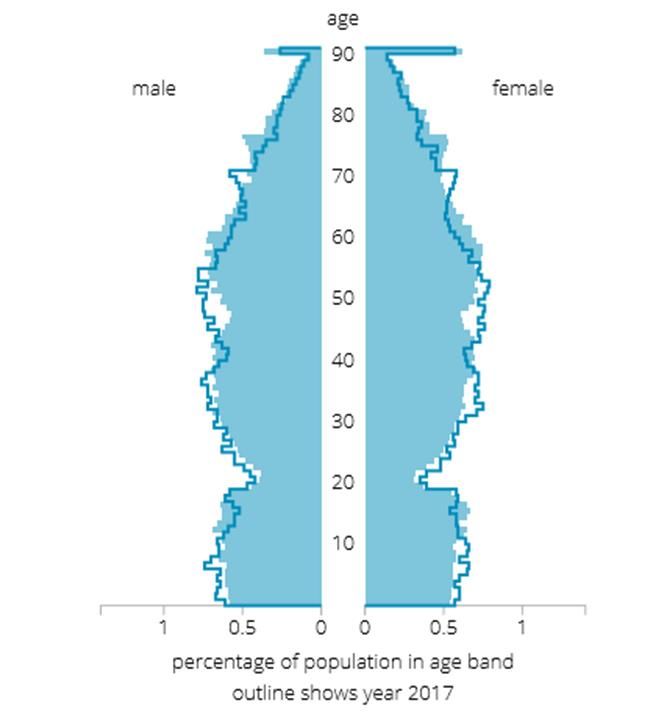
1.     Introduction
Cherwell district lies in the South East of England at the north-eastern edge of Oxfordshire.
The district is predominantly rural in character covering an area of 227 square miles.There
are two major towns, Banbury and Bicester, Kidlington (a large village) and 72 smaller
villages.

This State of the District’s Housing Report provides an evidence base regarding housing
issues across the district. It outlines some of the key findings about housing needs in the
district and informs our new Housing Strategy.

The report covers the main aspects of the local housing market, including housing need and
demand, the condition of the housing stock and affordability issues. It sets out the housing
challenges, threats and opportunities for the district. The report presents various data sets
and provides a commentary to illustrate what the data means in terms of future planning and
housing delivery.

This report does not include detailed homelessness data as this area was covered in a
comprehensive review of homelessness undertaken between December 2017 and April
2018. This homelessness review informed our new Homelessness Strategy 2018-2020 and
can      be      found      at      https://www.cherwell.gov.uk/info/55/strategy-policy-and-
development/544/homelessness-review-and-strategy

For any further information, please contact the council’s Housing Strategy and Partnerships
Team via the details below:

Housing Strategy and Partnerships Team
Cherwell District Council
Bodicote House
Bodicote
OX16 4AA
Tel: 01295 227004
Email: housing@cherwell-dc.gov.uk

                                             3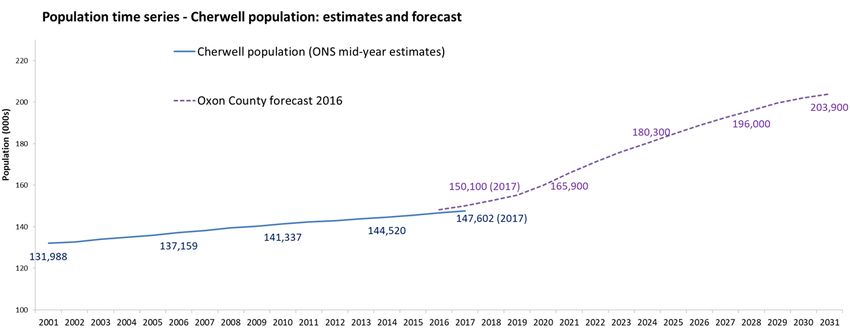
2. People: our population, housing demand and
local housing need
2.1 Population and migration
Changes in population can occur either naturally (births and deaths) or through migration into
and out of the area. Population growth and composition are important as they influence the
amount, type and tenure of housing required in an area. This section uses data from the
Office for National Statistics mid-year population estimates 2017 (unless stated otherwise).
2.1.1 National Context
Before considering local data for Cherwell it is useful to look at the national trends, which can
provide a useful baseline and additional context.
The population of the UK at 30 June 2017 exceeded 66 million people
(66,040,229), an increase of 392,000 people since mid-2016. This represents a
growth rate of 0.6% per year, the lowest since mid-2004. The trend of decreasing
national growth is expected to continue, as household size and fertility rates are
expected to reduce over time. However, the population will continue to grow as
life expectancy increases.
41% of the population growth occurred from natural change (births minus deaths)
and 59% through net internal migration1.
2.1.2 Local Context – Population Change
The current population of Cherwell district is estimated at 147,602.
Since last year it is estimated that the population of Cherwell district increased by 967 (0.7%
- this is above the 0.6% UK growth rate) from 146,635 to 147,602. By comparison the
population growth for Oxfordshire over the last year was 0.6% (Oxfordshire’s population is
now 682,444). In the last year:
There were 1,768 births and 1,256 deaths in Cherwell. This makes natural change
(the difference between births and deaths) 512.
There were 8,681 internal in-migrants and 8,397 internal out-migrants. This makes
net internal migration 284.
There were 1,054 international in-migrants and 936 international out-migrants. This
makes net international migration 118.
Changes to special populations (home armed forces, foreign armed forces and the
prison population) increased the population of Cherwell by 59.
69% of the population of Cherwell live in the rural areas
For the first time since 2004 Cherwell has seen a net gain (+284) in the number of internal
migrants (people moving from other districts within the UK). According to the ONS data, the
majority of internal migrants in 2015/16 moved from Oxford. As Oxford is experiencing
extremely high levels of housing unaffordability (among the highest in the country), this could
be a significant driver.
Net international migration is also a significant driver of population growth in Cherwell, and
for 2017 it has been at its lowest levels (+118) since the ONS started publishing this statistic
(2001-02). Nationally there has been a reduction in net international migration too. This is
the first year where we have seen the potential effects of the Brexit vote in both local and
national population statistics.
1
Internal migration definition - Migration within the UK - Residential moves between different geographic areas
within the UK sourced from the NHS Patient Register, the NHS Central Register (NHSCR) and the Higher
Education Statistics Agency (HESA).
4There are some notable changes relating to surrounding districts. Cherwell has a close
economic relationship with Oxford City, so it is interesting to note that the population of
Oxford has decreased by 710 (less than -0.5%). This is largely due to high levels of internal
and international out migration from younger age groups (less than 30 years old).
2.1.3 Local Context - Population Age Profile - Population pyramids are an easy and
simple way of viewing the internal distributions of gender and age characteristics within an
area.
Population age structure by single year of age and sex for Cherwell, mid-2017 to mid-2023.
Source: Subnational population projections for England: (2016-based)
Cherwell’s population pyramid has some interesting features. In the higher age bands, there
is a noticeable larger proportion of females than males. This is largely due to differences in
life expectancy. However over time the ratio of males to females is expected to increase,
reflecting a fall in the proportion of males who smoke or hold a higher risk occupation. There
is also a significant (although historically consistent) decrease in the number of younger
people aged 18-23. This is mainly due to further education students moving to university
towns.
The 2017 median age of the population of Cherwell was 40.9 years compared to a national
median of 39.8.
2.1.4 Population distribution - the population of Cherwell of 147,602, is located across
the district as follows:
- Banbury: 47,710 (32%)
- Bicester: 30,910 (21%)
5- Kidlington: 13,790 (9%)
- Other rural villages: 55,192 (38%)
The population for Bicester has not fallen since the Cenus 2011 as the figure above
suggests. The increase in housebuilding on the perimeter of Bicester is not included within
the Census boundary definition, hence the apparent reduction in population.
2.1.5 Resident Population - Household Composition
The household composition of the district’s population (Census 2011) is outlined below:
Half the population are either married or co-habiting households under 65 years old. 25%
(14,307 people) of the population are single person households. The remaining 25%
comprise lone parents (4,930 people), older persons over 65 years old (5,122 people) and
other household types (3,858). Approximately half of married couples in the district have
dependent children.
2.1.6 Future trends – Population and migration
There are different data sources we can refer to in relation to population forecasts: ONS
mid-year population estimates; and Oxfordshire County Council figures. All these data
sources predict that the population will grow but they differ in terms of the amount of
population growth expected (see graph below).
6Sources used: Oxfordshire County Council Forecasts - http://insight.oxfordshire.gov.uk/cms/population-0 - This forecast comes from Oxfordshire County Council's Research and Intelligence Unit. Unlike the SHMA figures, these include the population effects of the reallocation of Oxford City’s unmet housing need. This incorporation makes the figures vary from the SHMA population forecast which were undertaken prior to work around the unmet housing need. ONS Mid year estimates - The mid-year estimates use the 2011 Census for the population base and the ONS then apply a method which incorporates natural change (births and deaths), net international migration and net internal migration, and other adjustments (for example, changes in armed forces numbers) to produce the annual estimates.
Oxfordshire County Council forecasts a population of 203,900 in Cherwell by 2031, an
increase of 38%. These population forecasts take into account the ambitious homebuilding
outlined in the Local Plan for the council, which is the main driver for the forecast increase in
population.
The Office for National Statistics (ONS) population projections which are entirely based on
trend data and do not take into consideration the housebuilding of local authorities, predicts
growth for the next 25 years will be approximately 8.7%. This means the population would be
160,443 in 2043.
2.1.7 Index of Multiple Deprevation
Cherwell is a relatively affluent district which ranks positively for many socio-economic
measures, for instance unemployment, life expectancy, and homelessness. However, these
district wide statistics often stand in contrast with pockets of deprivation found within
Cherwell; these geographical areas of inequality are highlighted by the Indices of Multiple
Deprivation 20152, with the highest areas of deprivation particularly focused in the Banbury
area. Banbury contains 4 LSOAs in the highest quintile (20%) of deprivation nationally.
These LSOAs are clustered within the Brighter Futures in Banbury wards of Ruscote and
Grimsbury and Castle.
Bicester also contains areas of deprivation; however these LSOAs are not as concentrated
as in Banbury, making a directed ward-centric approach to address the deprivation (similar to
that of Brighter Futures in Banbury) more difficult.
2.2 Local Housing Demand and Need
2.2.1 Demand
Historically there has been strong demand for housing in Cherwell district. The growing
population and decreasing household sizes is set to increase demand further.
2.2.2 Need for affordable housing
The main source for identifying housing demand and need in Cherwell district is the
Oxfordshire Strategic Housing Market Assessment. This provides projected annual need for
market and affordable housing in the area.
In the urban areas (mainly Banbury and Bicester) this, together with housing register data
(house type/size requirements for a specific area) is generally sufficient as a guide to
housing need.
In the rural areas a variety of sources will be considered to determine an appropriate
affordable need/housing mix. This includes looking at:
The existing affordable homes stock profile
The housing register
Neighbourhood plans
Parish level housing need surveys
Currently, parish level housing need surveys are usually parish/developer led, that is they are
carried out by the council on request, rather than the council initiating the work. This happens
2
The English Indices of Deprivation 2015 is the most recent official measure of relative deprivation across small
areas of England (LSOAs are used). A higher score indicates that an area is experiencing high levels of
deprivation. It is important to note that the IMD is primarily designed to compare rankings between LSOAs, and as
such there are some limitations when using it to measure deprivation. An area may have become less deprived in
absolute terms, but more deprived relative to other areas in England so may show as being more deprived in the
IMD scores.to either support or refute a perceived need for affordable housing in the local community
and are a material consideration in determining the outcome of planning applications. The
surveys are carried out in-house by the council.
2.2.3 Strategic Housing Market Assessment
The Oxfordshire Strategic Housing Market Assessment (SHMA) is a crucial part of
the evidence base that informs policy and helps strategic thinking in housing and planning.
The SHMA provides an assessment of the future need for housing based on facts and
unbiased evidence. The latest version was published in 2014 and identified a need for
between 93,560 and 106,560 additional homes across Oxfordshire over the period 2011–
2031. This overall need for new homes has been broken down at a local authority level.
Housing Needed per Year Housing Need per year Midpoint of Range
(2011-31) (net)
Cherwell 1090-1190 1140
Oxford 1200-1600 1400
South Oxfordshire 725-825 775
Vale of White Horse 1028 1028
West Oxfordshire 635-685 660
Oxfordshire 4678-5328 5003
As well as considering the overall need for housing, the SHMA considers what mix of
housing is needed. It assesses the need for different types of affordable housing, for different
sizes of homes (both market and affordable) and the needs of specific groups in the
population, including older people.
The SHMA indicates a need to deliver 2,370 affordable homes a year across Oxfordshire on
the basis that all households who cannot meet their needs in the housing market are
allocated an affordable home (assuming that households will spend up to 35% of their gross
income on housing costs). At a district level the amount of affordable housing necessary to
meet the affordable housing need identified is 407 units per annum (this equates to 35% of
overall delivery).
The assessment also indicates that the mix of affordable housing sought on development
sites should be 25% intermediate housing3 and 75% rented. The rented affordable housing
should be focused slightly more towards social rent than affordable rent. However, the
assessment highlights that in setting policies and negotiating affordable housing provision on
development sites the council needs to consider development viability, national affordable
housing policy and funding availability.
As well as the type of housing required, the assessment concludes that the following size of
homes across the housing market area is appropriate:
1 bed 2 bed 3 bed 4 bed
Market 5% 25% 45% 25%
Affordable 25-30% 30-35% 30-35% 5-10%
All dwellings 15% 30% 40% 15%
3
The term 'intermediate housing' describes a range of homes for sale and rent provided at a cost above social
rent, but below market levels subject to the criteria in the National Planning Policy Framework’s affordable
housing definition. These can include shared equity (shared ownership and equity loans), and intermediate
rent.Homes that do not meet the National Planning Policy Framework definition of affordable housing such as ‘low
cost market’ housing, may not be considered as affordable housing for planning purposes.
9At an individual local authority level, there is a greater need for 3 bedroom properties in
Cherwell. The assessment emphasises that it is expected that developers will deliver a
balanced profile of market homes of different sizes including 2 and 3 bedroom homes for
younger households and those looking to downsize, alongside larger family homes. It also
highlights that affordable housing negotiations should be informed by the findings of the
SHMA together with other evidence.
Housig Needed
Unmet housing need – Following publication of the SHMA, Oxfordshire councils have
collectively accepted that Oxford City cannot fully meet its own future housing needs. The
other district councils in Oxfordshire (West Oxfordshire, South Oxfordshire, Vale of the White
Horse and Cherwell) have committed to discussions on how that need might be sustainably
met in their districts. This means that Cherwell district has to plan for its own housing need
as well as a proportion of Oxford city housing need of 1400 dwellings per year.
2.2.4 Housing Register
The number of active applications on the housing register fluctuates at around 1,000. This is
a consistent trend that reflects how the housing register is replenished with new applications
as applicants are rehoused. As at April 2018 there were 1,044 active housing register
applications.
Applicants fall into one of four housing needs categories:
- Band 1 (Urgent need)
- Band 2 (Significant need)
- Band 3 (Moderate need)
- Band 4 (Low housing need)
Banding - all applicants accepted onto the housing register are assigned one of the four
bands available, based upon an applicant’s housing and other relevant circumstances. The
breakdown of applicants by banding is shown below:
The majority of applicants (65%) are in Bands 1 to 3. These are households assessed as
being in priority housing need. The remainder (35%) are in band 4 (low housing need).
These are households assessed as being adequately housed but are on a low income and
would find it difficult to meet their needs on the open market.
10Age - The age profile of lead applicants on the housing register is shown below:
As at April 2018, there were relatively few lead/main applicants on the register under 20
years of age. There are significant numbers of applicants between the ages of 20-39.
Beyond 40 years of age the number of applicants falls progressively with age.
Size & Type of housing need - The type of households on the housing register and the size
of properties they require are as follows:
Current Bedroom Need Grand
Household Type
Total
1 2 3 4
Couple 36 3 0 0 39
Disabled 22 5 6 2 35
Family 6 332 142 37 517
Older Persons 243 12 4 0 259
Single 188 6 0 0 194
Grand Total 495 358 152 39 1044
The predominant households on the housing register are families (requiring 2 and/or 3
bedroom properties) and older people (requiring 1 bedroom properties). Over 80% of the
properties needed by applicants are 1 or 2 bedroom.
The majority of housing register applicants (74%) require ‘general needs’ housing, but there
is also significant need for supported housing with 26% of applicants needing either
sheltered or extra care housing. Further information on the needs and availability of
accommodation for older people is included later in this section.
11Where do applicants want to live? – housing register applicants are able to specify as
many areas as they wish for potential re-housing and there is no limit to the number of
locations that they can select. The current system does not allow applicants to select a
preferred village for re-housing. Therefore the ability to use the housing register to inform
affordable housing location requirements on new developments is limited.
The most requested places to be re-housed are Banbury, Bicester and Kidlington. The
village locations in the district which are most requested are:
Adderbury
Ambrosden
Arncott
Bloxham
Bodicote
Deddington
Drayton
Launton
Upper Heyford
Yarnton
2.2.5 Requirement for Intermediate Housing
Shared ownership is the predominant intermediate product in the district. Shared ownership
is available to people who cannot afford to buy a home on the open market and can help to
make home ownership affordable for people on lower incomes. Purchasers buy a share of
between 25-75% of a property with the opportunity to purchase further shares over time,
known as ‘staircasing’ (restricted to 80% share in some rural areas). The remaining share is
owned by a housing association (also known as Registered Providers) and a subsidised rent
is charged on the retained share of the property.
A register of people interested in shared ownership and other intermediate products is held
by the “Help to Buy” agent for the South of England Region. There are currently 824
registered applicants for shared ownership properties in Cherwell district.
2.2.6 Self Build Register
The Self-Build and Custom Housebuilding Act 2015 places a duty on local councils in
England to keep a register of people who are interested in self-build or custom-build projects
in their area. This register will helps us to understand the level of demand for self-build and
custom-build plots in the district and enable us to develop a strategy for delivering serviced
plots for self-build and custom-build projects. The register is split into two parts; Part 1 and
Part 2.
12Part 1 of the register is the number of suitable serviced plots that we must grant development
permission for. As of October 2018 there are 18 households registered on Part 1 of our
register.
Part 2 does not count towards demand for the purpose of the 2015 Act (as amended) but we
must have regard to these entries when carrying out their planning, housing, land disposal
and regeneration functions. There are 549 households registered on Part 2 of our register.
2.3 Housing Needs of Specific Groups in the Population
2.3.1 Older People
The SHMA considers the housing needs of specific groups within the population whose
needs may differ from those of the wider population. This section uses data in the SHMA
2014 unless stated otherwise. When looking at the needs of older people the SHMA focuses
on age groups from 55 upwards. Although in reality those aged 55 might not be considered
‘old’ the SHMA started the analysis from this age group due to the fact that some housing
developments are specifically targeted at the over 55 age group.
Oxfordshire is expected to see a substantial increase in the population of older people with
the total number of people aged 55 and over expected to increase by 49% over 20 years. A
particularly high increase is expected in Cherwell. This to some degree is related to the
higher overall population growth projected for the district. All areas of the county including
Cherwell are expected to see the number of people over 85 increase significantly by 2031.
Projected Change in Population of Older People (2011 to 2031)
Age group Cherwell Oxfordshire
Under 55 21.2% 28.7%
55-64 32.4% 25.5%
65-74 61.6% 49.7%
75-84 76.7% 66.4%
85+ 142.8% 126.8%
Total 31.1% 34.3%
Total 55+ 58.0% 49.3%
Source:Oxfordshire SHMA 2014
The SHMA looks at the tenure of older person households. In Cherwell pensioner
households are more likely to live in owner-occupied accommodation (71.5%). They are also
more likely than other households to be in the social rented sector. The proportion of
pensioner households living in the private rented sector is relatively low. Across all tenures
older persons are more likely to under-occupy homes.
There are higher levels of disability and health problems amongst older people. The Joint
Strategic Needs Assessment 2018 (JSNA) for Oxfordshire states that 83% of persons aged
85 or over have a disability and the highest rate in Oxfordshire is in Kidlington North.
Attendance Allowance is a good indicator of disability and/or mobility problems. The JSNA
highlights that in May 2017 38% of Cherwell residents aged 85 and over were receiving
Attendance Allowance. The growing older population and the fact that these residents have
higher levels of disability and health problems is likely to lead to an increased requirement for
specialist housing options.
The SHMA analysis indicates a potential need for between 280-450 additional housing units
of specialist accommodation across Oxfordshire each year to meet the needs of the older
person population through to 2031.
The council’s housing register also provides information on the level of need for specialist
housing options. 21% of households on the housing register need sheltered
accommodation, of which 94% require 1 bedroom properties. There is also a very small
13need (5%) amongst households on the housing register for extra care accommodation. The
level of support in extra care accommodation is greater than that for sheltered
accommodation and the eligibility criteria includes passing a 3 way assessment process
including the council’s Housing Options Team, Social Care and the individual scheme
manager. The low level of need for extra care retirement housing is surprising given the
ageing population, but could also be a reflection of the lack of awareness of the availability of
this type of accommodation and who is eligible for it.
2.3.2 Disability
Another group of people that may have housing needs that differ from those of the wider
population is disabled people. It should be noted that an analysis of disabled people is very
strongly linked with the above anaylsis of older people. The SHMA states that 13.7% of the
population in Oxfordshire have a long-term health problem or disability. It also shows that
21.7% of households in Oxfordshire contain someone with a long-term health problem or
disability. Both of these figures are below the regional and national averages.
Households and people with a long-term health problem or disability (2011)
Area Households containing someone Population with a health problem
with a health problem
Number % Number %
Cherwell 12,522 22.1 20,072 14.1
Oxfordshire 56,264 21.7 89,756 13.7
South East 839,086 23.6 1,356,204 15.7
England 5,659,606 25.7 9,352,586 17.6
The SHMA compared age with the prevalence of a long-term health problem or
disability.This clearly showed the correlation between age and long-term health conditions or
disability. The assessment then went on to consider age specific prevalence rates with
population projections. This showed the number of people with a long-term health problem or
disability will increase by 50% by 2031. The vast majority of this increase (76%) is expected
to be in age groups 65 and over.
Disabled Facilities Grants and Discretionary Grants and Loans - Perfectly good homes
can be quite unsuitable for occupants with mobility needs, to the extent that they can be
dangerous and isolating. Adaptations are needed by many disabled people so that they can
remain safe and independent.
A Disabled Facilities Grant (DFG) is a ‘means-tested’ financial grant that helps meet the cost
of adapting a disabled person’s home. An occupational therapist from the county council will
usually decide what adaptations are necessary and appropriate to meet the disabled
person’s needs.
In 2017/18, 90 ‘mandatory’4 DFGs were completed using the in-house Home Improvement
Agency, at a total cost of £771,000. Assistance was provided across a wide range of age
groups, although over half (61%) of the grants provided were to those over 65 years of age:
Mandatory DFG recipients by age 2017/18
Age Number
18 and under 7
19 - 65 28
66 - 79 28
4
Mandatory DFGs are those that the council are obliged to provide in accordance with the Housing Grants,
Construction & Regeneration Act 1996. This is when works are judged necessary and appropriate to meet as
disabled person’s needs, if those works are reasonable and practicable. Grants are subject to a means-test
(except in the case of children) up to a maximum of £30,000 and must be approved within set timescales.
1480 and above 27
Total
The type of adaptation carried out varies. The cost of each adaptation can also vary
significantly depending on the nature of the property and the person’s needs. The table
below provides a summary of the works completed for 2017/18 and the typical amount of
grant paid per adaptation. Grants are capped at a maximum of £30,000 and so a financial
contribution is required from the applicant in some cases where the cost of works exceed this
amount.
Type of work Number* Typical grant
contribution
Level access showers 48 £4,500
Internal/external access (including ramps) 22 £5,000
Straight stairlift 14 £2,000
Major adaptions (including 1 through floor lift) 10 £30,000
Curved stairlift 6 £4,000
Specialist WCs 2 £4,000
Cubical shower 2 £7,000
Adapted kitchen 2 £8,000
Over bath showers 1 £1,000
Ground floor WC 1 £3,000
Shower pressure 1 £1,000
*the number of individual works is likely to exceed the total number of grants as each grant may contain multiple
works.
Comparison of timescales to complete different works can be difficult. There can be a
number of factors which might cause delay that are outside the control of the local authority
and/or Home Improvement Agency. Multiple adaptations can also be installed which affects
timescales. However, where single adaptations were installed during 2017/18, the time taken
from application to completion was generally under two months for level access showers and
stair lifts. Adaptations relating to access, including ramps, were generally quicker and usually
took less than one month from application to completion.
Discretionary Grants and Loans – As well as mandatory DFGs the council also provides
discretionary DFGs. These are primarily provided in urgent, end-of-life cases or relocations
where the mandatory DFG system would not meet the applicant’s needs. In 2017/18 the
council completed 18 discretionary DFGs at a total cost of £73,000.
2.3.3 Supported Housing Requirements
Cherwell has a diverse range of supported accommodation for different clients. The
breakdown of accommodation by client group (not including older persons housing) is as
follows:
Client group Number of Percentage of Comments
units in supported
District housing stock
Learning Disability 82 29% Commissioned provision
Single Homeless People 13 plus 11 10% These are District local
additional units units. Additional units
in Oxford City commissioned for Cherwell
residents are situated in
Oxford City
People with mental 31 13% These are beds within the
health issues mental health transitional
15pathway
People with physical 33 13% Schemes with on–site
disabilities support
People with drug and 14 6% Although this is situated in
alcohol needs Cherwell it takes referrals
from all over the country
Vulnerable young people 61 24% Young people’s pathway
including young parents
Domestic Abuse 12 5% Comissioned provision
(Refuge)
Total Provision 257
Supported Housing for People with Learning Disabilities - Housing for people with
learning disibilities is commissioned by the county council and mostly provided by registered
providers. It is the primary responsibility of the Adult Services Team but they work closely
with the Children’s Services Team to plan for children with a learning disability as they reach
18. There is a need for a diverse range of accommodation, including provision for complex
needs and autism and accommodation for people with lower support needs. There is a
move away from the shared house arrangement to clusters of self-contained housing which
enables greater independence and efficiencies in the way care is delivered. This means that
there is a need to recommission a number of units as well as provide for new needs:
Total 18/19 19/20 20/21
Current provision 82
Re-provision requirements 26 12 12 12
New requirements 4 4 0 0
Total requirements 30 16 12 12
Pipeline 6 16 0 0
Current shortfall 24 0 12 12
Single Homeless Provision - The pathway now consists of 11 beds in an Oxford hostel for
people with complex needs and 13 beds situated within Cherwell for people ready to move-
on but which includes one bed for emergency assessment for people who have been verified
as rough sleeping.
In 2020 the funding for this current pathway comes to an end and work is on-going to
consider how the service can be funded moving forwards.
There remains a small but entrenched group of rough sleepers who are not engaging with
services.
Supported Housing for People with Mental Health issues - There is a clear link between
mental health issues and poor housing provision. Research has shown that those who are
homeless, or at risk of homelessness, are much more likely to experience mental distress.
Provision of the right housing with the right support can help to reduce homelessness.
Mental ill health is different for each individual, and problems can occur at any point in our
lives. As a consequence of these diverse needs, housing solutions must be equally diverse.
This requires taking into account the different types of support that people need and how that
changes over time.
16Most mental health services are delivered outside of a supported housing setting. However
some people need supported accommodation. The district is part of a countywide mental
health project. There are 31 bedspaces in Cherwell commissioned by the Oxfordshire
Clinical Commissioning Group and Oxfordshire County Council. These are predominantly
shared housing with more self-contained accommodation at Palm Court in Bicester. Current
provision consists of the following units
Scheme Number of places
Easington Gardens, Banbury 3
Springfield Avenue, Banbury 3
Gillet Road, Banbury 3
Whykham Place, Banbury 2
Oxford Road, Banbury 9
Palm Court, Bicester 8
Tweed Crescent, Bicester 3
TOTAL 31
These units meet a variety of needs but with a view that people will eventually move through
the pathway to general needs accommodation with support as required.
There is a shortfall in mental health provision for specifc groups. These include:
• people with challenging behaviour
• people with complex needs/dual diagnosis
• older people with mental health issues
The Clinical Commissioning Group and Oxfordshire County Council are currently working on
a five year plan looking at the future requirements of mental health services.
Supported Housing for People with Physical disabilities - the majority of people with a
physical disability can be housed in general needs accommodation with appropriate
adaptations and accessibility standards. However there is a need for provision for people
with greater care and support needs. The district currently benefits from the following
provision:
• Agnes Court, Banbury (23 units)
• Hanwell Chase, Banbury (5 units)
• Old Place Yard, Banbury (5 units)
The current provision for people with physical disabilities is now adequate but we will
continue to work with the county council on emerging new needs.
Provision for those with drug and alcohol issues - In general, admissions to hospital for
alcohol related issues are below the national average.
General support services for residents with drug and alcohol issues are provided through
Turning Point hub in Banbury.
There is a therapeutic community situated within Cherwell called The Ley Community. This
takes residents from across the county and beyond and is not specific provision for Cherwell
residents.
Supported Housing for Vulnerable Young People - Cherwell provides three pathways
with accommodation in the district:
Young parents
17 Single young people
Young people with more complex needs
Young people are encouraged to remain at home and therefore the pathway caters for those
who are most need in terms of their needs and housing situation. The current provision is as
follows:
Young Parents Single Young People Young people with
(shared accommodation) complex needs
Rachel House, 11 rooms
Banbury
Lucan House, 3 flats
Bicester
Dashwood 9 units
House, Banbury
(Step down from
Rachel House)
The Foyer, 26 units (shared)
Banbury
Oxford House, 9 units (shared)
Bicester
Key 2 units, 3 units (self-
Banbury contained)
In general the provision is adequate to meet the need, however some residents currently
become stuck in accommodation that they no longer need due to lack of suitable move-on
provision. Oxfordshire County Council are currently working on a strategy in conjunction with
the district councils to improve housing for young people. This should identify any gaps for
vulnerable young people.
Refuge Provision for domestic abuse services - In 2015/16 11% of people seeking
housing advice in Cherwell had experienced domestic abuse. Following a review of the
domestic abuse service in Oxfordshire services have been recommissioned with a total of 21
bed spaces being required including five dispersed units. At present Cherwell has 12 units
within a refuge. Work needs to continue to identify the required accommodation provision for
the service.
Gypsy & Travellers - a joint accommodation assessment for Gypsies, Travellers and
Travelling Show People was undertaken in June 2017 across all the district councils in
Oxfordshire. This took account of a change in the planning definition (PPTS 2015) which no
longer includes people who have ceased to travel permanently. The results of the needs
assessment were recorded in the Annual Monitoring Report for 2016/17.
There are currently 57 Gypsy and Traveller pitches in the district, with a requirement for 32
additional pitches to be delivered from 2017 to 2031. Sites will be identified as part of Local
Plan Part 2. Five additional pitches already have planning permission and a further two
applications for eight pitches at Chesterton and for six pitches at Piddington are awaiting
determination.
There are currently 14 plots for travelling show people, with a further 24 plots required
between 2017 and 2031. There are no new plots currently identified and this will need to
happen as part of Local Plan Part 2.
Key Workers - The need for Key worker housing is high across the County particularly in
Oxford City, however the existing and emerging Local Plans across Oxfordshire do not
include a definition of key worker and relies on Housing policy documents. Cherwell Housing
18Allocations Scheme has a definition and allocates 1% of housing to this group on an annual
basis.
Given the different stages of Local Plans and the adopted Allocations Schemes in each of
the Oxfordshire Authorities it is not possible to achieve an Oxfordshire-wide standard
definition of key worker. However the housing that is required to meet Oxford’s unmet need
will be expected to include specific provision for key workers using Oxford City’s definition.
193 Place: Our housing stock and housing supply
3.1 Existing Housing Stock
In 2017 Cherwell District Council commissioned the Building Research Establishment (BRE)
to complete a stock modelling survey and this was published in March 2018. This section
refers to the findings of the survey unless stated otherwise.
3.1.1 General characteristics of the existing housing stock
The total number of dwellings in Cherwell is 66,693. The tenure of these dwellings is 66%
owner occupied, 22% private rented and 12% social rented. This compares to 63% owner
occupied, 20% private rented and 17% social rented at a national level (English Housing
Survey 2016-17).
The Census 2011 provides data on house types. The most common dwelling type in
Cherwell district is semi-detached houses, followed by terraced houses and then detached
houses. Flats account for (15%) of the total stock.
Type of dwelling breakdown
1% Whole house or
bungalow: Detached
11%
Whole house or
30% bungalow: Semi-detached
23% Whole house or
bungalow: Terraced
(including end-terrace)
Flat, maisonette or
apartment
35% Caravan or other mobile
or temporary structure
Source: Census 2011
3.1.2 House prices and affordability
Affordability is an issue across many parts of the country, particularly the south of England.
The latest English Housing Survey states that in 2016/17 the average age of a first time
buyer was 33 years. The average deposit for a first time buyer was £48,591 and 35% of first
time buyers funded their deposit from financial help from friends and family.
The attractiveness of Cherwell district as a location means that house prices are high and
affordability of housing is a key issue. The housing market in Oxford has a significant impact
on Cherwell’s housing market with housing being less affordable in the south of the district
(parts of the district closest to Oxford e.g. Kidlington).
Average House Prices
Year Average House Price % increase from
previous year
2014 £236,590 6.00%
2015 £261,262 10.43%
2016 £285,349 9.22%
202017 £287,476 0.75%
2018 £301,371 4.83%
(as at August)
Source: HM Land Registry
The average house price in Cherwell as at August 2018 was £301,371. The average house
price has increased steadily during the past five years and by 27% since 2014. Some local
people experience significant affordability issues as a result. One of the key issues affecting
affordability of housing is the gap between household incomes and house prices. The table
below shows the lower quartile average house prices for the district. Lower quartile house
prices are a good measure of affordability as they indicate the price of an entry level property
into the housing market (the type that young people may purchase as their first property).
Lower Quartile Average House Prices
Year Lower Quartile Average % increase from
House Price previous year
2013 £181,829 2.16%
2014 £192,500 5.87%
2015 £207,493 7.79%
2016 £230,052 10.87%
2017 £248,379 7.97%
Source: ONS
An accepted measure of affordability is to observe the relationship between the house prices
and income. The median house price in Cherwell in 2016 was £292,250 (HM Land
Registry). In 2016 the median gross annual workplace based earning for Cherwell residents
was £31,599 (Nomis Annual Survey of Hours and Earnings, Office for National Statistics
2016). Therefore, the ratio of median house price to median gross annual workplace based
earnings is 9.25. Another measure of affordability is access to mortgage finance, the
industry standard is a lender will provide up to 3.5 times a household income as a mortgage.
Based on the average earnings outlined above, a single person household would only be
able to raise £110,597 mortgage finance which would mean without assistance
homeownership is unattainable. A double income household on average earnings (i.e. 2 x
£31,599) would still only be able to raise £221,193 mortgage finance which would mean
accessing homeownership even for properties at the lower end of the market would be
challenging. Over recent years, a lack of availability of mortgages and the high levels of
deposits required has further hampered first time buyers. Although lenders now appear more
willing to provide access to finance purchasing a house is still beyond the reach of many
people in the district.
3.1.3 Stock Condition and Housing Standards
Health and Safety Hazards - The council has a statutory duty to take action in response to a
range of hazards identified as ‘Category 1 hazards’ by means of the Housing Health and
Safety Rating System (HHSRS). Category 1 hazards are considered to be serious health
hazards. The Council has also determined that it will use its discretionary powers to take
action in relation to certain Category 2 hazards as well. The Private Sector Housing (PSH)
Team undertakes both pro-active and reactive work and hazards are addressed using both
enforcement powers and by provision of grants and loans in some cases.
The BRE reported in March 2018 that in Cherwell an estimated 6,638 dwellings in the private
sector (owner occupied and private rent) have a Category 1 hazard. This equates to 11% of
all private sector properties in the district. 1,347 dwellings in the private rented sector are
estimated to have a Category 1 hazard. This equates to 9% of properties in the private
rented sector. The highest concentrations of all HHSRS hazards in the private sector are
found in the wards of:
21 Cropedy, Sibford and Wroxton
Deddington
Launton and Otmoor
In 2017/18 the Private Sector Housing Team resolved serious health hazards (Category 1
hazards) in 49 homes. In 27 of these cases the team took enforcement action to resolve the
hazards and the other 22 hazards were resolved by means of various grants such as the
‘Cherwell Energy Efficiency Project’ grant and ‘Landlord Home Improvement’ grant. 14
homes with other hazards (Category 2) were also resolved.
Hazard resolution delivers measurable financial savings to both the NHS and society as a
whole by reducing the need for acute health services that result from poor housing
conditions. These savings can be quantified using the Housing Health Cost Calculator
software produced by BRE.
In 2016/17 the PSH Team resolved 78 Category 1 hazards and 16 Category 2 hazards. This
equates to annual cost savings of £116,000 to the NHS and £1,987,000 to society more
generally.
Energy Efficiency – The Government’s Standard Assessment Procedure (SAP) is used to
monitor the energy efficiency of homes. It is an index based on calculating annual space and
water heating costs for a standard heating regime and is expressed on a scale of 1 (highly
inefficient) to 100 (highly efficient with 100 representing zero energy costs).
The average SAP rating for all private sector dwellings in Cherwell is estimated to be 59
which is worse than the average SAP rating of 62 for English dwellings (English Housing
Survey 2016/17). In Cherwell the estimated average rating for owner occupied stock is 57
and for private rented stock 62. The average rating for all private sector dwellings in Cherwell
district is 59 which equates to an Energy Performance Certificate (EPC) rating of D.
The EPC rating is another measure of a property’s energy efficiency. An EPC is needed
whenever a property is built, sold or rented. The Energy Efficiency (Private Rented Property)
(England and Wales) Regulations 2015 establish a minimum level of energy efficiency for
privately rented property in England and Wales. This means that, from April 2018, landlords
of private rented domestic properties in England and Wales must ensure that their properties
reach at least an EPC rating of E before granting a new tenancy to new or existing tenants.
These requirements will then apply to all private rented properties in England and Wales
even where there has been no change in tenancy arrangements from 1 April 2020. 9.5%
(5,547) of all private sector dwellings and 6.2% (904) of private rented dwellings in Cherwell
are estimated to have an EPC rating below band E (BRE stock modelling report 2018).
Loft and cavity wall insulation – Cherwell’s private sector housing stock has an estimated
13,547 dwellings with un-insulated cavity walls and 8,565 dwellings with less that 100mm of
loft insulation (BRE stock modelling report 2018).
As well as using enforcement powers, Cherwell’s Private Sector Housing Team has other
initiatives to help improve the energy efficiency of homes. During 2017/18 the council
provided 15 Cherwell Energy Efficiency Project (CHEEP) grants to landlords at a cost of
£8,000 to improve the energy efficiency of private rented accommodation. These grants
usually contribute 25% (up to an agreed maximum) towards the cost of energy efficiency
improvements such as upgrading heating systems, windows and insulation. In all cases
where grant funding is agreed, adequate loft and cavity-wall insulation must be installed
(unless certain exceptions apply).
22In 2017/18 the council also contributed £7,000 towards joint funding the Oxfordshire
Affordable Warmth Network (shared by all Oxfordshire authorities). This project provided
telephone and email advice to 111 Cherwell residents (478 for the whole county) to help
reduce their energy bills, improve the energy performance of their homes and discuss any
financial help that may be available. In addition, 91 ‘interventions’ took place including more
in depth support and assistance or the provision of basic energy efficiency measures.
£63,000 of funding for Cherwell residents was levered in through the network by signposting
and direct referrals to a host of suitable grants and financial assistance schemes.
Fuel poverty - Since 2011 the ‘Low Income High Costs’ definition of fuel poverty has been
used. This means that a household is considered to be in fuel poverty if they have to incur
fuel costs that are above the national median level, which would leave them with a residual
income below the official poverty line. The figures used to calculate fuel poverty take into
account low income, high fuel prices, poor energy efficiency and under occupancy.
National data is produced by the Department for Business, Energy and Industrial Strategy
(DBEIS), but fuel poverty is difficult for local authorities to determine at a local level because
of practical problems of obtaining fuel use, fuel cost and income data. The latest fuel poverty
statistics report from DBEIS published in 2018 refers to data from 2016. Headline figures
include that:
The average fuel poverty gap (the amount needed to meet the fuel poverty threshold)
in England was estimated at £326.
The proportion of households in England in fuel poverty was estimated to have
increased by 0.1% from 2015 to 11.1% in 2016.
Households with insulated cavity walls are least likely to be in fuel poverty.
Older dwellings tend to have a higher proportion of households in fuel poverty.
The level of fuel poverty is highest in the private rented sector.
Those living in ‘multi-person (adult) households’ are deepest in fuel poverty with an
average fuel poverty gap of £413 compared to a single person under 60 (£208).
However, the highest prevalence of fuel poverty is seen for lone parents with
dependent child(ren) (26.4%).
The BRE stock modelling survey 2018 estimates that 8% of all households are experiencing
fuel poverty in the Cherwell district. This is less that the reported average of 11% for England
as a whole. The estimates by tenure are presented in the table below. Whilst the private
rented tenure shows the highest levels of fuel poverty (12% of all private rented households),
because of the far greater number of owner-occupied dwellings overall (43,737) there are
more owner-occupier households estimated to be in fuel poverty:
Private sector stock Social stock
Owner occupied Private rented
No. % No. % No. %
No. of dwellings 43,737 - 14,663 - 8,293 -
Fuel Poverty 3,162 7% 1,777 12% 631 8%
(Low Income High Cost)
As shown on the map below, the highest concentrations of fuel poverty in the private sector
are reported to be in the rural areas of Cropedy, Sibfords & Wroxton, Fringford & Heyfords
and Deddington.
23(BRE stock condition report 2018)
The source of heating can contribute towards fuel poverty. Whilst Banbury, Bicester and the
area closest to Oxford have connections to mains gas, significant parts of the rural areas of
district are not on the mains gas network. This means they have to rely on more expensive
types of fuel such as oil, liquid petroleum gas (LPG) or electricity.
The typically lower energy efficiency ratings of private sector dwellings in some of the urban
areas also further contributes to the higher levels of fuel poverty (BRE).
3.1.4 Empty homes
As of March 2018 there were 495 ‘long-term’ empty homes in the Cherwell district. These are
homes that had been vacant for more than 6 months, as presented in the table below:
Time empty No.
> 10 years 3
5-10 years 37
2-5 years 49
1-2 years 225
6-12 months 180
Up to 6 months 693
Total empty 1187
Total long-term (>6m) 495
The majority of empty homes (approaching 60% in Cherwell) are brought back into use
before they have been empty for six months, which means they are not considered to be
‘long-term’ empty properties. The work of the council’s Empty Property Officer (a shared post
with South Northamptonshire District Council) is focussed on these long-term empty
24properties, which includes those that have been empty for a considerable time or have
become problematic.
The table below details how many empty properties were brought back into use as a result of
direct intervention by the council. These figures only include those cases where the council
has provided specific help and assistance, undertaken enforcement, or has engaged with the
owners over a period of time that has resulted in action:
2016-17 2017-18 Total
Long-term empties 19
12 7
returned to use
There are a variety of reasons why homes become empty, including death, inheritance,
abandonment, relationship breakdown and/or lack of resources to tackle major repairs. The
council has a range of financial measures to support owners, including Landlord Grants,
Flexible Empty Homes Loans and a Leasing Scheme (in partnership with registered
providers).
Many ‘long-term’ empty properties are returned to use through negotiation and persuasion;
the key to this being establishing how the property became empty and determining what the
barriers are to bringing it back into occupation. In some cases, enforcement action (including
Empty Dwelling Management Orders) can also be considered, targeting properties causing
most concern to neighbours and in areas of housing need.
3.1.5 Houses in Multiple Occupation (HMO)
The 2018 BRE stock modelling survey estimates there are 1,994 HMOs in Cherwell and 431
of these will now fall under the mandatory licensing requirements. On 1 October 2018
mandatory HMO licensing requirements widened to include all HMOs let to 5 or more
occupants who form 2 or more households. Previously, these HMOs would only require a
licence where the property was 3 or more storeys high (an estimated 84 properties). The
number of storeys is no longer relevant in determining whether a licence is required.
In order to obtain an HMO licence the council must first be satisfied that the management
arrangements for the HMO are suitable and the property meets the required health and
safety standards. Failure to licence a licensable HMO is an offence and the council has a
range of enforcement powers.
3.1.6 Discretionary grants and loans
The Council offers a number of discretionary grants and loans to assist householders to
improve the condition of their property. Details of the different grants and loans and usage of
these in 2017/18 is outlined below:
Landlord Home Improvement Grants – grants of up to £15,000 are provided to contribute
to a wide range of repairs and improvements, in return for the council receiving nomination
rights to the properties. In 2018/19, 11 properties were improved at a cost of £83,000. As
well as improving the housing stock these grants help provide suitable housing for statutory
homeless households or those threatened with homelessness.
Flexible Home Improvement Loans (FHIL) – These loans are available to homeowners
aged 60 or over to be used for a wide range of eligible improvements such as essential
repairs and maintenance, central heating, replacement bathroom suites and kitchens,
rewiring, burglar alarms and home security.
The loans are flexible because they can be repaid at any point, without penalty, with either
regular or occasional payments. But they do not have to be repaid until the home is sold or
25the owner ceases to occupy it. A low rate of interest is charged, linked to the Bank of
England rate. The minimum interest rate is 3.5 percent and the maximum 7 percent.
In 2018/19, six homes were improved through FHIL at a cost of £53,000. This capital is not
provided by the council but by FHIL which is a separate company of which the council is a
member.
Small Repairs Service – Our small repairs service is available to owner-occupiers and
tenants who are aged 60 or more, are registered disabled, or are suffering from long-term ill-
health. We can help with a wide variety of small general repairs, such as fitting shelves,
smoke detectors, key safes, grab rails or security locks. Or we can carry out minor electrical
or plumbing work. Only small repairs up to two hours work can be completed and the cost of
the service is £20 per hour, plus the cost of any materials.
In 2017/18, 247 households were assisted by the Small Repairs Service, with 130 key-safe
jobs saving the NHS an estimated 910 bed-days to a value of £364,000.
3.1.7 Enforcement activity and complaints about landlords
During 2017/18 the Private Sector Housing Team:
Received 423 enquiries which were responded to and/or referred to other sources.
These enquiries were variable in nature, but typically included emails and phone calls
seeking information about tenancy rights, property standards and grant availability.
Dealt with 410 service requests that including ongoing case work and investigation.
These are typically complaints about property hazards or disrepair, HMO standards,
or issues relating to tenancy rights such as unlawful eviction.
Carried out 84 HMO inspections, issued 24 HMO licences and accepted 34 landlord
self-certified HMO reviews.
Issued 66 formal or informal enforcement notices in relation to inadequate property
standards.
Undertook work-in-default in three cases.
3.2 Housing Supply
The district is currently going through a period of high growth, with a large number of
strategic sites now under construction.
3.2.1 Overall numbers of housing completions
The table below shows the number of market and affordable dwellings that have been
completed in the last five years (all figures are net of demolitions and sales disposals). As
outlined earlier, the SHMA states the target for additional new homes in Cherwell per year is
1140, of this 407 should be affordable homes.
2013/14 2014/15 2015/16 2016/17 2017/18 TOTAL
All dwellings 410 946 1425 1102 1387 4223
Affordable
Housing 145 195 322 312 427 1401
% of affordable to
market 35% 21% 22.% 28.% 31% 33%
26The delivery of affordable housing has been strong and the number of additional new
affordable homes built has increased year on year. Virtually all sites have delivered the full
policy requirement of 30% affordable housing on sites of 11 homes or more in Banbury and
Bicester and 35% affordable housing in the rest of the district. The high levels of delivery are
due in part to the viability of S106 sites to deliver affordable housing remaining strong and
most of the delivery taking place on larger sites (where the provision of affordable housing
applies).
3.2.2 Location of housing completions
The majority of recent delivery has been on larger sites allocated within the local plan located
in Banbury and Bicester. A total of 616 new homes were completed in Banbury in 2017/18.
In 2015/16 there was a spike in rural delivery with 700 new homes completed in Kidlington
and other villages in rural parts of the district.
3.2.3 Type/Size of housing completions
In recent years the council has started to record the type/size of homes build in the district.
The most common type of dwelling built in the district in 2017/18 was 4 bedroom houses.
There is an emphasis on larger properties as 34% of all new homes had 4 bedrooms or more
(contrary to the 15% target for homes with 4 bedrooms or more in the SHMA).
Location Completed dwellings by bedroom size (2017/18) Total
1 Bedroom 2 Bedroom 3 Bedroom 4 Bedroom +
District wide SHMA 15% 30% 40% 15%
target
Banbury 66 85 113 132 396
Bicester 40 116 82 105 343
Elsewhere 40 80 79 133 332
TOTAL 146 (13%) 281 (25%) 274 (25%) 370 (34%) 1102* (3%
unknown)
*There were 31 housing completions where the numbers of bedrooms were unknown
3.2.4 Tenure of affordable housing delivery
The council’s policy position is that new affordable housing will be 70% rent and 30%
shared ownership. Over the past five years new delivery of affordable housing
(1,417 units) has closely matched the council’s policy position with 67% of new
affordable homes being affordable rent and 33% shared ownership.
27You can also read