CHHATTISGARH THE MINERAL BASKET - BHORAMDEO TEMPLE, CHHATTISGARH - IBEF
←
→
Page content transcription
If your browser does not render page correctly, please read the page content below
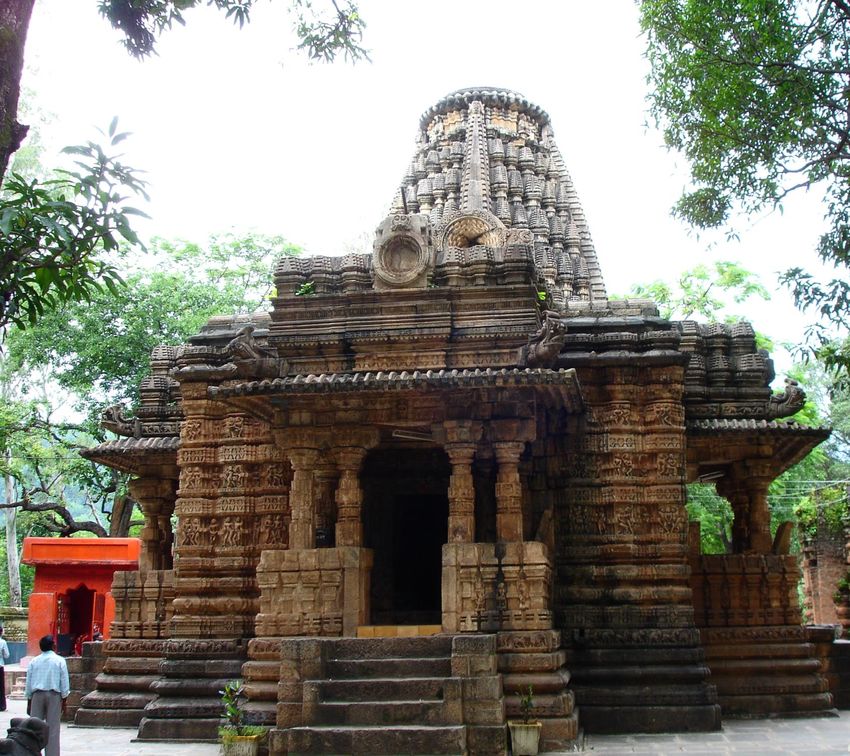
BHORAMDEO TEMPLE, CHHATTISGARH

 CHHATTISGARH
 THE MINERAL BASKET

For information, please visit www.ibef.org                         March 2019
Table of Content

  Executive Summary .…………….…….…....3

  Introduction ……..………………………...….4

  Economic Snapshot ……………….….…….9

  Physical Infrastructure ………..……...........15

  Social Infrastructure ..................................22

  Industrial Infrastructure ……..……….........25

 Key Sectors ………….………………....…...28

 Key Procedures & Policies…………….…...36

 Annexure.………….……..…........................45

EXECUTIVE SUMMARY
Chhattisgarh ranked 4th in terms of value of mineral production (excluding atomic, fuel and minor minerals) in
India, with a 15.66 per cent share in 2017-18. It is a leading producer of minerals such as coal and iron ore.
In 2017-18, the state accounted for about 21 per cent and 17.19 per cent of the overall coal and iron ore
Strong mineral production
production in India, respectively. Iron ore from Bailadila mines in the state is considered to be among the best
base in the world.
It is the only state in India that produces tin concentrates and accounts for 35.4 per cent of tin ore reserves of
India. During 2018-19*, tin concentrate production in the state stood at 2,381 kg.
Korba – Power capital of Korba district in Chhattisgarh is known as the power capital of India. All villages in the state have been
India electrified under Deendayal Upadhyaya Gram Jyoti Yojana (DDUGJY).
E-commerce & other sectors which are in the start up stage have begun to grow in Raipur, converting the
Start up hub states into a start up hub. By setting up a start up in the state, the player can enjoy first mover advantage and
capture a larger market.
Leading investment Chhattisgarh has emerged as one of the most preferred investment destinations in India. The state has been
destination in India acclaimed as “one of the best fiscally managed states” by the Reserve Bank of India (RBI).
Strong growth in Between 2011-2012 and 2017-18, the Gross Value Added (GVA) from the primary sector in the state grew at
agriculture a CAGR (in Rs) of 9.88 per cent.
Note: * as of June 2018, update is expected in Chhattisgarh economic survey 2018-19
Source: Economic Survey of Chhattisgarh, Indian Bureau of Mines, Aranca Research
3 CHHATTISGARH For information, please visit www.ibef.org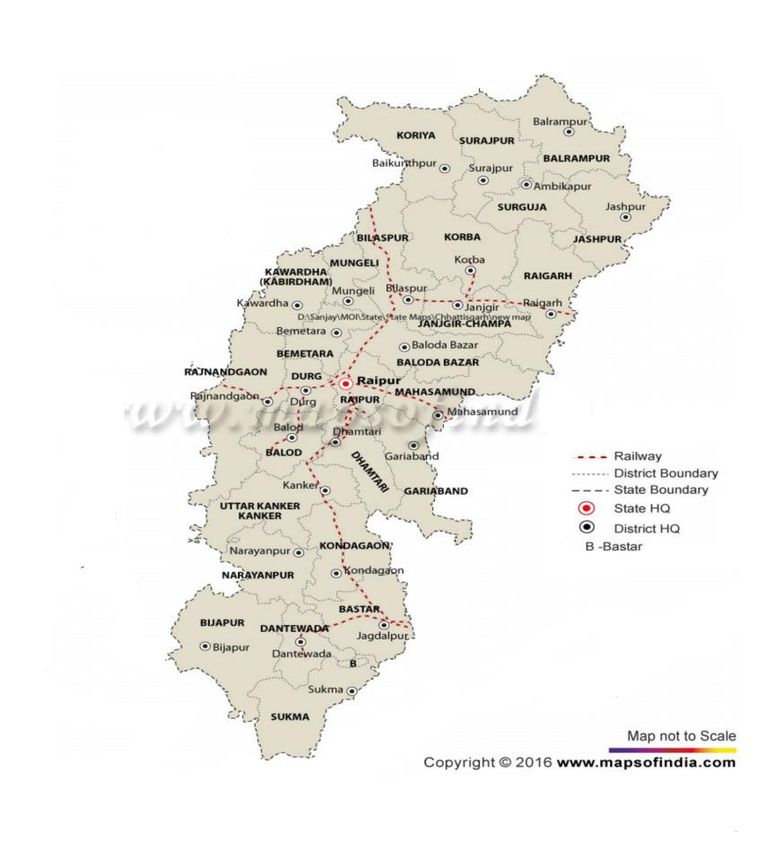
CHHATTISGARH

INTRODUCTION
FACT FILE
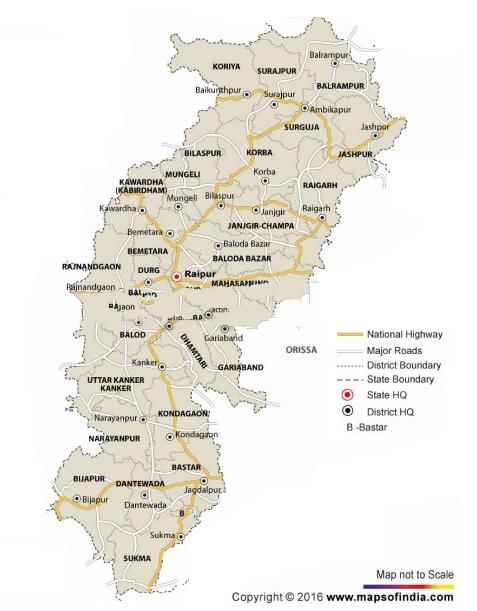
Chhattisgarh is located in central India. The state shares its border
with Madhya Pradesh & Maharashtra in the west, Uttar Pradesh in
the north, Odisha and Jharkhand in the east and Andhra Pradesh in
the south.
The languages spoken are Chhattisgarhi and its local dialects, along
with Hindi & English.
Raipur, Bhilai, Durg, Bilaspur, Korba & Rajnandgaon are some of the
major cities of the state.
Source: Maps of India
Chhattisgarh has a tropical climate with three major seasons:
summer (April-June), monsoon (July-September) & winter (October- Parameters Chhattisgarh
March). Capital Raipur
Geographical area (sq km) 137,898
Administrative districts (No) 27
Population density (persons per sq km) 189
Total population (million) 25.5
Male population (million) 12.8
Female population (million) 12.7
Sex ratio (females per 1,000 males) 991
Literacy rate (%) 70.28
Source: Chhattisgarh Economic Survey, Census 2011
5 CHHATTISGARH For information, please visit www.ibef.org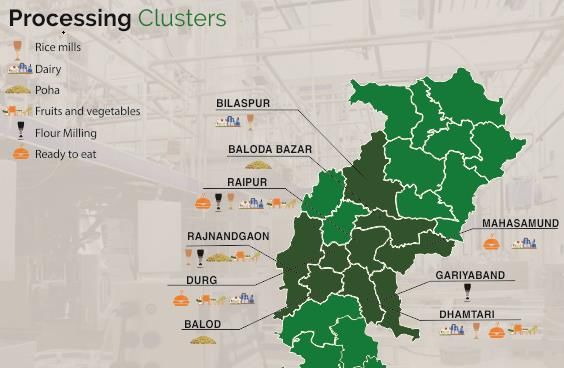
ADVANTAGE
Mineral resources Policy and fiscal incentives
Mineral resources are Chhattisgarh’s biggest strength A wide range of fiscal & policy incentives for businesses
It has deposits of limestone, iron ore, copper, bauxite, have been announced under the state’s Industrial Policy
dolomite & coal. 2014-19.
Chhattisgarh accounts for about 17 per cent of India’s coal Additionally, the state has well-drafted policies for the
reserves. IT/ITeS, minerals & energy sectors.
Advantage
Chhattisgarh
Energy rich Rich labour pool
Chhattisgarh is presently one of the few states with surplus Chhattisgarh has a high worker-participation rate (both
power. male and female).
It is among the few profitable states in terms of utility based The state has one of the lowest reported losses of man-
electricity. days attributed to labour problems in the country.
Presence of coal makes Chhattisgarh an ideal location for pit- Recently, the Government introduced online registration
head-based thermal power plants for both merchant sales & for its workers.
state consumption.
Note: GSDP – Gross State Domestic Product, exchange rate used is average of 2017-18 i.e. USD = INR 64.45
6 CHHATTISGARH For information, please visit www.ibef.org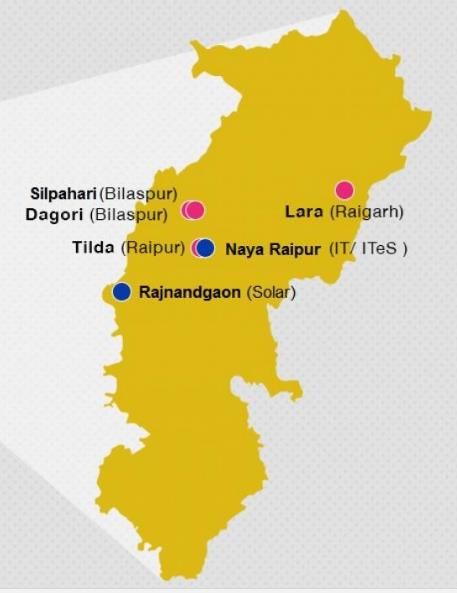
STATE VISION
Develop a world class rail and Implemented the Skill
road network for better Development Act 2013 to develop
connectivity with metros. employment skills among youth.
Implement the Bastar-Raoghat
rail project for transporting
minerals.
Simplify procedures, and ensure Skill Be a pollution free industrialised
speedy clearances and Transport state.
development
balanced regional development. Put in place proper pollution
Promote downstream industries control and environment
to spread industrialisation. Investment management systems.
Environment
promotion
Vision
Make the state a world class 2022 Build a primary school within
tourist destination. Tourism Education every five kilometres.
Promote religious, adventure Improve distance learning
and heritage tourism, and programmes with the help of
attract private investment in the Agriculture Infrastructure information and communication
sector. technology.
Encourage contract farming
with the benefit of assured prices Connect all villages with better
to farmers. roads.
Ensure efficient use of irrigation, Increase reliance on renewable
rainwater harvesting for agro energy.
processing industries.
Source: Confederation of Indian Industry
7 CHHATTISGARH For information, please visit www.ibef.org
CHHATTISGARH IN FIGURES

     Chhattisgarh’s Contribution to Indian Economy (2017-18)                                     Physical Infrastructure in Chhattisgarh

     Parameter                                 Chhattisgarh                 India                Chhattisgarh
                                                                                                                                        Chhattisgarh                   India
     GSDP as a percentage of all
                                                     1.64                   100.0                Installed power capacity
     states’ GSDP                                                                                                                         13,526.79                 350,162.48
                                                                                                 (MW) (February 2019)
     GSDP growth rate* (%)                           9.66                   11.5
                                                                                                 Wireless subscribers (mn)
     Per capita GSDP* (US$)                       1,342.85                1,982.65                                1                          76.90                   1,176.00
                                                                                                 (December 2018)

      Social Indicators                                                                          Internet subscribers (Mn)
                                                                                                                    1                        35.41                     560.01
                                               Chhattisgarh                                      (September 2018)
      Parameter                                                             India
                                                                                                 National highway length
      Literacy rate (%)                             70.28                   73.0                                                             3,606                   1,31,326
                                                                                                 (km) (November 2018)
      Birth rate (per 1,000
                                                     22.8                   20.4                 Airports (No)                                 2                        129
      population) (2017)

      Industrial Infrastructure                                                                  Investments (US$ billion)
                                                  Chhattisgarh
      Parameter                                                              India               Parameter                                Chhattisgarh1                 India
      Operational PPP projects (No)
                                                        15                    910                Cumulative FDI equity inflows
      (February 2019)
                                                                                                 between April 2000–December                     1.42                  409.27
      Exporting SEZs (No) (January                                                               2018
                                                         1                    231
      2019)

    Note: *in Rs terms, GSDP, per capita GSDP figures are taken at current prices, Exchange Rate used is average of 2017-18, i.e. USD = INR 72.15, 1Denotes Madhya Pradesh including
    Chhattisgarh, For sources refer to Annexure.

8        CHHATTISGARH                                                                                                              For information, please visit www.ibef.org
CHHATTISGARH ECONOMIC SNAPSHOT
ECONOMIC SNAPSHOT – GSDP
GSDP of Chhattisgarh at Current Prices Per Capita GSDP of Chhattisgarh at Current Prices
50 3.5 1,800 120000
CAGR (in Rs) 10.18% CAGR (in Rs) 6.76%
45 1,600
3
3.12
100000
44.10
1,594.45
40
43.20
102,762
1,400
2.84
96,887
35 2.5
93,890
1,399.46
37.97
1,342.85
2.55
1,336.78
36.16
1,200 80000
1,301.54
34.74
1,284.08
1,278.52
85,199
34.19
1,244.26
30
81,744
32.97
32.60
2.27
2
2.21
77,687
1,000
2.07
25 60000
67,750
1.78
1.5
61,305
20 800
1.58
15 1 600 40000
10 400
0.5 20000
5 200
0 0
0 0
2011-12
2012-13
2013-14
2014-15
2015-16
2016-17
2017-18
2018-19
2011-12
2012-13
2013-14
2014-15
2015-16
2016-17
2017-18
2018-19
US$ billion Rs trillion
US$ Rs
At current prices, the total GSDP of Chattisgarh reached Rs The state’s per capita GSDP in 2018-19 was Rs 96,881 (US$
3.12 trillion (US$ 43.20 billion) in 2018-19. 1,342.85).
The state’s GSDP increased at a compound annual growth rate The per capita GSDP (in Rs) increased a CAGR of 6.76 per
(CAGR) (in Rs) of 10.18 per cent between 2011-12 and 2018- cent between 2011-12 and 2018-19.
19.
Note: exchange rates used are averages of each year,
Source: Directorate of Economics & Statistics of Chhattisgarh, MOSPI
10 CHHATTISGARH For information, please visit www.ibef.orgECONOMIC SNAPSHOT – NSDP
NSDP of Chhattisgarh at Current Prices Per Capita NSDP of Chhattisgarh at Current Prices
45 3 1,600 120000
CAGR (in Rs) 10.12% CAGR (in Rs) 8.38%
40 1,400
2.79
2.5 100000
39.55
1,393.53
38.73
2.55
35
1,342.85
1,200
96,887
2.29
34.06
1,219.37
89,813
1,192.74
30 2 80000
32.27
1,155.04
1,150.72
1,124.20
1,117.52
30.90
1,000
30.75
81,808
2.02
29.67
1.97
29.28
25
1.86
73,590
72,936
69,880
1.5 800 60000
1.59
20
60,849
1.42
55,177
600
15 1 40000
10 400
0.5 20000
5 200
0 0 0 0
2011-12
2012-13
2013-14
2014-15
2015-16
2016-17
2017-18
2018-19
2011-12
2012-13
2013-14
2014-15
2015-16
2016-17
2017-18
2018-19
US$ billion Rs trillion US$ Rs
At current prices, the total GSDP of Chattisgarh reached Rs The state’s per capita GSDP in 2018-19 was Rs 96,887 (US$
2.79 trillion (US$ 38.73 billion) in 2018-19. 1,342.85).
The state’s GSDP increased at a compound annual growth rate The per capita GSDP (in Rs) increased a CAGR of 8.38 per
(CAGR) (in Rs) of 10.12 per cent between 2011-12 and 2018- cent between 2011-12 and 2018-19.
19.
Note: exchange rates used are averages of each year,
Source: Directorate of Economics & Statistics of Chhattisgarh, MOSPI
11 CHHATTISGARH For information, please visit www.ibef.orgECONOMIC SNAPSHOT – PERCENTAGE
DISTRIBUTION OF GSVA
In 2017-18 (A), the tertiary sector contributed the highest to Visakhapatnam
GSVA Composition
port traffic
by Economic
(millionActivity
tonnes)
Chhattisgarh’s GSVA (at current prices) with a share of 36.82 per
cent, followed by secondary sector contributing 33.20 per cent and 100%
34.63% CAGR 36.82%
primary sector contributing 29.97 per cent to the overall GSVA of 90%
Chhattisgarh.
80% 11.86%
The tertiary sector in the state, which includes trade, hotels, 70%
transport, railways and other services grew the fastest with a 11.86
60% 34.00%
33.20%
per cent CAGR (in Rs) between FY12-18.
50% 10.28%
The secondary sector, grew at a CAGR (in Rs) of 10.28 per cent
40%
between FY12-18, while the primary sector grew at 9.88 per cent
during the same period. 30%
31.37% 29.97%
20%
9.88%
10%
0%
2011-12 2017-18A
Primary Sector Secondary Sector Tertiary Sector
Note: A – advanced estimates , data is expected to be updated from Chhattisgarh Economic Survey 2018-19
Source: Directorate of Economics & Statistics of Chhattisgarh, MOSPI
12 CHHATTISGARH For information, please visit www.ibef.orgECONOMIC SNAPSHOT – FDI INFLOWS &
INVESTMENTS
FDI Inflows in Chhattisgarh1 in April 2000-December 2018 (US$ Proposed Investments
million)
Proposed
1,800 Year IEMs filed investments
16 1,416 (in US$ million)
1,500 76 28
80
101
1,200 118
220 2016 50 1,839.1
900 123
654
600 2017 38 385.3
300
0
2018 35 531.67
FY17
FY01-11
FY12
FY13
FY14
FY15
FY16
FY18
FY01-19*
FY19*
According to the Department of Industrial Policy & Promotion (DIPP), cumulative FDI equity inflows1 during April 2000 to December 2018, totalled
to US$ 1.42 billion.
During 2018, 35 IEMs have been filed in Chhattisgarh with a proposed investment of Rs 3,836 crore (US$ 531.67 million).
Note: IEM - Industrial Entrepreneurs' Memorandum, 1includes Madhya Pradesh.
Source: Department Of Industrial Policy & Promotion
13 CHHATTISGARH For information, please visit www.ibef.orgECONOMIC SNAPSHOT – EXPORT TRENDS
Merchandise Exports from Chhattisgarh (US$ billion) Major Commodities Exported in FY19*
1.60 6.06% Alluminium Products
2.46%
1.40 1.52
Rice(Other than
1.20 Basmati)
9.25%
1.18
1.00 37.64% Iron & Steel
0.94 0.95
0.80
18.71% Iron Ore
0.60
0.57
0.40
Products of Iron & Steel
0.20 25.89%
0.00 Others
FY15 FY16 FY17 FY18 FY19*
Total merchandise exports from Chhattisgarh were US$ 1.52 billion in FY18 and US$ 954.85 million between Apr-Dec 2018.
Aluminium products, Non-basmati rice and iron and steel are the main exports, contributing 37.64 per cent, 25.89 per cent and 18.71 per cent,
respectively to the state’s merchandise exports
Iron ore and Products of Iron & Steel are the other major products that account for a significant share in Chhattisgarh’s export basket.
Note: * up to December 2018
Source: DGCIS Analytics
14 CHHATTISGARH For information, please visit www.ibef.orgCHHATTISGARH PHYSICAL INFRASTRUCTURE
PHYSICAL INFRASTRUCTURE – ROADS
Chhattisgarh has an excellent road network. All district headquarters,
tehsils & development blocks are connected with all-weather roads.
PMGSY was launched in 2000 with the objective of connecting
eligible rural habitants. During 2016-17, the state completed 1,020 km
of roads under the scheme while 1,019.57 km were completed in
2017-18. In 2018-19, a target of connecting 800 habitations through
4,000 km of roads in the state has been set under the scheme.
The state has allocated Rs 5,178 crore (US$ 716.87 million) for roads
and bridges under its 2019-20 budget.
Road Network in Chhattisgarh
Type Length (km)
National highways* 3,606
State highways** 4,369
Major district roads** 11,338
Rural and other district roads 14,298
Note: * As of November 2018, ** for 2016-17, PMGSY - Pradhan Mantri Gram Sadak Yojana, updated data is expected in Chhattisgarh Economic Survey 2018-19
Source: **Economic Survey of Chhattisgarh 2017-18, State Budget 2018-19,MapsofIndia
16 CHHATTISGARH For information, please visit www.ibef.orgPHYSICAL INFRASTRUCTURE – RAILWAYS
Rail network across the state
Chhattisgarh’s railways sector falls under the jurisdiction of the
South East Central Railways. The state is well connected to the rest
of the country via rail. Raipur and Bilaspur are the two major railway
stations.
Significant mining and industrial activity in the state was a major
reason behind the setting up of the South East Central Railways in
1998. It is headquartered in Bilaspur.
The state has the highest freight loading capacity in the country and
one-sixth of Indian Railway's revenues come from Chhattisgarh. As
of March 2017, the state had a rail network of 1,213 km.
Direct trains to many cities such as Ahmedabad, Allahabad,
Varanasi, Bengaluru, Cochin, Pune & Hyderabad are also available.
Chhattisgarh state government, in partnership with Indian Railways
will build two fully electrified rail corridors in the state at a cost of Rs
10,000 crore (US$ 1.56 billion). As of October 2018, the Indian
Railways has raised private equity for the first of these corridors.
Note: Updated data for rail network is expected in 2019
Source: Economic Survey of Chhattisgarh, Reserve Bank Of India
17 CHHATTISGARH For information, please visit www.ibef.orgPHYSICAL INFRASTRUCTURE – AIRPORTS
The state has two domestic airports, one at Raipur & the other at
Bilaspur.
Chhattisgarh has 8 air strips located at Bhilai, Bilaspur, Korba,
Raigarh, Jagdalpur, Ambikapur, Jashpur Nagar & Sarangarh.
Raipur is linked by regular flights with New Delhi, Mumbai, Kolkata,
Bhubaneswar, Nagpur, Bhopal, Indore, Ahmedabad & Hyderabad.
ODISHA
In January 2018, Raipur airport awarded for extension of runway
from Airport Authority of India (AAI)
In November 2017, Airports Authority of India (AAI) received
environmental clearance for expansion of Raipur airport runway,
which would allow international operations on the airport.
Domestic airport
Airport Indicators
Passengers Aircraft movement (nos.) Freight (metric tonnes)
Airport Apr 2018- Apr 2018- Apr 2018-
2016-17 2017-18 2016-17 2017-18 2016-17 2017-18
Jan 2019 Jan 2019 Jan 2019
Raipur 1,396,179 1,628,134 1,710,258 11,280 12,802 14,345 4,561 4,093 4,111
Source: Airports Authority of India
18 CHHATTISGARH For information, please visit www.ibef.orgPHYSICAL INFRASTRUCTURE – POWER
Installed Power Capacity (MW) Classification of Installed Power Capacity (February 2019)
18,000
0%
16,000 2%
4%
15,575.50
14,000
13,526.79
13,426.80
12,000
13,085.50
12,509.80
Thermal
10,000
Renewable
9,824.90
8,000
Hydro
6,000
6,531.90
Nuclear
4,769.50
5,347.30
4,882.40
4,000
2,000 94%
0
FY10 FY11 FY12 FY13 FY14 FY15 FY16 FY17 FY18 FY19*
Chhattisgarh is one of the few power surplus states in the country. Korba district in Chhattisgarh is known as the power capital of India. The state's
huge coal reserves present a large opportunity for electricity generation. The state government has declared renewable energy as a priority under
the State Industrial Policy, and estimates solar PV grid potential based on identified sites at approximately 1,000 MW.
As of February 2019, Chhattisgarh had a total installed power generation capacity of 13,526.79 MW, comprising 9,014.30 MW under private
utilities, 2,411.05 MW under state utilities and 2,101.44 MW under central utilities. Energy requirement in the state was 18,531 million units
between Apr-Nov 2018.
For developing and strengthening power infrastructure a five year Capital Investment Plan (CIP) has been chalked out. Under this scheme US$
1.14 billion has been sanctioned for development, during 2016-17 to 2020-21.
Note: * as of February 2019
Source: Central Electricity Authority, Chhattisgarh Economic Survey
19 CHHATTISGARH For information, please visit www.ibef.orgPHYSICAL INFRASTRUCTURE – URBAN
Over the years, Chhattisgarh has been witnessed at faster pace of Consolidated Investments under AMRUT for FY17-20
urbanisation, compared to other states in India. The state and
central governments are working towards accommodating this Investment
Urban Local body Projects
growth and providing necessary amenities in these urban areas. (US$ million)
The Union Government has approved three cities of Chhattisgarh, Raipur 4
13.34
namely, Raipur, Naya Raipur and Bilaspur to be developed as smart
cities. Bilaspur 5
21.16
Under State Budget 2019-20, Rs 396 crore (US$ 54.89 million) has Durg 4
15.52
been allocated for the three smart cities. Bhilai 4
10.46
Upgradation the capital city of Raipur and a new planned city, called Rajnandgaon 5
25.84
‘Naya Raipur’ are under way. Korba 4
12.12
Along with the smart cities, Atal Mission for Rejuvenation and Urban Raigarh 4
12.58
Transformation (AMRUT) was launched for development of tier 2 Ambikapur 5
9.58
and tier 3 cities. Under Atal Mission for Rejuvenation and Urban
Jagdalpur 4
Transformation (AMRUT), Rs 2,192.76 crore (US$ 303.92 million) 10.52
has been allocated to Chhattisgarh as of January 2019.
The state was ranked fourth in achieving targets under AMRUT
mission in 2017-18
Source: Naya Raipur Development Authority, Government of Chhattisgarh, Chhattisgarh Economic Survey 2017-18, Annual Budget 2018-19
20 CHHATTISGARH For information, please visit www.ibef.orgPHYSICAL INFRASTRUCTURE – TELECOM
According to Telecom Regulatory Authority of India (TRAI), Telecom Infrastructure (As of December 2018)
1
Chhattisgarh1 had 76.90 million wireless subscribers and 0.93 million Wireless subscribers (mn) 76.90
wireline subscribers, as of December 2018. Tele density in 1
Wireline subscribers (mn) 0.93
Chhattisgarh1 was 72.29 per cent as of December 2018.
1
Internet subscribers (mn)^ 35.41
Internet subscribers in Chhattisgarh1 reached 35.41 million in
1
September 2018. Tele density (%) 72.29
In order to reduce the digital gap in the state, the government will Performance of Bharat Net
distribute around 5.5 million smartphones for free under Sanchar
Kranti Yojana (SKY). Optical fiber cables laid (as of December 02, 2018,
40,376
in km)
Service ready GPs (March 13, 2019) 4,065
Some of the major telecom operators in Chhattisgarh
Bharat Sanchar Nigam Ltd (BSNL)
Bharti Airtel
Vodafone Idea
Note: 1Including Madhya Pradesh, GP-Gram Panchayat, * till January 2018, ^ - till December 2018
Source: Telecom Regulatory Authority of India; Department of Telecommunications- Ministry of Communications & Information Technology
21 CHHATTISGARH For information, please visit www.ibef.orgCHHATTISGARH SOCIAL INFRASTRUCTURE
SOCIAL INFRASTRUCTURE – EDUCATION
Higher Education Statistics (2017-18) School Education in Chhattisgarh (2017)
Colleges 741 Type No.
Central Universities 1 Primary Only 36,655
Institutes of National Importance 2 Upper Primary Only 14,165
State Private Universities 8
Secondary Only 2,542
State Public Universities 12
Secondary with Higher Secondary 2,817
Gross Enrolment Ratio 18.4
Pupil Teacher Ratio 29 All Schools 61,843
The state government has been focusing on improving infrastructure for school, higher and technical education. Under 2018-19 State Budget, the
state government has allocated Rs 12,472 crore (US$ 1.93 billion) for school education.
There were 61,843 schools operational in Chhattisgarh in 2017. For higher education, there were 741 colleges, one central university, eight state
private universities and 12 state public universities operating in the state in 2017-18.
Chhattisgarh’s Gross Enrolment Ratio (GER) in higher education has increased from 13.6 in 2010-11 to 18.4 in 2017-18.
There were 178 Industrial Training Institutes operational in 2017-18, out of which six were started during the year.
Note: Updated data is expected in Chhattisgarh Economic Survey 2018-19
Source: Economic Survey of Chhattisgarh 2017-18, Department of School Education, Chhattisgarh
23 CHHATTISGARH For information, please visit www.ibef.orgSOCIAL INFRASTRUCTURE – HEALTH
As of February 2019, healthcare services are being provided through Health Infrastructure (as of February 2019)
7,088 sub centres, 1,088 primary health centres, 290 community
health centres, 39 district hospitals and 51 sub district hospitals. Sub-District Hospitals 51
Under State Budget 2019-20, Rs 4,506 crore (US$ 624.55 million) District hospitals 39
has been provided for public family health and family welfare.
Community health centres 290
In 2017-18, the state government announced 15 new nutrition
rehabilitation centres, 25 new sub PHCs and 10 PHCs.
Primary health centres 1,088
Sub-centres 7,088
Health indicators (2017)
Total 8,556
Population served per
1,16,397
government hospital*
Population served per
2,647
government hospital bed*
1
Birth rate 22.8
1
Death rate 7.4
2
Infant mortality rate 39
Note: Updated data is expected in Chhattisgarh Economic Survey 2018-19
Source: Ministry of Health & Family Welfare 1Per thousand persons, 2Per thousand live births, * As of 2015-16, Central Bureau of Health Intelligence, Ministry of Health & Family
Welfare
24 CHHATTISGARH For information, please visit www.ibef.orgCHHATTISGARH INDUSTRIAL INFRASTRUCTURE
INDUSTRIAL INFRASTRUCTURE … (1/2)
The Chhattisgarh State Industrial Development Corporation Ltd (CSIDC) is a part of the industrial development department of the state
government.
As of July 2018, the state had two formally-approved SEZs.
The state has important industrial areas in Bhilai (home to iron and steel ancillary units) and Korba (home to well known companies in the power
and aluminium sectors).
Chhattisgarh - SEZs
SEZ Name Location Type
Lanco Solar Pvt. Ltd Village- Mehrumkhurd & Chawardhal, Chhattisgarh Semiconductors
Formal approvals granted SEZ
Naya Raipur Development Authority (NRDA) Naya Raipur, Chhattisgarh IT/ITeS
Mahroomkala, Mahroomkurd and Chaveli villages, Rajnandgaon
Lanco Solar Private Limited Solar
District, Chhattisgarh
Valid in-principle approvals
Chhattisgarh Infrastructure Ltd. Raipur, Chhattisgarh Gems & jewellery
Notified SEZs
Lanco Solar Private Limited Chaveli villages, Rajnandgaon District, Solar
Note: 1PPP (Public-Private Partnership) mode
Source: CSIDC
26 CHHATTISGARH For information, please visit www.ibef.orgINDUSTRIAL INFRASTRUCTURE… (2/2) - KEY
INDUSTRIAL GROWTH CENTRES
Large industrial areas
5 Dagori (Bilaspur)
7 Tilda (Raipur)
19 Lara (Raigarh)
31 Silpahari (Bilaspur)
Key industrial parks
13 Food Processing Park (Indawani)
26 Herbal & Medicinal Park (Raipur)
25 Gems & Jewellery SEZ (Raipur)
23 Metal Park (Rawabhata)
24 Apparel Park (Raipur)
10 Engineering Park (Bhilai)
28 Aluminium Park (Korba)
Key industrial areas
9 Urla (Raipur)
8 Siltara (Raipur)
3 Sirgitti (Bilaspur)
11 Borai (Durg)
21 Bhanpuri-Rawabhata (Raipur)
29 Tifra (Bilaspur)
2 Rani Durgawati (Pendraroad)
14 Heavy & Light I/A, Bhilai
Source: CSIDC website, Korba district website, Invest India
27 CHHATTISGARH For information, please visit www.ibef.orgCHHATTISGARH KEY SECTORS Agriculture and Allied Industries Metals & Minerals Cement Apparel
KEY SECTOR – AGRICULTURAL AND ALLIED
INDUSTRIES… (1/2)
Agriculture Production (‘000 metric tonnes)
Around 80 per cent employment in the state is dependent on
Agriculture, with over 3.7 million farming families, according to state’s Crops 2015-16 2016-17 2017-18
Economic Survey 2017-18. The state’s position as the ‘Rice Bowl of
Central India’ and its reliance on agriculture have led to brisk growth Rice 5,789.4 8,048.4 4,725.5*
in the food processing industry as a special-thrust industry. Wheat 137.4 159.5 130.7*
Pulses 511.9 758.7 543.3*
Non-Basmati rice is the most exported commodity from the state. Its Food grains 6,654.2 9,228.2 5,746.4*
exports reached US$ 531.54 million in FY18 and US$ 247.18 million Oilseeds 149.6 169.6 122.9*
between Apr-Dec 2018.
Sugarcane 67.8 49.3 1247.0*
Total horticulture production in the state reached 9,762.67 thousand
metric tonnes in 2018-19 with 779.61 thousand hectares of area
under cultivation. Rice production in Chhattisgarh in 2017-18 reached
4,725.5* metric tonnes and 6,298.8** metric tonnes during 2018-19.
Production of pulses reached 543.3* metric tonnes of in 2017-18 and
92.9** metric tonnes in 2018-19. In 2018-19**, production of food
grain, oilseeds and sugarcane reached 6,741.9 metric tonnes, 145.9
metric tonnes and 1427.9 metric tonnes, respectively.
One mega food park and two food parks in the state have been
notified by Ministry of Food Processing, government of India.
Note: * - 4th advance estimates, ** - 1st advance estimate (Kharif only)
Source: Chhattisgarh Economic Survey 2017-18, Ministry of Agriculture- Department of Agriculture & Cooperation, Ministry of Food Processing
29 CHHATTISGARH For information, please visit www.ibef.orgKEY SECTOR – AGRICULTURAL AND ALLIED
INDUSTRIES… (2/2)
Key players
Bharat Agro Industries Bharat Agro mainly manufactures Cassia and Guar products and trades in spices, pulses, oilseeds and
other agro products.
The company operates India’s second largest Cassia Tora Splits manufacturing facility in Raipur,
Chhattisgarh. The facility was established in 2004.
Agricons Agro Producer Company Limited was started in 2005 as Chhattisgarh Agricon Pvt. Ltd with
Agricon various famers as its shareholders.
The company produces bio fertilizers and micro nutrients. It also provides micro irrigation solutions to
farmers.
Chhattisgarh Agricon Samiti works with more than 75,000 families in 15 districts of the state.
30 CHHATTISGARH For information, please visit www.ibef.orgKEY INDUSTRIES – METALS & MINERALS … (1/2)
Chhattisgarh’s mineral production (in million tonnes)
Value of Mineral production (US$ billion)
Production in 2017- Production in 2018-
Mineral
18 19*
2.00
1.80 Coal 142.51 40.42
1.60 1.71 1.74
1.62 1.63
1.40
1.42 Iron ore 34.55 7.89
1.20
1.00
0.80 Bauxite 2.56 0.38
0.87
0.60
0.40 Limestone 36.35 10.84
0.20 0.32
0.00 Tin
FY13 FY14 FY15 FY16 FY17 FY18 FY19* 1 16,758 2,381
(concentrate)
Chhattisgarh is among the richest Indian states in terms of mineral wealth, with 28 varieties of major minerals including diamonds. It is the only
state in India that produces concentrated tin. Rich deposits of bauxite, limestone, dolomite and corundum are found in the state, making it the ideal
location for low-cost production of end products such as cement and aluminium.
Value of minerals produced (excluding atomic, fuel and minor minerals) in the state in 2017-18 was Rs 9,184 crore (US$ 1.42 billion).
Production of varied metals such as iron ore, tin and limestone in a single location also makes Chhattisgarh an ideal location for different final
products such as iron and steel, cement and electronic components.
Chhattisgarh's combined exports of aluminium & products, iron & steel, iron ore and iron & steel products from Chhattisgarh reached US$ 931.63
million in FY18 and US$ 266.97 million between Apr-Dec 2018.
Note: 1In kilograms, * as up June 2018.
Source: Chhattisgarh’s Directorate of Geology and Mining, Economic Survey of Chhattisgarh 2017-18, Indian Bureau of Mines
31 CHHATTISGARH For information, please visit www.ibef.orgKEY INDUSTRIES – METALS & MINERALS … (2/2)
Key players
NMDC is the country’s single-largest iron ore producer and exporter. It produces about 30 million tonnes of iron
ore from its fully-mechanised mines. The company operates two mines at Bailadila in Chhattisgarh. In 2014-15,
the company produced 304.41 lakh tonnes of iron ore, 28,994 tonnes of sponge iron and 35,085 carats of
diamonds.
It is gearing up to enhance the production capabilities of existing mines and open up new mine deposit – 11B in
Bailadila sector and Kumaraswamy in Donimalai sector. The company is in the process of developing a 3 MTPA
steel plant at Jagdalpur and two pellet plants at Donimalai (1.2 MTPA) and Bacheli (2 MTPA).
NMDC Ltd
Jayaswal Neco Industries Ltd, started in 1976, is a flagship company of Neco Group of Industries. It has three
divisions: steel plant, foundry and mining. The company owns a coal mine with reserves of about 38.84 MT in
Jayaswal Neco Raigarh district and produces 0.48 MTPA of coal mineral.
Industries Ltd
A flagship company of the Hira Group of Industries, Godawari Power is an integrated steel producer of mild steel
wires. It also produces sponge iron, billets, ferro-alloys, wire rods, steel wires, fly-ash bricks etc. GPIL has started
its operations in Raipur, Chhattisgarh, as a iron manufacturer in the year 2001 and has also been granted two
mining leases by the state at Ari Dongri and Boria Tibu.
Godawari Power &
Ispat Ltd
32 CHHATTISGARH For information, please visit www.ibef.orgKEY INDUSTRIES – CEMENT … (1/2)
Major Integrated Cement Units in Chhattisgarh Supplying to
Chhattisgarh has abundant limestone reserves that support a strong
Other States*
cement sector. Chhattisgarh accounts for around 5.4 per cent of the
total limestone reserves in India.
Limestone production in the state reached 36.35 million tonnes in
2017-18 and 10.84 million tonnes in 2018-19 (up to June 2018).
The state has ten major operational cement units; majority of the
cement production units are concentrated in the Raipur area, Baloda
Bazar, Durg and Champa.
Shree Cement has established a clinker manufacturing plant in
Raipur, Chhattisgarh with 1.5 million tonnes per annum capacity.
Export of cement, clinkers and asbestos cement from the state
reached US$ 10.13 million in FY18 and US$ 4.07 million between
Apr-Sep 2018.
Source: Economic Survey of Chhattisgarh, Ministry of Mines, *JM Financial- - Cement Sector Update April 2018
33 CHHATTISGARH For information, please visit www.ibef.orgKEY INDUSTRIES – CEMENT … (2/2)
Key players
With a production capacity of 30 MTPA, ACC is among the largest research and consultancy organisations in the
Indian cement sector and a pioneer in the area of advanced materials. ACC plans to modernise its cement plant at
Jamul in the Korba district with an investment outlay of US$ 499 million, and set up a 4 MTPA production capacity.
ACC Ltd
JK Lakshmi Cement Ltd is a renowned and well established name in the Indian cement industry. Its cement comes
in three variants: Cement 53 blended, 53 grade OPC and 43 grade OPC. As a part of its US$ 248.8 million
expansion plan in Chhattisgarh, the company introduced a cement manufacturing facility at Durg (Chhattisgarh),
JK Lakshmi Cement which enhanced its installed production capacity to 9.3 MTPA. The plant started production in January 2015
Ltd
Ultra Tech Cement is a part of the Aditya Birla Group and has an annual capacity of 57 MTPA. It manufactures
ordinary portland cement, Portland blast-furnace slag cement, Portland pozzolana cement, ready mix concrete,
and building products and building solutions. The company has 11 integrated plants and 15 grinding units in India.
Its plants in Chhattisgarh are located at Hirmi and Rawan.
It has started a US$ 297 million capacity expansion project at Chhattisgarh with a funding of US$ 100 million from
UltraTech Cement Ltd International Finance Corporation.
34 CHHATTISGARH For information, please visit www.ibef.orgKEY SECTOR – APPAREL
Chhattisgarh is one of the leading producers of tussar and kosa silks
Chhattisgarh’s raw silk production (in MT)
in the country and has the potential to be a strong player in the Indian
apparel industry. Raw silk production in the state reached 553 metric 600
tonnes in 2017-18. Between Apr-Sep 2018, raw silk production has
553
been 92 metric tonnes. 500
The government is set to implement a policy, Tussar Resham Vision
400
2020-21, for supporting silk production in the state. 391 391
361
With the help of Apparel Export Promotion Council, three Apparel 300
Training & Designing Centres (ATDC) have been set up in 263
200 234
Chhattisgarh at Bilaspur, Raipur and Bhilai. These training centres
provide manpower to the state’s apparel industry.
100
Khadi is another important textile produced in Chhattisgarh. The 92
Khadi and Rural Industries Board is operational in the state and aims
0
at promoting and developing khadi and village industries in rural 2012-13 2013-14 2014-15 2015-16 2016-17 2017-18 2018-19*
areas using advanced technology and generating employment
opportunities.
Note: * up to September 2018
Source: Chhattisgarh State Industrial Development Corporation (CSIDC), News articles Central Silk Board
35 CHHATTISGARH For information, please visit www.ibef.orgCHHATTISGARH KEY PROCEDURES & POLICIES
KEY APPROVALS REQUIRED
Prior to setting up business in Chhattisgarh, certain approvals are required from different departments. The approvals are to be taken from the
state government in the following order:
CSIDC allots the plot for setting up a project depending on the nature of industry and scale of
Step 1: Allotment of plots/built-up sheds investment.
Step 2: Signing of the lease deed The lease deed is signed between the CSIDC and land applicant.
The completed application form should be submitted to CSIDC, which is also responsible for
Step 3: Water connection providing water connection.
Step 4: Electricity connection CSIDC is responsible for providing electricity connection.
An application in prescribed format is submitted to the District Trade & Industries Centre (for
Step 5: Pollution clearance investment up to US$ 2.19 million)/State Investment Promotion Board (for investment above
US$ 2.19 million) with an environment impact assessment report.
Source: Commissionerate of Industries, Government of Andhra Pradesh
37 CHHATTISGARH For information, please visit www.ibef.orgCHHATTISGARH INDUSTRIAL INVESTMENT
PROMOTION RULES, 2004 … (1/3)
Name of clearance/activity No of days
Preliminary meeting with the convener after the expression of intent by investor 7
Arranging site visit for identification of land for investor's project after preliminary meeting 21
Provisional registration of small-scale industry at District Trade & Industries Centre 3
Issuance of letter of intent for the allotment of CSIDC industrial land 21
Forwarding of investor's proposal by CSIDC/Directorate of Industries to District Collector for the transfer
21
of Government land
Forwarding investor's proposal by CSIDC/Directorate of Industries to the Government for acquisition of private land 21
Approval by Government on land acquisition proposal 30
Issuance of notification by the District Collector under Section 4 of the Land Acquisition Act, 1894:
a) 30
a) Intimation of anticipated compensation amount to the investor
b) 7
b) Publication of Section 4 Notification After deposit of anticipated compensation amount
Issuance of certificate for exemption from payment of stamp duty by:
a) 7
a) District Trade & Industries Centre
b) 15
b) Directorate of Industries
Issue of No-Objection Certificate (NOC) from local bodies for establishment of industry 30
Grant of permission for building construction from Gram Panchayat 30
Grant of permission for development of land under the Chhattisgarh Nagar Tatha Gram Nivesh Adhiniyam, 1973 60
Source: Chhattisgarh Industrial Investment Promotion Rules 2004, State Investment Promotion Board, Government of Chhattisgarh
38 CHHATTISGARH For information, please visit www.ibef.orgCHHATTISGARH INDUSTRIAL INVESTMENT
PROMOTION RULES, 2004 … (2/3)
Name of clearance/activity No of days
Grant of permission of land diversion 90
Grant of permission to develop, erect, re-erect or to make alteration in any place in a building under Chhattisgarh
30
Nagar Tatha Gram Nivesh Adhiniyam, 1973
Sanction of allotment of water from Water Resource Department:
a) 60
a) At the applied site
b) 90
b) At different site
Issuance of power availability certificate by CSEB 30
Sanction of power supply for Low Tension (LT) connection by CSEB 45
Sanction of power supply for High Tension (HT) connection by CSEB 60
Approval of drawings by Electrical Inspector 15
Environment consent for small scale industry under simplified procedures by District Trade & Industries Centre 10
Consent for establishment of industry under Water (Prevention & Control of Pollution) Act, 1974 120
Consent for establishment of industry under the Air (Prevention & Control of Pollution) Act, 1981 120
Registration and grant of license under the Factories Act, 1948 90
Source: Chhattisgarh Industrial Investment Promotion Rules 2004, State Investment Promotion Board, Government of Chhattisgarh
39 CHHATTISGARH For information, please visit www.ibef.orgCHHATTISGARH INDUSTRIAL INVESTMENT
PROMOTION RULES, 2004 … (3/3)
Name of clearance/activity No of days
Sanction of power supply for Low Tension (LT) connection by CSEB 45
Sanction of power supply for High Tension (HT) connection by CSEB 60
Approval of plans and permission to construct/extend or take into use any building as a factory under the
90
Factories Act, 1948
Approval of site for hazardous process factory under the Factories Act, 1948 90
Registration of establishment under the Contract Labour (Regulation & Abolition) Act, 1970 30
Registration of boiler under Indian Boiler Act, 1953 30
Registration under Chhattisgarh Vanijyik Kar Adhiniyam, 1994 1
Registration under the Central Sales Tax Act, 1956 1
Permission for use of forest land for non-forest purposes under Forest (Conservation) Act, 1980
a) 90
a) New application
b) 30
b) Renewal of application
Permanent registration of small scale industry at the District Trade & Industries Centre 21
Production certificate for medium and large scale industry from the District Trade & Industries Centre 21
Source: Chhattisgarh Industrial Investment Promotion Rules 2004, State Investment Promotion Board, Government of Chhattisgarh
40 CHHATTISGARH For information, please visit www.ibef.orgCONTACT LIST
Agency Contact information
1st Floor, Udyog Bhawan, Ring Road No.,- 1,
Telibandha, Raipur, Chhattisgarh India
Phone: 91-771-2583 793/4070 534/2583 789
Chhattisgarh State Industrial Development Corporation (CSIDC)
Fax: 91-771-2583794
E-mail: csidc.cg@nic.in
Website: www.csidc.in
Near Mantralaya, Renuka Dwar,
Shastri Chowk,
Raipur, Chhattisgarh - 492 001
State Investment Promotion Board
Phone: 91-771-4066351,4066352
Fax: 91-771-4066315
E-mail: sipb.cg@nic.in
41 CHHATTISGARH For information, please visit www.ibef.orgCOST OF DOING BUSINESS IN CHHATTISGARH
Cost parameter Cost estimate
Industrial land in SMART city (per sq ft) From US$ 3.1
Office space rent (per sq ft) US 70 cents to US$ 2.8 per month
Domestic: US 2.98 cents to US 6.46 cents
Fixed Power cost (per kWh) Commercial: US 2.76 cents to US 9.95 cents
Industrial: US 3.70 cents to US 9.95 cents
Unskilled: ~US$ 4.65
Labour cost (minimum wage per day) Semi-Skilled: ~US$ 5.35
Skilled: ~US$ 5.51
As per the World Bank and Department of Industrial Policy and Promotion (DIPP) report - Assessment of State Implementation of Business
Reforms 2017, the state ranked 6th in the Ease of Doing Business ranking.
Source: Industry sources, Ministry of Labour and Employment, Government of India, Chhattisgarh State Electricity Regulatory Commission
42 CHHATTISGARH For information, please visit www.ibef.orgSTATE ACTS AND POLICIES … (1/2)
Objectives
To boost industrialisation in the state.
Industrial Policy 2014-19
To attract private sector participation for infrastructure development
Read more
Electronic & IT/ITeS To develop ecosystem for aiding improvisation in the knowledge economy of the state
Investment Policy
2014-2019 To attract investments in the state and develop online Single Window Portal
Read more
To ensure the effective participation of women in political, social and economic life of the state.
To provide equal accessibility to the resources for self reliance of the women.
State Policy for Women
Chhattisgarh Right of Youth to
Skill Development Act, 2013. Read more
Chhattisgarh Solar To encourage and promote solar power generation in the state
Policy 2012 To aid renewable power generation and meet growing demand in a sustainable manner
Read more
To enhance the income of the farmers in the state and generate employment opportunities
Agro & Food Processing
Industries Policy – 2012 To encourage farmers to engage in diversified farming of fruits and vegetables and other cash crops in order to
develop agro & food processing industries. Read more
43 CHHATTISGARH For information, please visit www.ibef.orgSTATE ACTS AND POLICIES … (2/2)
Objectives
To harness the existing metal resources in the state for the development of automotive sector
Automotive Policy - 2012
To encourage establishment of automotive industries in the state.
Read more
To establish an investor-friendly business environment in the mining sector in order to attract both domestic and
Mineral Policy 2001
international private sector investors.
Read more
Chhattisgarh has immense potential for coal-based thermal power generation. The policy aims to accelerate the
Energy Policy 2001 pace of development of the sector, bring it at par with other developed states, and ensure the availability of reliable
and cheap electricity to every section of society, both in the rural and urban areas.
Read more
To enable local communities to get optimal advantage of their natural, bio-cultural and bio-knowledge heritage in a
sustainable manner.
Biotechnology Policy To institutionalise major capabilities in biotechnology research and development in general, with particular focus
on indigenous knowledge systems and their applications in furthering socio-economic growth.
To facilitate an environment for research through development of infrastructure and appropriate incentives.
Read more
Special Economic Zone To enhance the industrial and economic development of the state of Chhattisgarh.
Policy To create employment opportunities amongst the youth of Chhattisgarh.
Read more
44 CHHATTISGARH For information, please visit www.ibef.orgCHHATTISGARH ANNEXURE
ANNEXURE…(1/2) - SOURCES

                         Data                                                               Sources

     GSDP (state)                                                    Directorate of Economics & Statistics of Chhattisgarh

     Per capita GSDP figures                             Directorate of Economics & Statistics of Chhattisgarh, Central Statistics Office

     GSDP (India)                                                                   Central Statistics Office

     Installed power capacity (MW)                                                 Central Electricity Authority

     Wireless subscribers (No)                                               Telecom Regulatory Authority of India

     Internet subscribers (Mn)                                               Telecom Regulatory Authority of India

     National highway length (km)                                 NHAI, Roads and Building Department-Government of India

     Airports (No)                                                                 Airports Authority of India

     Literacy rate (%)                                                                    Census 2011

     Birth rate (per 1,000 population)                                           SRS Bulletin September 2017
     Cumulative FDI equity inflows (US$ billion)                          Department of Industrial Policy & Promotion
     Operational PPP projects (No)                                      DEA , Ministry of Finance, Government of India

     Operational SEZs (No)                         Notified as of December 2017, Ministry of Commerce & Industry, Department of Commerce,
                                                                                        December 2017

46    CHHATTISGARH                                                                                      For information, please visit www.ibef.org
ANNEXURE…(2/2) - EXCHANGE RATES
Exchange Rates (Fiscal Year) Exchange Rates (Calendar Year)
Year INR INR Equivalent of one US$ Year INR Equivalent of one US$
2004–05 44.95 2005 44.11
2005–06 44.28 2006 45.33
2006–07 45.29
2007 41.29
2007–08 40.24
2008 43.42
2008–09 45.91
2009 48.35
2009–10 47.42
2010–11 2010 45.74
45.58
2011–12 47.95 2011 46.67
2012–13 54.45 2012 53.49
2013–14 60.50 2013 58.63
2014-15 61.15
2014 61.03
2015-16 65.46
2015 64.15
2016-17 67.09
2016 67.21
2017-18 64.45
2017 65.12
Q1 2018-19 67.04
Q2 2018-19 70.18 2017 68.36
Q3 2018-19 72.15 2018 68.36
Source: Reserve Bank of India, Average for the year
47 CHHATTISGARH For information, please visit www.ibef.orgDISCLAIMER
India Brand Equity Foundation (IBEF) engaged Aranca to prepare this presentation and the same has been prepared by Aranca in consultation with
IBEF.
All rights reserved. All copyright in this presentation and related works is solely and exclusively owned by IBEF. The same may not be reproduced,
wholly or in part in any material form (including photocopying or storing it in any medium by electronic means and whether or not transiently or
incidentally to some other use of this presentation), modified or in any manner communicated to any third party except with the written approval of
IBEF.
This presentation is for information purposes only. While due care has been taken during the compilation of this presentation to ensure that the
information is accurate to the best of Aranca and IBEF’s knowledge and belief, the content is not to be construed in any manner whatsoever as a
substitute for professional advice.
Aranca and IBEF neither recommend nor endorse any specific products or services that may have been mentioned in this presentation and nor do
they assume any liability or responsibility for the outcome of decisions taken as a result of any reliance placed on this presentation.
Neither Aranca nor IBEF shall be liable for any direct or indirect damages that may arise due to any act or omission on the part of the user due to any
reliance placed or guidance taken from any portion of this presentation.
48 CHHATTISGARH For information, please visit www.ibef.orgYou can also read