Children's social care cost pressures and variations in unit costs - January 2021
←
→
Page content transcription
If your browser does not render page correctly, please read the page content below
Children’s social
care cost pressures
and variations in unit
costs
Research report
January 2021

Lisa Holmes, Rees Centre, University
of Oxford
Contents
List of figures                                                     4
List of tables                                                      5
Introduction                                                        6
Background and context                                              7
Methodology                                                         10
  Cost pressures survey                                             10
  Existing research                                                 11
     Research conceptual framework                                  12
     Time use data                                                  13
     Bottom-up unit cost estimations                                14
Findings                                                            16
  Overarching issues and cost pressures                             16
  Factors outside the control of children’s social care             17
  Rising unit costs                                                 18
  Variations                                                        19
     Variations in spend                                            19
     Variations in overheads                                        23
     Variations in time use                                         24
     Unit costs calculations                                        24
  Issues and solutions                                              27
     Placement commissioning and expansion of in-house placements   27
     Regional consortia                                             28
  Pressures and forecasts                                           28
  Plans to achieve efficiencies                                     30
Conclusion                                                          32
Recommendations                                                     33
References                                                          35
Appendices                                                          39
  Appendix A: Examples of time use variations                       39

                                             2
Children in need processes 39
Looked after children processes 40
Appendix B: Unit costs 41
3List of figures
Figure 1: Context and conceptual framework for children’s social care 18
4List of tables
Table 1: Child in need (including child protection and looked after children) social care
processes 13
Table 2: Percentage of looked after children budget spent on the 10 most expensive
placements 22
Table 3: Overhead as a percentage of gross spend on service area (range) 23
Table 4: Percentage of 2019-20 social care grant allocated to children’s social care 30
Table 5: Children in need processes and bottom-up unit costs 41
Table 6: Looked after children processes and bottom-up unit costs 42
Table 7: Looked after children: illustrative conditional unit costs 43
5Introduction
This report brings together findings from a recent data collection template completed by
13 local authorities in England (termed here the cost pressures survey) and existing
research evidence to explore the unit costs of providing children’s social care services.
The findings from existing research are focused on the use of a bottom-up unit costing
methodology to explore different parts of the children’s social care system and to identify,
and account for variations, based on qualitative responses from the cost pressures
survey. The focus of this report is on all children in need, including those who are looked
after. The findings are also positioned within the wider evidence base covering issues
related to demand and expenditure on children’s social care.
The project was carried out between April and July 2019 and was commissioned as a
small-scale research study via the Department for Education Analytical Associate Pool.
The project was commissioned to support and supplement internal analysis by the
Department for Education as part of the preparations for the spending round in summer
2019. The project aimed to examine and categorise reasons for variations in the unit
costs of providing children’s social care and to highlight the reported cost pressures that
local authorities are currently experiencing.
6Background and context
In recent years a series of reviews and research studies have highlighted and raised
concerns about the increased demand for children’s social care services (ADCS, 2018;
LGA, 2017; Thomas 2018), at a time when budgets are increasingly constrained (Kelly et
al., 2018; Stanford and Lennon, 2019). A recent evidence review of children’s
vulnerability and social care (Crenna-Jennings, 2018) highlighted an increase in the
number of child protection plans, cuts to early intervention services and growing
pressures on children’s social care. The latest Association of Directors of Children’s
Services Safeguarding Pressures survey published in late 2018 highlighted an increased
demand across all areas of children’s social care since 2008 (ADCS, 2018). This sixth
phase of the Safeguarding Pressures study presents findings from 140 local authorities
(92%) and makes use of the data from the previous years (dating back to 2007-08) to
facilitate the use of predictive modelling to estimate future demand. Concerns about the
increased demand for children’s social care services led to a recent sector-led review
which concluded that there is a crisis across children’s social care and family justice
(Care Crisis Review, 2018). That review considered the factors that have contributed to
the increase in the number of children being placed in care and the increase in referrals
to children’s services and also set out 20 options for change (ibid). The review
highlighted the complex interplay between a range of factors that impact on thresholds
and referral rates and highlighted evidence showing an association between socio-
economic and environmental factors, and rates of children in need. However, the review
also highlighted that statistical neighbours to a given local authority (for example,
authorities that have similar economic and demographic characteristics to the authority in
question) can have marked differences in their rates of children coming into care. In a
recent evidence review, Bywaters and colleagues (2016) argue that socio-economic
factors partly influence the likelihood of children suffering abuse and or neglect. They
present consistent and robust evidence mainly from outside the UK on the link between
poverty and child abuse and neglect, with the more limited evidence base from UK
supporting the transferability of these findings. The paper contains a substantive
discussion about socio-economic or socio-cultural factors that should be collected from
children’s social care users to build the evidence base on the link between poverty and
abuse and neglect. These include Index of multiple deprivation, free school meals,
unemployment rates and take-up of out of work benefits.
There is also a growing evidence base of the impact of increased demand and realised
children’s social care service receipt at a time of continued austerity and reductions in
children’s social care budgets, which have placed pressures on children’s social care
(Thomas, 2018; Kelly, Lee, Sibieta and Waters, 2018). Hood and colleagues (2019) in
their recent analysis have highlighted the complex relationship between demand (as
represented in the national trend data from both the Department for Education and
CAFCASS) and the ways in which demand (for example, referrals, children in need and
7child protection plans) is managed within local authority children’s services departments.
Furthermore, a recent report by the Office of the Children’s Commissioner (Stanford &
Lennon, 2019) has highlighted the pressures on budgets, and attributes some of these
pressures to the reduction in pre-statutory services to support children and their families.
The report also emphasised that in 2017-18 91% of local authorities had overspent on
their children’s services budget (ibid). Spend by local authorities is reported annually as
part of the section 251 return and is broken down by services for looked after children,
child protection and safeguarding, family support, as per the categories defined for the
purposes of reporting 1.
Previous research has highlighted the limitations of annual aggregate level children’s
social care expenditure data when used as a means to understand expenditure variation
or expenditure changes over time (Beecham & Sinclair, 2007; Holmes & McDermid,
2012; Ward et al., 2008). The annual expenditure returns (section 251) provide data for a
very specific purpose and can only facilitate top-down estimates of unit costs. As an
example, local authorities report total annual expenditure on their fostering services in the
section 251 return. This can be divided by the number of children in foster care
placements by the number of care days in foster care provision over the course the year).
Top-down unit costs like this provide a useful indication of expenditure across different
parts of the children’s social care system, and provide year on year analyses of trends in
expenditure, but they do not sufficiently capture the level of complexity or nuance of
children’s social care. For example, they do not capture, or account for the needs of the
children and families (Stanford and Lennon, 2019) and whether service responses differ
for children, young people and their families. Furthermore, while the section 251 data
provides an indication of the differences in unit costs between local authorities, it does
not offer any explanation as to the reasons for these differences, and whether they are as
a consequence of differences in the populations referred, their needs, the service
responses and the wider context, or are as a result of different approaches to the
completion of the statutory expenditure returns.
Recent reports have also highlighted the variability in reported unit costs (or mean costs)
that cannot be explained (Narey and Owers, 2018; Stanley and Rome, 2013). This often
reflects differences in the data sources being used and the construction of the unit costs.
The findings section of this report aims to provide some clarity and go some way to
explain the variability in unit costs, although as highlighted recently by Stanford and
Lennon (2019) there is limited data to make informed decisions about funding allocation
1
Section 251 of the Apprenticeships, Skills, Children and Learning Act (2009) requires local authorities to
submit statements about their planned and actual expenditure on education and social care.
https://www.gov.uk/guidance/section-251-2018-to-2019
8for services, particularly in terms of the degree to which it is possible to link spending to
need or to trace the outcomes and impact of spending.
9Methodology
The project comprised development of a survey completed by a small sample of local
authorities, an examination of the survey responses, and a review of existing evidence on
the bottom-up 2 unit costs of children’s social care and how this relates to the survey
responses.
The evidence from the survey and the bottom-up unit costs are also used to explain the
cost implications associated with observed national and local authority level changes in
children’s social care demand. The bottom-up unit costs facilitate a more detailed
analysis of particular features related to the increased demand referred to above, for
example, the increase in the adolescent population of looked after children. The
children’s social care unit costs have also been used to explore the national cost
implications of the increase in child protection plans and numbers of looked after
children.
Cost pressures survey
The costs pressures survey was initially developed by the DfE for internal analysis. It was
subsequently updated following discussions with the Rees Centre, to be used for this
project. The survey forms part of the DfE’s wider ongoing work to understand children’s
social care service cost and demand, and the challenges and opportunities for further
efficiencies in the delivery of children’s social care services. Local authorities were
approached to take part in the work via the Association of Directors of Children’s
Services (ADCS) and the Service Working Group on Education and Children’s Services
(SWGECS) 3. The primary purpose of the survey was to fill in gaps in national data to be
able to quantify the impact of changing service demands. For example, understanding
spend attributable to particular social work activity and/or cohorts of children, workforce
spend and placement costs. The survey also provided an opportunity for local authorities
to submit contextual qualitative information, both in terms of the pressures they are
experiencing, and the ways in which their spend data are prepared for submission.
Cost pressures surveys were received by 13 local authorities between March and July
2019. Another local authority also submitted a survey to the DfE for their internal
2
There are 2 approaches to estimating unit costs: top-down or bottom-up. The former assembles all
relevant expenditure and divides it by units of activity. A bottom-up approach focuses on all aspects of a
service and encourages an understanding of the services being costed, how they are provided and who is
involved. See Beecham (2000) for further information.
3
The Service Working Group on Education and Children’s Services (SWGECS) facilitates exchanges
between local authority finance representatives and the Department for Education on matters concerned
with revenue and capital expenditure on education and children’s services.
10analysis, but did not give permission for it to be included in this study. A further 3 local
authorities declined to participate as a result of insufficient capacity to return the survey
within the required timeframe. The 13 local authorities are not representative, but include
a mix of types of local authority (London borough, unitary, metropolitan, shire) and
geographical location, with multiple regions represented. The survey included seven
overarching sections:
Section one: overview of expenditure
Section two: placements
Section three: social work
Section four: care leavers
Section five: service pressures
Section six: how efficiencies have been achieved and examples of best practice
Section seven: plans to deliver more efficiencies and savings
The cost pressures surveys were predominantly completed by local authority finance
managers and each section comprised both quantitative and qualitative data. The level of
detail recorded in the surveys was variable, with some local authorities completing all
sections and providing detailed qualitative information to accompany their data. Some of
the participating local authorities also submitted accompanying Excel files with
supplementary information related to their expenditure, including detailed salaries and
payments for placements (fees and allowances).
Existing research
In addition to the cost pressures surveys, the existing studies that inform the analysis and
findings included in this report consist of the following:
• an exploration of the relationship between needs, costs and outcomes carried out
in 6 local authorities (Ward, Holmes and Soper, 2008)
• consideration of cost and capacity issues in local authorities following the Laming
Review (2009), including a survey with 46 local authorities, and in-depth case
study work in 9 local authorities (Holmes, Munro and Soper, 2010)
• an exploration of all services and support provided to children in need, including
detailed mapping carried out in 15 local authorities and in-depth case study work
in 4 local authorities (Holmes and McDermid, 2012)
• a Research in Practice change project to explore the nature and availability of data
to cost edge of care services. This project was carried out with 19 local authorities
and was also used as an opportunity to re-validate and update the time use data
from the aforementioned studies to ensure that they are still applicable (Bowyer et
al, 2018).
11The first three studies listed above were mixed-methods and included an examination of
the needs and circumstances of children and young people in receipt of children’s social
care, the support and services received and the outcomes achieved. All of these projects
utilised the same conceptual framework and overarching methods for collecting time use
data, and calculating bottom-up unit costs. These are outlined in the following sections.
The fourth project comprised a series of action learning sets with 3 representatives from
the 19 local authorities: a finance lead; performance and data manager lead and a
strategic lead for edge of care services.
Research conceptual framework
The conceptual framework for the studies listed above was first developed in the early
2000s with a focus on looked after children and has since been expanded for other parts
of the children’s social care system in England, including all child in need and child
protection cases. This conceptual framework formed the basis for the calculation of
bottom-up unit costs for children’s social care detailed below. The conceptual framework
has also been tested, piloted and adapted for the Scottish and US child welfare contexts
(Holmes et al, 2014).
The conceptual framework was initially developed for the research to introduce a
systematic way to understand the children’s social care support that is provided to
children and young people from the point of referral until the case is closed. As such, a
process driven approach is used to categorise all activities into processes. These
processes were initially based on those outlined in the Core Information Requirements
Process Model (Department of Health, 2001) and have since been updated to reflect
changes in policies and practice in the intervening years, for example, the introduction of
the Single Assessment as a replacement for Initial and Core Assessments. The
conceptual framework also makes an important distinction between services, for
example, placements, or an intervention that is either provided by or commissioned by
the local authority and support, for example, the activities carried out by social workers
and others to support the case. This distinction facilitates an exploration of the costs
associated with supporting children and young people in their placements in addition to
the fees and allowances that are paid. This element is often lacking in many analyses
that seek to compare the costs of local authority and independent sector placements
(Ward, Holmes and Soper, 2008; Narey and Owers, 2018).
The processes for children in need, child protection and looked after children are detailed
in Table 1. As part of the methodology, each of the processes is broken down into its
constituent parts, and within each process, all of the activities carried out by a range of
children’s social care practitioners have been identified. The activities to be included in
each of the processes were determined by an exploration of local authority policy and
procedure documents and then subsequent discussions with key personnel in local
12authorities participating in the range of studies detailed above. This then formed the basis
of the conceptual framework which has been utilised for the time use studies. To note,
the processes detailed in Table 1 are not linear, and not all are carried out for all cases,
for example not all children in need will become looked after, and others will oscillate
between children in need and looked after children. The complexity of the pathways of
children and young people supported by children’s social care was recently highlighted
as part of longitudinal analysis carried out by the Department for Education (2018a).
Furthermore, some of the processes are one-off events, and others such as process 3
(for both looked after children and children in need) happen over the complete time
period from when a case opens until case closure.
Table 1: Child in need (including child protection and looked after children) social
care processes
Process Description
Child in need process 1 Initial contact and referral
Child in need process 2 Single assessment
Child in need process 3 Ongoing support
Child in need process 4 Close case
Child in need process 5 Section 47 enquiry
Child in need process 6 Planning and review (CiN open case)
Child in need process 7 Public Law Outline
Looked after child process 1 Decide child needs to be placed and find first placement
Looked after child process 2 Care plan
Looked after child process 3 Maintain the placement
Looked after child process 4 Ceased to be looked after
Looked after child process 5 Find subsequent placement
Looked after child process 6 Review
Looked after child process 7 Legal processes (section 31 care order)
Looked after child process 8 Transition to leaving care services (including the
pathway plan)
Time use data
Unit costs are calculated based either on a top-down or bottom-up approach. Research
evidence suggests that the inclusion of a bottom-up approach to unit cost calculation
enables an examination of the complexities of children’s social care, accounting for
13variations in the needs and circumstances of children and young people (Beecham,
2000; Ward, Holmes and Soper, 2008; Holmes and McDermid, 2012). A bottom-up
approach should include a time use study to explore the children’s social care time that is
required to adequately support children. This approach facilitates an exploration of the
variations in the activity (and subsequently costs) of providing child welfare services,
considering the needs and circumstances of children and the type of service (or
placement) that is provided. The variations that have the most substantial impact on
costs have been identified as the needs and circumstances of the children and young
people, the type of service provided and local area policy and procedures (Beecham,
2006; Ward, Holmes and Soper, 2008). These variations, along with others identified in
the cost pressures survey are detailed in this report.
The bottom-up unit costing methodology included a series of time use studies. These
time use studies have been used to identify the amount of time spent on each of the
activities to support children in need that form the processes detailed in Table 1. A
distinction has also been made between direct, indirect and administrative activities. This
distinction has helped to better understand the proportion of time spent on different types
of activity, and to examine changes in activity following the introduction of specific
working practices, for example, an increase in direct working to support children and
families when the plan is reunification (Holmes, 2014). The time use data collection
methods used to date include a range of retrospective (focus groups and surveys) and
prospective (diaries and event records) methods. The different methods and integration
of the data from the methods are detailed elsewhere (see Holmes and McDermid, 2012).
The analysis of time use figures also include a process of validation to cross reference
time use estimates with caseloads. This validation and verification process ensures that
the time use estimates provided for the different processes can be undertaken by social
care practitioners in an average working week. The most recent study, carried out as part
of a Research in Practice change project included consultation with 19 local authorities
(Bowyer et al, 2018). This study facilitated an opportunity to check that the earlier time
use studies are still applicable for current practice. It was evident from this process that
while there have been numerous policy and practice changes, most of these can be
accounted for in the variations that are already included in the existing nationally
applicable time use estimates, and associated unit costs.
Bottom-up unit cost estimations
Once the activity times had been identified for the social care processes, it was possible
to calculate a unit cost for each process (as detailed in Table 1). The social care activity
was linked to salary and overheads. Either national salary figures are used (see Curtis
and Burns, 2018) or can be customised at a local authority level with the use of local
salary figures.
14As detailed earlier in this report, a top-down approach (expenditure divided by the
number of children placed) cannot account for variations in spend across children’s social
care services, as such assessments of quality and value are problematic. However, a
top-down approach, as per the preparation of budgetary data by local authorities for the
submission of the section 251 expenditure return does provide an overview of the total
expenditure for different parts of children’s social care services, and does go some way
to understanding some of the broader issues related to local authority spend and trends.
As recently highlighted by Stanford and Lennon (2019) the categorisations of spend in
the section 251 do not provide any indication of spend according to child need.
The use of bottom-up unit cost estimations requires the inclusion of organisational
overheads. This is usually expressed as a percentage of direct salary costs, to ensure
that a comprehensive cost of service delivery is included. Overheads costs are those that
are associated with the overall functioning of a business of organisation working within its
usual range. Examples include, premises, management, Information Technology (IT),
Human Resources (HR) and office running costs. Research focused on adoption (Selwyn
et al, 2009) highlighted variability in the way in which local authorities attribute overheads
and apportion costs of different central services, this makes comparisons between local
authorities problematic.
The issues related to the way in which overheads have been apportioned by local
authorities have also been examined and reviewed as part of the DfE’s annual
consultation on the section 251 guidance 4. In November 2018 the consultation focused
on how best to categorise and record overheads and income, including grants, in the
children’s services lines within the return. Responses to the consultation were mixed:
some indicated that separation of overhead categories would aid comparability and
others suggested it would increase reporting burdens and would not address the
underlying issues of comparability. Furthermore, respondents indicated that overheads
would still be attributed to services differently dependent on local accounting practice and
service structures. A further complexity raised by some was that the section 251 return is
broader than children’s services and needs to offer some consistency of approach to
align with submissions for school and education services. Following the adoption
research detailed above, Selwyn and colleagues developed a standardised framework
for the calculation of overheads, which has subsequently been piloted (Holmes,
McDermid and Sempik, 2010) and utilised in subsequent research projects (Holmes and
McDermid, 2012).
4
https://www.gov.uk/guidance/section-251-2018-to-2019
15Findings
This section of the report sets out the findings from the cost pressures survey and
situates these within the wider evidence base, in particular existing studies and existing
bottom-up unit costs of children’s social care. A summary case study from one of the
local authorities that submitted a cost pressures survey is included. This findings section
also includes preliminary analysis to bring together the existing unit costs for the
processes detailed in Table 1 with the national administrative data from all 151 local
authorities about their children in need (including looked after) populations.
Overarching issues and cost pressures
The responses to the cost pressures survey highlighted the complexity of the children’s
social care system, in particular the importance of the context in which they operate (see
below) as well as the need to understand the nuance within the system to fully
understand the factors that impact on demand and pressures. These included the impact
of reduced budgets (National Audit Office, 2018) and increased numbers of child
protection plans and looked after children. These findings corroborate the findings from
recent research and reviews (for example, Care Crisis Review, 2018; La Valle et al,
2019).
As detailed earlier in this report, nationally there has been a rising demand for children’s
social care with an increase in the number of child protection plans and looked after
children. This was also reported by local authorities completing the cost pressures
surveys. Furthermore, the local authorities who submitted surveys highlighted increases
in the complexity of the needs of children, young people and their families. Specific
contemporary issues were cited, such as child sexual exploitation, child criminal
exploitation and county lines gangs. These emerging trends have also been identified in
the recent safeguarding pressures survey (ADCS, 2018). Associated with these issues
many of the local authorities had experienced an increase in the number of looked after
children in their adolescent years. This finding corroborates the latest published national
data which indicates that there are a greater number of older children looked after, with
nearly 4 in 10 of looked after children aged between 10 and 15 years old at the 31st
March 2018 (Department for Education, 2018b). The current national data collections
(SSDA 903 and children in need census) are only just starting to pick up these emerging
trends of the needs and circumstances of the growing adolescent population of looked
after children, and those on the edge of care. Within the children in need census local
authorities are now required to record a new data item: factors identified at the end of
assessment (Department for Education, 2018c). Service responses to address these
issues are still relatively new, and while some relatively new models, such as No Wrong
Door, developed by North Yorkshire Council (Lushey, Hyde-Dryden, Holmes and
16Blackmore, 2017), were cited, the evidence base for these is still in its infancy, with many
of the models having only been evaluated in a small number of local authorities.
There was variation in the survey responses in terms of the type of support being offered
to care leavers, for example the level of personal advisor support and whether these
services had been externally commissioned. An increase in the care leaver population
making the transition to higher education is a positive outcome, but places additional
financial burden on children’s social care budgets. The respondents also highlighted the
implications of changes in policy on budgets, for example the introduction of Staying Put
(DfE, DWP and HMRC, 2013). Some local authorities reported that they were
experiencing further pressures by providing the care leaver entitlement to
unaccompanied asylum-seeking children which is not fully funded by the Home Office.
Some local authorities also highlighted the need for them to consider the longer-term
impact on budgets of their increased adolescent looked after population, who were likely
to need continued support from children’s social care beyond the age of 18.
Factors outside the control of children’s social care
Recent research has highlighted the need for the right conditions and the right culture
(such as effective leadership and a commitment to social work values and ethics) in
children’s social care to achieve positive outcomes for children and families (La Valle et
al, 2019). This recent research also indicated the pivotal role of corporate support to
enable children’s social care to work effectively, primarily through the allocation of an
adequate budget and by prioritising the needs of vulnerable children and their families
across public sector departments (ibid). The findings from this research also reflect a
growing evidence base on the organisational, practice and workforce features that
contribute to creating the right culture and conditions (Beninger & Clay, 2017; Bryant et
al, 2016; Canwell, Hannan, Longfils, & Edwards, 2011; Forrester et al, 2013; Kantar
Public, 2017; Munro & Hubbard, 2011; Ofsted, 2015; Sebba et al, 2017). These findings
also resonate with the Department for Education’s strategy for children’s social care:
Putting Children First (Department for Education, 2016). The strategy aims to achieve
transformation through three fundamental building blocks: people and leadership;
practice and systems; governance and accountability. Under the strategy there have
been a number of new initiatives across all aspects of children’s social care and an
emphasis on innovation as part of the Children’s Social Care Innovation programme. As
detailed in the earlier sections of this report broader socio-economic and socio-cultural
issues, including poverty have been increasingly cited as impacting on the demand for
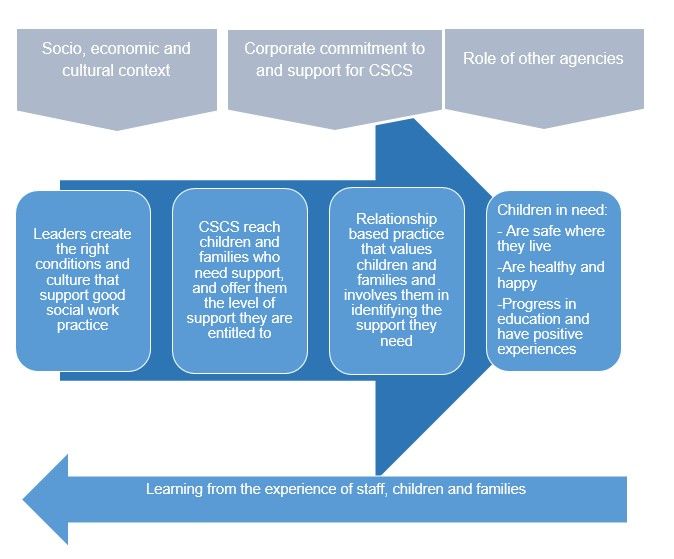
children’s social care. La Valle et al (2019) have brought these different and multi-faceted
factors together into a conceptual framework to help to understand the context in which
children’s social care operate (see Figure 1).
17Figure 1: Context and conceptual framework for children’s social care
Source: La Valle, Hart, Holmes and Pinto (2019)
Rising unit costs
Within the wider context of increased demand and reduced budgets, rising unit costs, as
highlighted in the published section 251 expenditure data, particularly for looked after
children, is a substantive issue for children’s social care. The latest published section 251
data only extends up until March 2018, so also miss any subsequent increases over the
past eighteen months. This was a factor that was highlighted in some of the surveys
where particular concerns were raised about subsequent rises in unit costs and the
longer-term implications of these. A range of inter-related factors have been identified as
causal factors for higher, and rising unit costs. Some of the local authorities who
submitted responses to the cost pressures survey also reported concerns about the
18longer-term implications of rising unit costs, where a year-on-year rise had been reported
for several years. Concerns were also raised about the complexities of managing this in
future years. Furthermore, the local authorities referred to factors that were outside of
their control (as detailed above) and the implications that these have on budget forecasts
and making predictions of future spend. Data and issues related to budget forecasts are
included later in this report. As detailed earlier in this report, the section 251 expenditure
data only provides overarching information about total spend in different areas, but does
not provide an insight on the reasons for variations in costs. Drawing on existing bottom-
up unit costs that have been calculated as part of the research projects listed on page 11
and responses to the cost pressures survey, the following sections examine identified
variations in unit costs. A range of the existing bottom-up unit costs are included for
illustration in Appendix 2 and are also included in the Greater Manchester Combined
Authority Unit Cost Database 5.
Variations
In the following sections the reasons for variations in unit costs are examined and
categorised in an attempt to try to explain some of the variability between local
authorities. The variations that have been identified are broadly categorised according to:
spend; overheads and time use. Additional variations within these broad, overarching
categories have also been highlighted in research by Beecham (2006). A recent analysis
on behalf of the Local Government Association also highlighted that variation in spend
between local authorities is inevitable (Newton Europe, 2018). Recent reports by the
National Audit Office have scrutinised variability in unit costs of children’s social care and
also scrutinised the inability to explain these variations (National Audit Office, 2018).
Variations in spend
As evidenced in the cost pressures survey, across the 13 local authorities there was
substantial variation in spend across different parts of their service. Despite the variations
there were common themes that were reported by the local authorities, including the
most frequently cited – wider market pressures and increased demand for placements.
These themes once again highlighted the nuances and complexity of children’s social
care with a range of inter-related factors being cited. The local authorities also reported a
range of different, supplementary funding sources for specific interventions or innovations
(for example, funding from the Department for Education Children’s Social Care
5
The Greater Manchester Combined Authority unit cost database was updated in April 2019 and is
available here: https://www.greatermanchester-ca.gov.uk/what-we-do/research/research-cost-benefit-
analysis/
19Innovation Programme). It was also evident from the cost pressures surveys that the
categorisation and allocation of these funds to different section 251 cost headings lacked
consistency.
Salaries
Variations in the salaries being paid to the children’s social care workforce was an
obvious factor, but these variations are multi-faceted, and include factors beyond London
weighting and those associated with the recruitment and retention of staff. Data about
social work pay is not well collected at a national level. A recent freedom of information
request by Community Care 6 across 107 local authority areas highlighted a pay gap
between local authority and agency social work staff, and further indicated that the gap is
narrowing as a result of the introduction of the new IR35 legislation 7. A subsequent
Community Care survey to explore the impact of the IR35 changes indicated increased
pressures, particularly for rural councils 8. The data submitted as part of the cost
pressures survey indicates that the rates paid to agency staff are not directly comparable
between local authorities. Similarly, the salaries paid to staff in some local authorities are
raised in an attempt to prevent staff moving to neighbouring local authorities that paid
higher salaries. Furthermore, salaries are not correlated fully with the overall cost of living
differences across local authorities.
Another related factor is the total spent on salaries in relation to increased demand and
inevitably higher caseloads. Andrews and colleagues (2018) suggest that children’s
social care departments have become more efficient because they have controlled the
size of their wage bill. However, they also go on to highlight the complexities associated
with this in terms of pay freezes and the use of newly qualified rather than more
experienced social workers. This analysis also does not account for, or consider any
measures of quality or impact of social work practice or how the quality of social work
practice is impacted by increases in workload. These complexities were also evident in
the responses to the cost pressures survey. Furthermore, as detailed below, in terms of
personal advisors and support for care leavers, some local authorities have increased
caseloads to meet demand. Although there is a lack of routine or comparable data about
quality of practice, research to explore the cost and capacity implications of Lord
Laming’s (2009) recommendations highlighted the need to acknowledge the impact of
6
The Community Care article is available here: https://www.communitycare.co.uk/2018/02/28/revealed-
social-worker-pay-differences-agency-permanent-adults-childrens-staff/
7
Further information about IR35 is available here: https://www.gov.uk/guidance/understanding-off-payroll-
working-ir35
8
The subsequent Community Care article is available here:
https://www.communitycare.co.uk/2018/08/22/agency-social-workers-tax-ir35-umbrella-companies/
20increased workloads on quality of practice, and time available for direct work with
children and their families (Holmes, Munro and Soper, 2010).
Placement fees
One of the most frequently cited concerns in the cost pressures survey was the
payments made to the independent sector for placements (both foster care and
residential). In 2017-18 local authorities spent around £0.9 billion on privately run
residential care and around £0.7 billion on independent fostering agencies (House of
Commons, 2019). Arguably this is also one of the most contested issues in children’s
social care and requires further exploration (Narey and Owers, 2018). Commissioning
processes, in particular in-house first policies for foster care placements have been the
subject of scrutiny in recent years and were the focus of a recent legal challenge 9. These
debates have become increasingly divisive with a focus on increased profits by some of
the larger independent providers, particularly in times of austerity (House of Commons,
2019). In response to both of these aforementioned reviews, the DfE have committed to
a series of activities to address these issues (Department for Education, 2019). These
include the provision of seed funding for fostering partnerships to introduce new or
expand collaborative approaches across commissioning, sufficiency planning and
integrated models of care. To date 7 projects have received funding for feasibility studies
to assess the viability of these approaches.
Within the cost pressures survey most of the local authorities referred to the need for
them to develop their own in-house placement services, particularly in response to
meeting the complex needs of their population of looked after children. For many of the
local authorities this included a current, or planned investment in local authority children’s
homes, both to reduce their reliance on externally commissioned placements and
placements outside of the local authority area. Both of these issues are explored in this
report in terms of the national data and trends over recent years.
In the cost pressures survey, the local authorities also reported their per week cost profile
for their children in placements at the 31st March 2018 (based on the fees and
allowances paid for placements). The local authorities provided both the proportion and
number of placements at cost bands of £1,000. For all local authorities the highest
proportion of placements were under £1,000 per week. The proportion of these
placements (under £1,000 per week) ranged from 78% to 93%. Some of the local
authorities indicated that this proportion was particularly high because of the number of
children placed at home with their parents with a care order (placements with lower unit
costs because they do not include the fee or allowance element). The highest reported
9
National Association of Fostering Providers versus Bristol City Council and others (2015) EWHC 3615.
21placement cost band was £7,000 to £7,999. These were reported in 2 of the 13 local
authorities for 2 and 3 placements in each.
A small proportion of children in care with the most complex needs have been found to
skew the budget for looked after children, particularly in smaller local authorities where
the proportion of the budget for a small cohort of children is disproportionate to the total
budget (for example, 5-10% of the total budget being spent on the placements for 2-3%
of the children and young people) (Ward, Holmes and Soper, 2008; Stanford and
Lennon, 2019).
In the cost pressures survey local authorities were asked to provide the proportion of
their looked after children budget spent on the 10 most expensive placements. Data was
provided for the past five years (2013-14 to 2017-18 by 10 local authorities). The
percentages are shown in Table 2.
Table 2: Percentage of looked after children budget spent on the 10 most
expensive placements
Local Percentage of total looked after budget (year)
authority 2013-14 2014-15 2015-16 2016-17 2017-18
A 6 8 7 7 6
B Not known 5 4 4 4
C 9 8 13 8 16
D 6 7 9 9 11
E 15 13 12 15 13
F Not known Not known Not known Not known Not known
G 2 2 3 3 4
H Not known Not known 8 9 10
I 8 9 7 8 9
J 21 17 17 18 24
K 10 8 10 11 10
L 6 7 7 5 6
M 4 5 5 5 6
As shown in Table 2 the pattern of expenditure on the 10 most expensive placements
varied across the local authorities both in terms of the percentage and the trend over the
22past five years. For some local authorities the percentage remained relatively static over
the reported timeframe, the highest figure in the most recent year accounted for almost a
quarter of the budget for all looked after children (local authority J).
Variations in overheads
The complexities associated with the calculation and apportionment of overheads have
already been outlined in this report. Within the cost pressures survey local authorities
were asked to provide a breakdown of the percentage overheads they attribute to
different parts of their service. The range of these overheads for looked after children,
safeguarding, family support services, along with the total reported overheads for all
children and young people’s services and youth justice is shown in Table 3.
Table 3: Overhead as a percentage of gross spend on service area (range)
Overhead as % of gross spend on
service area
Category Description
Lowest reported % Highest reported %
Children Looked After (s251 3.1.11) < 0.1 16
Safeguarding Children and Young People < 0.1 31
Services (s251 3.3.4)
Family Support Services (s251 3.4.6) < 0.1 29
Total children's and young people's 0.8 21
services and youth justice spend
The data in Table 3 illustrates the range in overheads applied to different parts of the
service, with the highest reported range for safeguarding services: with the lowest
reported overhead being less than 1% and the highest being 31% The responses also
highlighted that there is inconsistency in the overhead applied to different parts of the
service. For example, a local authority with the lowest level of overheads applied to their
child protection services, did not necessarily apply low overhead rates to looked after
children or family support. There was an exception for one local authority that reported
consistently low overheads across all areas with figures of less than 1% provided for all
services areas, and the total. It is not clear from the data, or from existing research
whether differences in the allocation of overheads are as a result of real differences or as
a consequence of reporting differences.
23Variations in time use
The time use studies listed earlier in this report identified variations in the time spent for
the different processes detailed in Table 1. The methodology starts with the identification
of the activities carried out for a standard case (for example, those that are the most
common place, such as local authority foster care for looked after children) and then
variations in activity are identified as part of the different time use methods (such as
focus groups and surveys). The overarching categorisation of variations in time use are
as follows:
• children’s needs and circumstances
• service being provided
• local area policies and practice
Examples of some of the detailed variations in time use for the 7 children in need and 8
looked after children processes are summarised in Appendix A. Of particular relevance to
the analysis in this report is the increase in the number of adolescents being placed in
care, and those deemed to be on the edge of care. There is a growing evidence base of
the complexity of the needs of this population (Bowyer et al, 2018) and as detailed
above, this is cited as placing an increased pressure on children’s social care budgets.
While the focus of this report is on children’s social care, taken holistically, meeting the
needs of this cohort has cost implications across a range of public sector agencies.
Unit costs calculations
To consider the cost pressures that local authorities reported and the implications for
children’s social care budgets, the existing bottom-up unit costs for the different
processes detailed in Table 1 have been multiplied by some of the indicators from the
national data for children in need and looked after children (SSDA 903 and children in
need census). The unit costs are detailed in Appendix 2 and further information about the
underlying calculations is detailed in Holmes and McDermid (2012) and Bowyer et al
(2018). National data from all 151 local authorities was used for the past few years, up to
and including the most recent year of publicly available data (1st April 2017 to 31st March
2018).
Children in need
An examination of the numbers of referrals between 2012 and 2018 indicates that there
has been a steady increase nationally in referrals to children’s social care from 593,470
in 2012-13 to 655,630 in 2017-18. As detailed above the research evidence indicates that
higher levels of activity (and therefore costs) are attributable to a referral that results in no
further action. As the numbers of referrals has increased, the number of referrals
24resulting in no further action has decreased (from 85,830 to 61,690). The number of
subsequent referrals within 12 months of the previous referral has remained fairly static
(from 147,770 to 143,810). Although the total number of re-referrals has remained fairly
static, where this number is consistently high (in comparison with other local authorities)
or is increasing this has obvious implications for the local authority in terms of the
expenditure on children in need. Furthermore, the trajectories once again highlight the
variability between local authorities in terms of increases, decreases or relatively static
numbers and proportions over the past 6 years.
Over the past 6 years there has also been a substantive increase in the number of
section 47 enquiries, from 127,190 to 198,090. Utilising the lowest unit cost associated
with a section 47 enquiry (not including strategy meetings or achieving best evidence
interviews, because the national data does not provide this level of detail) the cost
implication of this rise nationally is from £89,541,760 to £139,455,360 (nominally/un-
adjusted). Alongside this increase, as referred to earlier in this report there has also been
a year on year increase since 2012 in the number of child protection plans being carried
out each year, rising from 52,680 to 68,770. As detailed in Holmes and McDermid (2012)
the unit costs associated with supporting children with child protection plans are higher
than for other children in need, not only in terms of the assessment, but also to provide
ongoing support and to review the case. The nominal increase in the cost associated with
higher numbers of child protection plans is from £49,308,480 to £64,368,720.
Data was made available for the 4 years from 2014 to 2018 10 about the number of
assessments being carried out by children’s social care following a referral. The time
taken to complete these assessments is higher for children who have previously been
referred to children’s social care. Nationally there has been a substantial increase in the
number of assessments rising from 550,810 (2014-15) to 631,090 (2017-18). Utilising the
unit cost of the social work activity associated with conducting single assessments (see
Appendix B) the cost is estimated to have increased by £55,634,070 in 2017-18
(£437,345,370 - £381,711,330) (nominally/un-adjusted) compared to the estimated cost
of conducting assessments in 2014-15 due to the increase in assessment activity in
2017-18.
It should be noted that this is just one process associated with children’s social care and
would need to be taken cumulatively with increases in other elements of social work
activity seen in 2017-18 compared to previous year. For example, the total cost of section
47 activity has increased by £49,913480 in 2017-18 compared to the cost in 2012-13.
10
There was a change in the assessment process in response to the recommendations from the Munro
review (2011) and subsequent pilot of the new single assessment (Munro and Lushey, 2012). The data for
2014-15 is the first year of the reported number of single assessments. Years prior to this reported
numbers of initial and core assessments.
25This is due to the increase in section 47s in 2017-18 compared to 2012-13 and this is
likely to be a conservative estimate given the lowest unit cost associated with section 47
has been utilised and it does not include the costs attributed to agencies other than
children’s social care, for example, the police.
Looked after children
Examination of national data about the number of looked after children for the past 7
years (up to and including 2017-18) highlights not only an increase in the total number of
looked after children, but also an increase in the average duration of care episodes. As
highlighted in Ward, Holmes and Soper (2008), the unit costs of placing children out of
the area of the local authority are higher (as a consequence of higher levels of social
worker activity to visit the child in placement). Out of authority placements have also
been associated with negative outcomes and higher likelihood of risks associated with
exploitation (Ward, Holmes and Soper, 2008; Rees, Luke, Sebba and McNeish, 2017).
Over the 7 years up to 2017-18 there has been an increase in both the number of foster
care placements out of authority from 18,040 to 21,040 and residential placements from
4,270 to 6,370 31st March 2018.
Alongside the increase in out of authority placements there has also been a year-on-year
increase in the number of foster care placements provided by the independent sector.
The number has increased from 14,810 on the 31st March 2012 to 18,450 on 31st March
2018. This increase in placements provided by the independent sector is also evident for
residential care 11, with a rise from 5,180 to 7,970 over the same time period. These
increases in the use of externally commissioned placements corroborate the messages
from the cost pressures survey, and existing literature referred to in this report relating to
concerns about placement finding being market driven, whereby demand is greater than
supply, and consequently the price charged by private providers has increased.
These different factors of an increase in the number of looked after children; out of
authority placements and the use of external providers, along with the data about the age
at which children are being placed in care (largest growth in the 10-15 age group) as well
as an increase in the length of placements all highlight the pressure on spend of looked
after children. However, nationally there is not sufficient data about the needs of the
children and young people, or the outcomes that are being achieved (Stanford and
Lennon, 2019). As such, any debates about the use of different placements types or
providers, that are based on the national datasets do not provide an indication of the
quality or value of the placement, or whether it is the best possible placement to meet the
needs of the child. Research by Ward and colleagues (2008) to explore the needs and
11
Residential care includes secure units, children’s homes, hostels, residential schools, and other
residential settings.
26outcomes of looked after children highlighted that young people coming into care during
their adolescent years, with complex needs tended to have the costliest care pathways
and the worst outcomes. The adolescent entrant cohort were also most likely to
experience higher numbers of placement changes, which are detrimental to their
outcomes, and also have cost implications, with the unit costs associated with each
subsequent placement change becoming incrementally more expensive (ibid).
Issues and solutions
In addition to the various issues and pressures outlined above, as part of the cost
pressures survey, local authorities were asked to provide information about any current
or future solutions they had, or were planning to implement.
Placement commissioning and expansion of in-house placements
As detailed above the level of fees being paid for externally commissioned placements
and increases in these fees were identified as major issues for the majority of the local
authorities and have been highlighted in a range of other recent reports (ADCS, 2018;
House of Commons, 2019; LGA, 2017; Narey and Owers, 2018).
Many of the local authorities highlighted the need for placements to be commissioned
more effectively and efficiently. In addition to the development of consortia, detailed in
the following section, many local authorities also highlighted the need for them to create
positive working relationships with a small number of external providers, to help them to
create commissioning based on mutual trust and a move away from combative and
competitive ways of working.
Local authorities also placed an emphasis on the need for them to expand their in-house
placements to meet the evolving needs of their population of looked after children. This
included the development of a skilled pool of foster carers (either the recruitment of
skilled foster carers or the creation of specialised training for existing foster carers) who
can adequately meet the needs of the children and young people.
A number of local authorities also reported that they had, or were planning to open in-
house residential units, a number of these as specialised provision both to support
children in care and those on the edge of care. Examples were provided of the use of
residential children’s homes offering outreach support for adolescents and their families
on the edge of care.
Within all of these responses the emphasis was placed on the fees and allowances being
paid and the need for more effective commissioning strategies. An element that was
missing and needs to be taken forward relates to the aforementioned need to assess
quality of placements, or to link existing quality assessments as part of Ofsted
27inspections with the fees being paid and the outcomes being achieved. Without an
analysis of needs and circumstances, and whether placements meet needs and achieve
the best possible outcomes it is not possible to make assessments of value.
Regional consortia
The establishment of regional and, or sub-regional consortia was frequently cited as a
solution to address market pressures and to facilitate more effective commissioning and
procurement practices. Regional consortia were also cited as leading to efficiencies in
terms of quality assurance of placements and on-going placement monitoring. Local
authorities also reported positive developments in terms of the development and use of
online (secure) portals as a repository for information about available placements. Some
local authorities also highlighted that regional or sub-regional consortia had led to the
creation of forums to share good practice and solutions for helping to address the needs
of children and young people, particularly those requiring specialist placements.
Despite these positive developments, and future plans, concerns were also raised about
the increased demand for placements in certain areas leading to artificially high
placement fees for externally commissioned placements. Some local authorities indicated
that in some circumstances where large independent providers were aware that demand
was greater than the supply of placements, fees were artificially increased. Similarly,
local authorities also reported that agreed fees, particularly for residential care, as part of
framework agreements, or consortia arrangements were indicative, and that once the
needs of the young people were set out the fees would often increase, with specialist
staffing or higher staffing ratios being cited as the reasons for higher fees.
By way of contrast one of the local authorities reported that they intended to move away
from regional commissioning because they perceived that direct working with a small
number of providers rather than via a consortia arrangement would facilitate the
development of trusted, close working relationships, as per those cited above as having a
positive impact on effective commissioning.
Pressures and forecasts
The findings from the cost pressures survey responses corroborate those highlighted in
existing literature in terms of the ongoing concerns associated with increased demand for
services (children in need, child protection and placements for looked after children) in
conjunction with decreased budgets. Furthermore, local authorities identified that they
expect demand to continue to increase particularly in relation to numbers of looked after
children, including unaccompanied asylum-seeking children. There is also an anticipation
that the number of care leavers requiring support is likely to continue to grow. Within a
wider context of limited housing and difficulties associated with recent policies, such as,
28You can also read