China's Economic Liberalisation and the Impossible Trinity
←
→
Page content transcription
If your browser does not render page correctly, please read the page content below
Bachelor’s Thesis

China’s Economic Liberalisation and
       the Impossible Trinity

      Zurich University of Applied Sciences
        School of Management and Law
        BSc in International Management

                   Max A. Dörrer
         Matriculation Number: 17-680-653
                       Zürich

           Submitted to Dr. Markus Braun
             Winterthur, 27 May 2020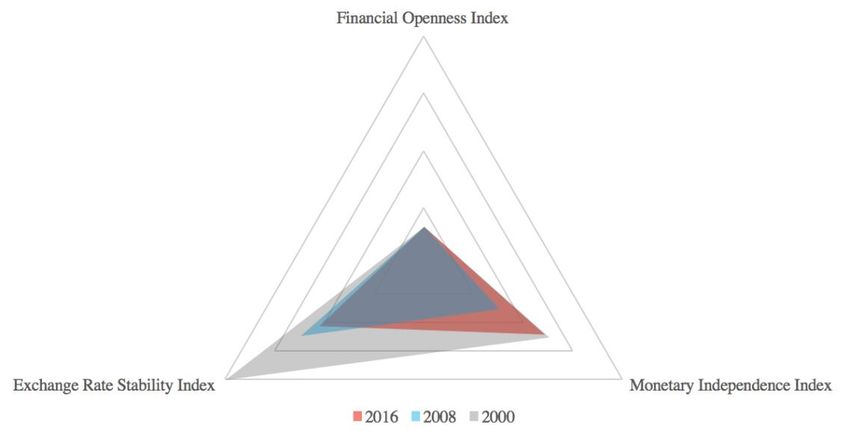
Management Summary
China’s global economic and political ascent, as well as its unique mix of state control
and free market principles, has been unprecedented and attracted foreign interest as well
as criticism to its economic system. Although China pledged towards increasing
economic openness, its progress is ambiguous and difficult to assess. Due to China’s
economic power, it is necessary to understand and evaluate its macroeconomic policy-
making in order to analyse its strengths and weaknesses, as well as to predict future
developments.
The main objective of this thesis was to research China’s policy stance and its relationship
in line with the Impossible Trinity, and to outline the respective reforms in regard to the
country’s capital accounts, exchange rate regime and monetary sovereignty. Moreover,
this thesis aimed to evaluate if the model of the Impossible Trinity can be applied to China
and lastly, to evaluate potential areas of future reforms.
A literature review and expert interviews were conducted to answer the aforementioned
objectives. The literature review elucidated the liberalisation reforms and the Impossible
Trinity, and its particular applicability to China. The expert interviews supported a
holistic interpretation of the results and provided insights into potential future
liberalisation steps.
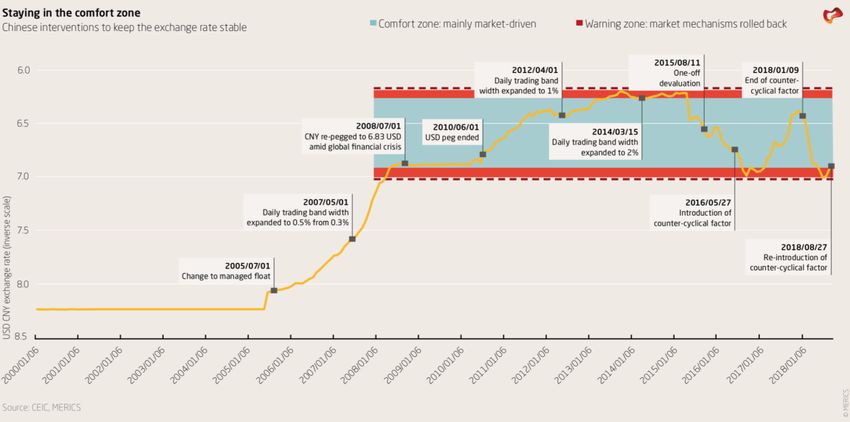
In particular, China measurably decreased its exchange rate control through wider trading
bandwidths and market-based pricing mechanisms. Secondly, the country reformed its
capital accounts through special investment channels and by connecting its stock
exchanges together. However, the country’s assumed progress towards capital account
openness has not been quantifiably reflected. China’s level of capital account openness
remained at constant levels since the year of 2000. Lastly, China’s monetary
independence had dropped in 2008 and resurged by 2016, which may be attributed to the
global financial crisis and the emergence of the shadow-banking sector. Taken together,
China has applied a middle-ground configuration of the Impossible Trinity with relative
monetary sovereignty, a relatively controlled exchanged rate and minimally open capital
accounts. Accordingly, the model of the Impossible Trinity is assumed to be applicable
I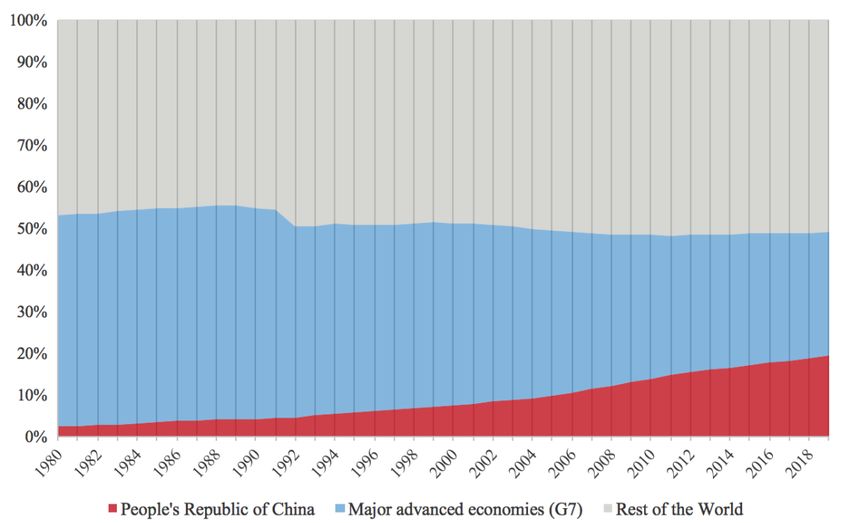
to China despite the country’s rejection of this. Lastly, future reforms are difficult to
assess and must be considered within a political and economic context. However, an
increase in China’s monetary independence, balanced through a more freely floating
exchange rate, whilst maintaining its capital account openness, appears to be likely.

This study contributed to the existing literature on China’s economic liberalisation
reforms and its macroeconomic policy stance in line with the Impossible Trinity.
Moreover, this thesis has established grounds for future research on China’s application
and interpretation of the Impossible Trinity.

This thesis provided a basis to understand China’s macroeconomic framework. Further
research is needed to clearly distinguish China’s economic advantages and risks, and to
deduce potential implications for other economies.

                                                                                        II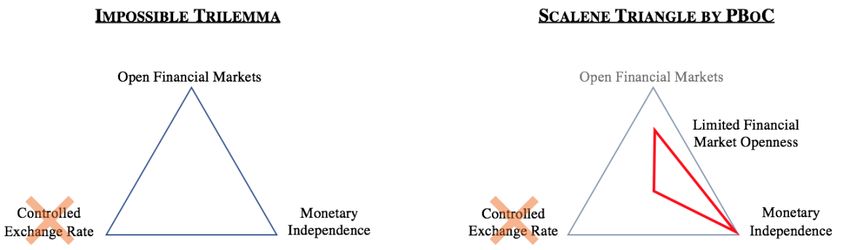
Implications of COVID-19

The current global pandemic caused by Covid-19 has resulted in draconian quarantine
and economic lock-down measures to halt the rise of the new infections. China, where
the disease first appeared in December, has been at the economic and political forefront
of this global crisis. The economic impact of the virus has caused China’s GDP to shrink
by 6.8 percent in the first quarter of 2020, resulting in the largest economic contraction
since 1976 (Zenglein & Kärnfelt, 2020).With that, China’s rate of credit growth has
surpassed its rate of economic growth and hence contributed to a further erosion of the
country’s financial stability (Zenglein & Kärnfelt, 2020). In particular, the country’s
economic problems, of which chapter 3 further elaborates on, in the form of its growing
debt rate, surging non-performing loans and its shadow-banking market are likely to
become more severe by Covid-19.

By the end of March 2020, over half a million Chinese companies have permanently
closed due to the effects of the current pandemic (Zenglein & Kärnfelt, 2020). In
particular, China’s small and medium sized enterprises are seen to be at elevated risk of
bankruptcy, as they have already struggled to access funding before the Covid-19
outbreak. As a macroeconomic response, China has increased market liquidity, lowered
lending costs and reduced fees and taxes. Overall, China has dedicated RMB 2.6 trillion
(or 2.5 percent of GDP) to combat the economic consequences of the virus by May, 2020
(IMF, 2020). Yet, global growth expectations are dim and the risk of further company
defaults is likely to result in a higher unemployment rate and could therefore threaten
social stability. Contrary to the previous financial crisis of 2008, China is likely to no
longer buoy the world economy and serve as the global engine of economic growth
(Zenglein & Kärnfelt, 2020).

Considering the rise of domestic economic- and social problems, the Communist Party of
China is expected to primarily focus on maintaining political and economic stability in
the country. Therefore, the country’s liberalisation reforms, which are outlined in chapter
7, towards a more market-based economy can be expected to be halted or terminated for
the foreseeable future until economic growth and social stability has been fully restored.

                                                                                        III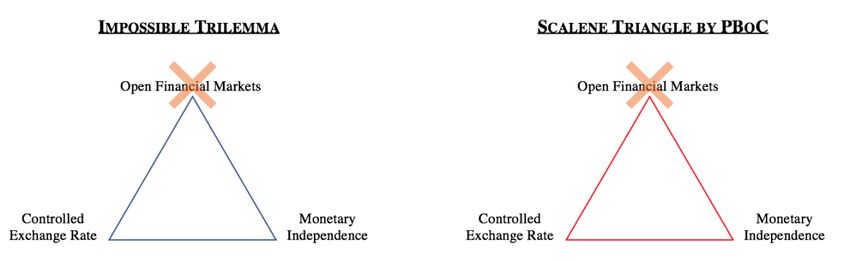
Table of Contents

I. Abbreviations                                                                                                              VI
II. List of Tables                                                                                                           VII
III.List of Figures                                                                                                          VII

1 Introduction                                                                                                                   1
1.1    Research Question ................................................................................................. 2
1.2    Relevancy ................................................................................................................ 3
1.3    Current Research ................................................................................................... 4
1.4    Methodology ........................................................................................................... 4

2 Historical Background                                                                                                          6
2.1 Economic Plan Model, 1930 – 1978 ...................................................................... 6
2.2 Reform and Opening Up, 1978 – 1997 ................................................................. 8
2.3 Transformational Period, 1997 – 2008 ............................................................... 11

3 Recent Economic Developments (2008 – 2016)                                                                                   14
3.1 China’s Credit Boom ........................................................................................... 15
3.2 Shadow-Banking in China .................................................................................. 17
3.2.1 Growth of China’s Shadow-Banking Industry .................................................... 17
3.2.2 Risk Factors ......................................................................................................... 18
3.2.3 Suppression of the Chinese Shadow-Banking Market ........................................ 19

4 The Impossible Trinity                                                                                                       21
4.1 Currency Exchange Rate .................................................................................... 22
4.1.1 Freely Floating Exchange Rate ........................................................................... 22
4.1.2 Fixed Exchange Rate........................................................................................... 22
4.2 Capital Mobility ................................................................................................... 23
4.2.1 Unrestricted Capital Mobility ............................................................................. 23
4.2.2 Restricted Capital Mobility ................................................................................. 24
4.3 Monetary Policy ................................................................................................... 24
4.3.1 Sovereign Monetary Policy ................................................................................. 24
4.3.2 Non-Independent Monetary Policy ..................................................................... 25
4.4 Limitations and Proof of the Impossible Trinity .............................................. 26

5 Application of the Impossible Trinity                                                                                        27
5.1    Loss of Monetary Independence ......................................................................... 27
5.2    Loss over Exchange Rate Control ...................................................................... 29
5.3    Loss of Financial Openness ................................................................................. 30
5.4    Mismanagement of the Impossible Trinity ........................................................ 31

6 China’s Interpretation of the Impossible Trinity                                                                             32

7 Application of the Impossible Trinity to China                                                                               35

                                                                                                                               IV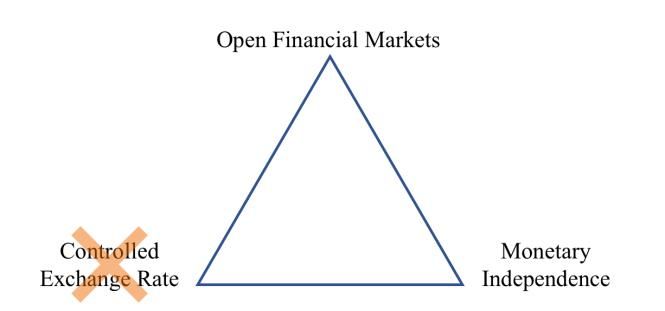
7.1 China’s Exchange Rate Regime.......................................................................... 35
7.2 China’s Capital Mobility ..................................................................................... 38
7.3 China’s Monetary Independence........................................................................ 40

8 Findings on China’s Impossible Trinity Configuration                                                                  41
8.1 China’s Middle Ground Configuration ............................................................. 42
8.2 Discussion on the Development of China’s Impossible Trinity ....................... 43
8.2.1 Exchange Rate Stability ...................................................................................... 44
8.2.2 Monetary Sovereignty ......................................................................................... 44
8.2.3 Capital Mobility .................................................................................................. 45

9 China’s Impossible Trinity Outlook                                                                                    47

10 Conclusion                                                                                                           50
10.1 Contribution ....................................................................................................... 52
10.2 Limitations and Further Research ................................................................... 52

11 Sources                                                                                                              54

12 Appendix                                                                                                             60
12.1 RMB / USD Exchange Rate............................................................................... 60
12.2 Interview transcript with Dr. Oliver Adler ..................................................... 61
12.3 Interview transcript with Dr. Beat Affolter..................................................... 67

                                                                                                                         V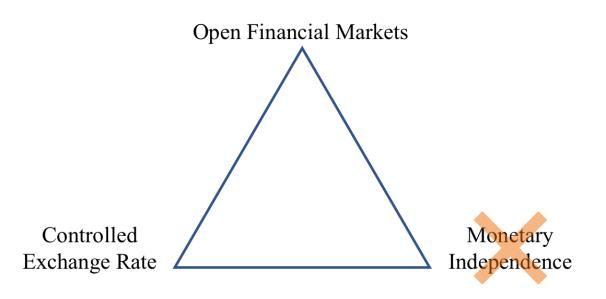
I.Abbreviations

ABC                 Agricultural Bank of China
AREAER              Annual Report on Exchange Arrangements and Exchange
                    Restrictions
BIS                 Bank of International Settlements
BOC                 Bank of China
CCB                 China Construction Bank
CCP                 Chinese Communist Party
ERS Index           Exchange Rate Stability Index
EU                  European Union
FDI                 Foreign Direct Investments
GDP                 Gross Domestic Product
GFC                 Global Financial Crisis
HKD                 Hong Kong Doller
ICBC                Industrial and Commercial Bank of China
MI Index            Monetary Independence Index
NPL                 Non-performing loans
P2P                 Peer-to-Peer
PBoC                People’s Bank of China
PWC                 Pricewatherhouse Coopers International
QDII                Qualified Domestic Institutional Investors
QFII                Qualified Foreign Institutional Investors
RMB                 Renminbi
SEZ                 Special Economic Zone
SGD                 Singapore Doller
SME                 Small to medium sized enterprises
SOE                 State Owned Enterprises
SSE                 Shanghai Stock Exchange
SZSE                Shenzhen Stock Exchange
UIP                 Uncovered Interest Rate Parity
US                  United States
WTO                 World Trade Organization

                                                                     VI
II.List of Tables

Table 1: Interview experts ................................................................................................ 5
Table 2: Percent structure of Chinese GDP, at constant prices, 1890 – 2003 (adapted
    from Maddison, 2007, p.60) ..................................................................................... 7
Table 3: Major changes in Chinas exchange rate system (Zenglein & Kärnfelt, 2019;
    Kawai & Liu, 2015, own illustration)..................................................................... 36

III.List of Figures

Figure 1: Chinese annual percent change in real GDP growth (IMF Data Mapper, 2020,
     own illustration) ...................................................................................................... 10
Figure 2: Percentage share of world GDP (measured at purchasing power parity) (IMF
     Data Mapper, 2019, own illustration) ..................................................................... 13
Figure 3: China’s core debt (percentage of total GDP) (BIS, 2020, own illustration) ... 15
Figure 4: Impossible Trinity (own illustration) .............................................................. 21
Figure 5: Loss of monetary independence (own illustration) ......................................... 27
Figure 6: Loss over exchange rate control (own illustration) ......................................... 29
Figure 7: Loss of capital account openness (own illustration) ....................................... 30
Figure 8: The Impossible Trinity versus the Scalene Triangle under financial autarky
     (own illustration) .................................................................................................... 33
Figure 9: The Impossible Trinity versus the Scalene Triangle under open financial
     markets (own illustration) ....................................................................................... 34
Figure 10: China’s Impossible Trinity configuration in 2016 (Aizenman et al., 2010,
     own illustration) ...................................................................................................... 41
Figure 11: Mean value of Kaopen Index 2016 (Chinn & Ito, 2008, own illustration) ... 42
Figure 12: China’s Impossible Trinity configuration for the years of 2000, 2008 and
     2016 (Aizenman et al., 2010, own illustration) ...................................................... 43
Figure 13: RMB/USD Exchange Rate (Zenglein & Kärnfelt, 2019) ............................. 60

                                                                                                                           VII
1 Introduction
This thesis focuses on the economic liberalisation of China and its management of the
Impossible Trinity model since the global financial crisis (GFC) of 2008. China’s rampant
economic growth from 1978 onwards has turned the country from a mismanaged and
poverty ridden nation into a global superpower. In 2010, China amplified its global
standpoint and overtook Japan to become the world’s second largest economy by
measurement of nominal gross domestic product (GDP) in USD (World Bank, 2019).
The country’s economic rise has been unprecedented and changed the political as well as
economic world order. This ascent has led to a global interest into China’s economic
model, which considerably differs to the more liberal economies of the United States,
Japan, Germany, and many other countries. Although China’s economic model has been
undoubtedly successful in the past, recent steps towards greater economic openness raise
questions of its long-term applicability.
Until the early 2000’s China has had closed capital accounts, a sovereign monetary policy
and a pegged exchange rate to the USD. Due to its closed economic system, the
macroeconomic policy dilemma imposed by the Impossible Trinity did not constrain
China’s policy-making. As such, China was able to control its foreign exchange rate and
keep a sovereign monetary policy at the same time (Lo, 2015)
The Impossible Trinity model is a key model in international macroeconomics that was
originally developed by the economists Robert Mundell (Mundell, 1963) and Marcus
Fleming (Fleming, 1962). This model helps to explain a commonly faced dilemma by
policy makers such as national banks and governments (Rieber, 2018). Also referred to
as the ‘Financial Trinity’ or the ‘Holy Trinity’, the model states that a country cannot
simultaneously sustain (I) an independent monetary policy, (II) freely flowing capital
flows, and (III) a controlled foreign exchange rate (Guorui Sun & Payette, 2016). As such,
policy makers can only sustain two of the three goals at any given time (Rieber, 2018).
Since the early 2000’s, China has announced to gradually ease restrictions on capital
flows and to move the Renminbi’s (RMB) hard-peg to a more flexible crawling-peg
arrangement. As per the theory of the Impossible Trinity, China should, with increasing
1progress towards greater capital account openness, be exposed to the policy constraint
imposed by the trilemma. However, China’s government has stated that the Impossible
Trinity is not applicable to the country and that it has been able to calculate the optimal
equilibrium of capital controls, exchange rate flexibility and monetary sovereignty.
Furthermore, China argues that a certain level of capital control is always required, even
if a country opts for a freely floating exchange rate and a dependent monetary policy, thus
contradicting the model of the Impossible Trinity (Sun & Li, 2017).
1.1 Research Question
Since the founding of the People’s Republic of China in 1949, and up until the political
power change in 1978, China followed an autarkic economic model which heavily
restricted imports, private ownership and foreign business activities (Morrison, 2019b).
Since 1978 however, China gradually liberalised its economy by phasing out of
collectivised agriculture, establishing special economic regions and granting more
ownership rights to individuals (Morrison, 2019b). China has reached a crucial milestone
in its economic development upon accession to the World Trade Organisation (WTO) in
2001 (Halverson, 2004). For many economists and politicians alike, this marked the
beginning of a new area since the WTO advocates for greater transparency, liberalised
capital accounts and freely floating exchange rates (Perkins, 2018). However, financial
liberalisation has been slower than anticipated and major reforms are yet to be
implemented. Moreover, the country’s high debt ratio, its growing number of non-
performing loans and pressure on the RMB have led to new economic issues. With
China’s place among the economic superpowers, the question begs as to if the Impossible
Trinity actually applies to the country’s economy. This coupled with its recent economic
liberalisation asks further how its relationship to this model will be affected in the future.
As such, the subject of this thesis is China’s Economic Liberalisation and the Impossible
Trinity.
The main objective of this thesis is to evaluate China’s economic liberalisation since the
GFC of 2008 and to configure and analyse China’s policy goal configuration in line with
the Impossible Trinity. Furthermore, this thesis looks at China’s interpretation of the
model and additionally aims to conclude whether, and in which areas, further
liberalisation steps could be expected in the future.
2The following further specified questions will be answered throughout this thesis:
1. What steps were taken by China in order to liberalise its economy?
2. Can the model of the Impossible Trinity be applied to China?
3. What is China’s current configuration in line with the Impossible Trinity?
4. Can further progress towards greater economic liberalisation be expected?
1.2 Relevancy
China has transformed itself into a key-driver of global growth, as such, China was the
world’s largest merchandise trader and manufacturer, the third-largest export market for
the United States (US) and, at the same time, the largest foreign holder of US debt in 2018
(Morrison, 2019b). Likewise, the European Union (EU) displays an equal dependence on
China, with China being the EU’s largest source of imports and the second-biggest export
market (China - Trade - European Commission, n.d.).
China has become an integral contributor of global economic growth and advanced as
well as developing countries are equally reliant on China’s economic expansion. On the
other hand, economic downturns in China create global spill-over effects and have major
implications on global economic growth. Such spill-over effects were seen during the
“China Scare” in 2015 and 2016, where concerns about sluggish Chinese economic
growth has led to global asset price corrections (Shaghil et al., 2019).
Considering China’s economic importance and the potential of spill-over effects on the
world economy, it has become paramount to understand China’s economic system and
its liberalisation reforms. Moreover, the prudent management of the Impossible Trinity
has proven to be vital from a macroeconomic perspective. As the disregard of the model
has led to severe economic distortions in the past as seen during the Asian financial crisis
in 1997 (Guorui Sun & Payette, 2016). Hence, understanding China’s current Impossible
Trinity configuration and its respective development is a crucial objective to understand
the country’s liberalisation process as well as its potential risks and benefits imposed to
the global economy. Lastly, only by knowing China’s current macroeconomic policy
configuration, one can potentially predict future liberalisation steps.
31.3 Current Research
Current academic research on China’s economic system is vast and many scholars
highlight the unprecedented liberalisation pace of China. Whereas most research looks at
a specific area to track reforms, a holistic approach to evaluate the country’s economic
liberalisation has not yet been widely applied. In congruence to this, only a limited
number of researchers have looked into China’s relationship with the Impossible Trinity
and have analysed its development over time. Moreover, China’s own research and its
different interpretation of the Impossible Trinity has so far not received any academic
attention. Additionally, many agree on the fact that further steps towards economic
liberalisation are needed, yet most papers focus only on the external environment and do
not take China’s internal economic distortions into account.
1.4 Methodology
This section provides an outline of the research methodology applied to answer the
aforementioned topics of research. This thesis primarily deduced its information and
results from an extensive literature and study review. Particular focus was put on peer-
reviewed journal articles, scientific books, working papers as well as reports from
international organisations. For this, research platforms including Business Source
Premier, Elsevier, Springer, ABI/Inform and Google Scholar were consulted.
Additionally, two expert interviews were conducted to receive further insights and
background information into the topic. A semi-structured interview form has been chosen
in which the pre-defined questions were sent out to the interview partners beforehand. As
outlined by Fylan (2005), this form allows the interviewees to prepare for the questions
asked and offers a structural guidance for the interviewer, whilst providing room for
additional follow-up and clarification questions. Furthermore, the interviews provided a
deeper understanding and a holistic interpretation of the Impossible Trinity and the
potential future liberalisation steps of China. Table 1 provides a summary of the
interviewees and their respective professional positions. Due to the rather complex nature
of this topic, interviewees were given a written introduction to the topic beforehand and
the interviews were recorded and transcribed as found in appendix 12.2 and 12.3.
4Table 1: Interview experts
Name Position Interview Type Length
Dr. Oliver Adler Chief Economist Phone Call 45min
Switzerland at Credit
Suisse (Schweiz) AG
Dr. Beat Affolter Senior Lecturer at ZHAW Video Call 40min
(SML)
The remaining sections of this thesis are organised as follows. Chapter 2 gives a brief
overview and introduction into China’s economic transformation since the founding of
the republic in 1949. This aims to support the reader in understanding the source of the
country’s economic model and its initial reforms which have led to China’s current
economic system. Chapter 3 outlines the recent economic developments in line with
China’s response to the GFC of 2008. Chapter 4 covers the model of the Impossible
Trinity in detail and evaluates the benefits and risks associated with each policy goal.
Chapter 5 introduces the different policy goal configurations based on several examples
and highlights the reason behind the forgoing of one goal. Chapter 6 evaluates China’s
interpretation of the Impossible Trinity and compares the key findings of its own research
with the Impossible Trinity. Chapter 7 applies the Impossible Trinity to China and
provides an overview over the country’s economic liberalisation reforms in each policy
goal. Chapter 8 presents the respective findings on China’s current policy configuration
and evaluates its changes over three time periods. Chapter 9 aims to shed light on potential
future liberalisation steps and highlights the associated benefits and risks. Lastly, chapter
10 summarises this thesis and reports on its limitations and further research opportunities.
52 Historical Background
The following chapter examines the history and background of China’s economic system,
starting from 1930 until the GFC in 2008. Moreover, this chapter outlines the reforms and
policies undertaken, as well as key historical events that have transformed China’s
economic system into a more open and globally integrated one.
2.1 Economic Plan Model, 1930 – 1978
In October 1949, after twelve years of devastating internal conflicts between the
Kuomintang and the Chinese Communist Party (CCP), the People’s Republic of China
was founded under communist rule (Brandt & Rawski, 2008). The CCP adopted a Soviet-
style command economy based on centrally planned five-year plans (Morrison, 2019).
The government controlled almost every single production factor and dictated prices,
resource allocation and production capacities as well as clamped down on free market
principles (Morrison, 2019). The newly ruling government, under the leadership of
Chairman Mao Zedong, faced a weak economy deprived of crucial resources. With a lack
of raw materials, machinery and access to finance, economic growth was stagnant
(Magnus, 2018). Within the first year of communist leadership, all formerly privately
held corporations and institutions were nationalised and brought under government
control (Franklin et al., 2006). Likewise, formerly small and mid-sized agricultural
businesses were organised into large communes, whereas industrial production was
shifted to state-owned enterprises (SOEs). By 1978, this country-wide nationalisation
resulted in three-fourths of the total industrial output being produced by SOEs (Morrison,
2019).
With the aim to become self-sufficient, the CCP strictly minimised international trading
activities and banned foreign firms from conducting business in the country.
Simultaneously, imports were restricted to only those products which the country was not
able to produce itself (Morrison, 2019). In order to accelerate the rapid industrialisation
of the economy, the central government undertook large-scale investments into physical
and human capital (Morrison, 2019). As a result, the industrial share of China’s GDP
increased from 8.3 percent in 1952, to more than one third of total GDP in 1978
(Maddison, 2006). To illustrate the fast-moving industrialisation of the country, table 2
provides a breakdown of the Chinese GDP per sector, reflecting the shift from an
6agriculturally to an industrially based economy, in which the previously largest and low-
value-adding sector of farming, fishery and forestry steadily declined; and only
contributed 34.4 percent to total GDP in 1978 (Maddison, 2006).
Table 2: Percent structure of Chinese GDP, at constant prices, 1890 – 2003 (adapted from
Maddison, 2007, p.60)
1890 1952 1978 2003
Farming, Fishery & Forestry 68.5 59.7 34.4 15.7
Industry 8.1 8.3 33.5 51.8
Construction 1.7 1.7 3.4 5.3
Transport & Communications 5.5 2.4 3.6 7.0
Commerce & Restaurants 8.2 6.7 5.1 8.2
Other Services 8.0 21.2 20.1 11.9
Under Mao’s rulership, the financial system of China was dominated by a single bank
(Franklin et al., 2006). The People’s Bank of China (PBoC) was the only officially
operating commercial bank and functioned simultaneously as the nation’s central bank.
The PBoC was controlled by the Ministry of Finance and was fully state-owned (Franklin
et al., 2006). With its main role being to finance production plans, the bank owned 93
percent of China’s total financial assets and was responsible for almost every individual
financial transaction in the country (Franklin et al., 2006).
The Chinese economic plan model, which lasted approximately from 1950 until 1978,
resulted in fairly mixed outcomes. As such, Magnus (2018) reported that Mao’s China
struggled in three key economic areas. Firstly, the country suffered from insufficient food
production related to the Malthusian problem, where population growth offshoots
agricultural outputs (Magnus, 2018). Secondly, the country faced the Keynesian issue by
not creating sufficient job opportunities to generate sustainable demand (Magnus, 2018).
Thirdly, the country lacked in efficient resource allocation due to absent market
mechanisms and centrally set production quotas (Magnus, 2018).
On the other hand, economic performance under Mao was considerably higher than
before, which is mostly attributed to the large increase in physical and human capital
(Brandt & Rawski, 2008). This argument is further supported by Chinese governmental
statistics, which measured annual GDP growth at 7.9 percent annually between 1952 and
1978 (Morrison, 2019b). Yet, this growth rate has been questioned by many analysts and
7historians alike, who expect the number to be artificially elevated for political reasons.
Besides this, severe reporting deficiencies as well as the abolishment of the Statistical
Bureau during the Cultural Revolution cast additional doubt on the growth rate posted by
the Chinese government (Maddison, 2007). For the same time period, economist
Maddison (2007) expected that the actual GDP growth was closer to 4.7 percent per
annum. Moreover, even though economic growth drastically increased under communist
rule, it still lagged behind a number of Western nations. Likewise, living conditions did
not equally improve and remained well below developed countries (Maddison, 2007).
Lastly, Mao’s Great Leap Forward (1958-1960) as well as the Cultural Revolution (1966
– 1976) resulted in drastic economic, social and institutional disorder and in the loss of
up to forty million lives (Brandt & Rawski, 2008).
2.2 Reform and Opening Up, 1978 – 1997
With the death of party Chairman Mao in 1976, the country commenced to reform its
economic and political system. The country gradually moved away from its Soviet-based
and autarchic economic model with the aim to promote greater economic growth and
improve living conditions for its citizens (Brandt & Rawski, 2008). These reforms are
mostly attributed to Deng Xiaoping, who headed the country from 1978 to 1992, and is
seen as the architect behind China’s economic development and global ascent (Brandt &
Rawski, 2008). Deng institutionalised reforms, established political structures to avoid
power concentration in one single person and implemented reforms based on rule of law
rather than by discretion (Magnus, 2018). This process of experimental liberalisation was
described by Deng Xiaoping as ”crossing the river by feeling the stones” (Chow, 2018,
p. 107). In other words, as no blueprint of similar market liberalisation existed, China
implemented and tested their reforms first on a small scale in rural areas. When the
policies proved to be successful, they were rolled out to larger coastal cities and only then
became applicable on a nationwide scale to China (Chow, 2018). One of the first key
reforms eased restrictions on agricultural prices and farmer collectives were given the
permission to sell excess capacity at free market prices (Magnus, 2018). By 1983, this
initial reform was rolled out to the whole country (Magnus, 2018).
In order to attract foreign investments and capital, a further major reform included the
creation of four special economic zones (SEZs) in 1980. As such, Shenzhen (bordering
8Hong Kong), Zuhai (close to Macau), Shantou and Xiamen (adjacent to Taiwan) were
granted special legal characteristics (Maddison, 2007). These included duty-free imports
and exports, tax cuts for foreign and domestic investors as well as special tariff incentives
(Maddison, 2007). The system proved to be successful and by 1985, 14 additional coastal
cities were awarded SEZ characteristics (Maddison, 2007). These SEZs were paramount
in facilitating international trade and integrating China into the world economy.
Furthermore, the gradual reforms facilitated the transfer over control of enterprises from
the central government to local and provincial municipalities (Morrison, 2019). As
outlined by Morrison (2019), these reforms boosted production and increased efficient
resource allocation especially in the sectors of agriculture, services and trade. The
decentralisation of the economy also led to a growing number of smaller, privately owned
enterprises which became exposed to greater market forces and supported growth in the
exporting industry (Morrison, 2019b).
The economic reforms under Deng Xiaoping similarly disrupted the financial sector; By
1979, three additional state-owned banks were formed and given the mandate to take over
specific parts of the PBoC’s commercial business (Franklin et al., 2006). As such, the
Bank of China (BOC) specialised on foreign trade and investment transactions, the China
Construction Bank (CCB) took over the business of fixed investments in manufacturing
whereas the Agricultural Bank of China (ABC) was given the mandate to focus on all
banking activities in rural China (Franklin et al., 2006). Lastly, the Industrial and
Commercial bank of China (ICBC) was established in 1984, with the purpose to take over
the remaining commercial activities from the PBoC. In 2020, the four banks of ICBC,
CCB, ABC and BOC, were not only the four dominating banks in China, but also ranked
as the four largest banks globally in terms of total assets (Ali, 2020).
In 1988, a further financial reform granted permission to certain SOEs to sell up to 30
percent of the companies’ share to employees (Magnus, 2018). This primary easing on
ownership restrictions provided a new institutionalised framework which further enabled
the grounds for the reopening of the Shenzhen stock exchange (SZSE) in 1990 and the
Shanghai stock exchange (SSE) in 1991 (Magnus, 2018).
Despite China’s strong economic growth and a corresponding rise in living standards, the
country still struggled with a corruption ridden system and nepotism, as well as a high
9inflation rate in the late 1980s (Chow, 2018). With the death of former party secretary Hu
Yaobang, student protests erupted on the Tiananmen Square in Beijing and were
forcefully shut down by the military on June, 4th 1989 (Garnaut et al., 2018). The violent
reaction to the student protests led to party internal conflicts as well as to heavy criticism
from abroad (Garnaut et al., 2018). Several countries, such as US, imposed trade sanctions
against China, resulting in a sharp decline of GDP growth in the following two years. As
illustrated in figure 1, GDP growth declined from 11.2 percent in 1988 to 4.2 percent in
1989 (IMF Data Mapper, 2020). After a further drop to 3.9 percent in the following year,
the sanctions were lifted in 1991 and economic reforms commenced (IMF Data Mapper,
2020). Congruent with this, GDP growth bounced back to more than 14 percent in 1992
(Morrison, 2019b).
Figure 1: Chinese annual percent change in real GDP growth (IMF Data Mapper, 2020, own
illustration)
In lieu with growing international trade and increasing demand for foreign currency
transactions, the CCP abolished its stringent currency controls in 1986 (Magnus, 2018).
A dual exchange rate system was introduced which allowed exporters to sell foreign
currencies in a slightly less regulated secondary market at better rates (Magnus, 2018).
By 1996, a further reform allowed the RMB to become fully convertible against foreign
currencies when used for current account transactions (Magnus, 2018).
102.3 Transformational Period, 1997 – 2008
In 1997, the 15th party congress of the CCP unfolded new reforms which focused on the
modernisation of inefficient and unprofitable SOEs (Liew, 1994). The party remained in
control of 500 to 1000 large SOEs, converted some into stock corporations and sold off
smaller and less profitable SOEs to domestic investors (Magnus, 2018). Within four
years, 86 percent of all SOEs underwent restructuring and approximately 70 percent of
all former SOEs were privatised (Magnus, 2018).
The Asian financial crisis, which unravelled simultaneously in 1997, hit financial markets
and policymakers with great surprise (Liew, 1994). The crisis, which most severely
affected Thailand, Malaysia, South Korea and Indonesia had however only limited impact
on China (Liew, 1994). Nonetheless, China’s GDP growth slowed down to 7.8 percent in
1998 as reflected in figure 1 (IMF, 2019). As pointed out by Liew (1994), the four
aforementioned countries all displayed strong GDP growth rates, relatively healthy fiscal
accounts as well as outstandingly high saving rates previous to the crisis. The IMF (1998)
attributed the crisis to the countries’ rapid growth rates which attracted large-scale foreign
investments ignoring underlying risks and policy weaknesses. Moreover, the institutional
policies failed to keep up with the rapidly changing environment and the countries
maintained their domestic currencies pegged to the USD even at unsustainable levels
(IMF, 1998). With the beginning of the crisis, fear among investors led to a rapid
acceleration of capital outflows causing large devaluations of the local currencies (Liew,
1994). The devaluations made it impossible for the central banks to keep the hard-pegs
vis-à-vis the USD in place, and Thailand was the first country to unpeg its currency from
the USD in July 1997 (Magnus, 2018). Yet, the newly floating exchange rate regime
caused further currency devaluation and capital flights which eventually led to a deep
recession (Magnus, 2018).
Hence, rather than being caused by reckless spending or sluggish growth, the crisis is
mainly attributed to have been triggered by incompatible macroeconomic policy
configurations (Liew, 1994). As such, it is argued that the countries most affected were
ignoring the policy constraints imposed by the Impossible Trinity (Aizenman & Ito,
2014).
11Although China was not as severely affected as other Asian economies, Magnus (2018)
argues that the financial crisis has led the CCP to rethink China’s monetary policy
objectives. As such, Magnus (2018) states that the crisis was taken as a warning by
Chinese authorities to maintain its tight control over the country’s capital accounts in
order to prevent a similar crisis.
In 2001, China joined the WTO, which is seen by many as a crucial milestone in the
country’s opening-up process (Magnus, 2018). In line with its accession, the country
moved away from selective liberalisation policies and committed to structural reforms
(Magnus, 2018). This included the lifting of tariffs and taxes on agricultural and
manufacturing goods, as well as a reduction on foreign investment restrictions (Chow,
2018). The reason for China’s WTO accession has often been linked to the country’s need
for greater domestic competition. In fact, Chow (2019) outlines that reforms in the
agricultural and service sector slowed down in the 1990s, likewise, the transformation of
SOEs into shareholding companies did often not result in the expected outcomes. Hence,
an increase in foreign competition was seen as a vital element to modernise and increase
efficiency in China’s domestic industries (Chow, 2018).
Furthermore, the WTO membership underpinned China’s growing importance in the
world economy, which is reflected in figure 2 by the country’s rising percent share of the
world’s GDP. By 1997, China’s share of the world’s GDP amounted to 6.5 percent, which
nearly doubled to 12 percent by 2008 (IMF Data Mapper, 2019).
12Figure 2: Percentage share of world GDP (measured at purchasing power parity) (IMF Data
Mapper, 2019, own illustration)
In short, after the Asian financial crisis, the new millennium brought deeper economic,
political and financial integration for China amplified through the country’s accession to
the WTO and its gradual economic reforms. China was able to maintain its remarkable
growth and the nation achieved double-digit GDP growth rates for most years, up until
the GFC in 2008. This growth was achieved through an increasingly sophisticated export
industry, a high saving rate, which supported large-scale investments, as well as the influx
of new workers from the countryside to the cities’ (Garnaut et al., 2018).
The years before the GFC have been significant in transforming China into the world’s
largest exporter and trader, as well as into a nation with immense surplus savings for
foreign investments (Garnaut et al., 2018). Yet, the country’s growth heavily relied on
the creation of debt and resulted in excessive lending practices to SOEs in addition to an
overall decrease in credit quality (Garnaut et al., 2018).
133 Recent Economic Developments (2008 – 2016)
This chapter reports on the recent economic developments of China and on its resulting
side-effects. In particular, focus is put on China’s monetary stimuli response in the wake
of the GFC in 2008 and the corresponding developments in the credit and the shadow-
banking market. A further assessment of China’s liberalisation steps in regard to its
foreign exchange rate, capital account mobility and monetary sovereignty is outlined in
chapter 7 of this thesis.
China’s debt funded expansion and accumulated trade surpluses were generally accepted
by its trading partners until the GFC changed the economic and political landscape in
2007 (Garnaut et al., 2018). Similar to the Asian financial crisis of 1997, the GFC hit the
world economy with surprise and led to an economic slow-down across the world. With
this, Chinese exports to Europe and North America experienced a sharp decline and the
Chinese economic expansion was once again jeopardised by an external financial crisis
(Garnaut et al., 2018). In 2008, China countered the GFC with enormous fiscal stimuli
programmes, totalling USD 600 Billion, or approximately 20 percent of the Chinese GDP
(Burdekin et al., 2012). These stimuli packages were combined with a government
request directed to the country’s banks to support the economy by increasing borrowing
to private and commercial clients (Burdekin et al., 2012). Through these means, among
others, the country was able to stimulate demand and largely insulate its economy from
the economic recessions experienced in the US and Europe (Burdekin et al., 2012).
Notwithstanding, Luo (2016) reports that the large stimuli packages and the push in
lending growth has further increased the widespread concern over the country’s overall
loan quality and its rate of non-performing loans (NPL). Additionally, unwanted side-
effects have arisen in form of a shadow-banking market which will be further elucidated
in section 3.2.
143.1 China’s Credit Boom
China’s economic rebound after the GFC was accompanied by a corresponding increase
in the country’s debt level (Chen & Kang, 2018). China’s total debt rate of the non-
financial sector (core debt), consisting of government, corporate and household debt,
stagnated at around 135 percent of total GDP in the years preceding the GFC (Chen &
Kang, 2018). As a result of the PBoC’s fiscal easing to combat the GFC, China’s core
debt rate has been sharply increasing in the preceding years (Chen & Kang, 2018). As
such, the country’s core debt level rose to over 170 percent in 2011, and by 2017, to a
staggering 257 percent of GDP, making it the world’s most indebted emerging market
economy (BIS, 2020; Ma, 2019).
Figure 3: China’s core debt (percentage of total GDP) (BIS, 2020, own illustration)
Government Households Non-financial corporations
Government Households Non-financial corporations
300%
300%
250%
250%
200%
200%
150%
150%
100%
100%
50%
50%
0%
0%2006 2007 2008 2009 2010 2011 2012 2013 2014 2015 2016 2017 2018 2019
2006 2007 2008 2009 2010 2011 2012 2013 2014 2015 2016 2017 2018 2019
Surprisingly however, and as reflected in figure 3, China’s government debt ratio is
unusually small. Between 2008 and 2019, government borrowing in relation to GDP rose
by 25 percentage points to 52.5 percent of total GDP in 2019, as per the data from the
Bank of International Settlements (BIS, 2020). Likewise, China’s household borrowings
have been steadily increasing, yet remain at modest levels, totalling 54.4 percent of GDP
in 2019 (BIS, 2020). Hence, the increase in China’s non-financial debt rate stems largely
from the corresponding growth in the country’s rate of corporate borrowings to SOEs and
private enterprises (Ma, 2019).
15As such, China’s corporate debt ratio rose from 97 percent in 2008 to 150 percent of total
GDP in 2019, making it likewise to one of the highest corporate debt rates globally (BIS,
2020; Ma, 2019). This debt growth, particularly the rise of corporate borrowings, has
fuelled growing concern over China’s credit trajectory. In the past, international
experiences have shown that rapidly rising debt levels are often unstainable in the long
run and typically end with a financial crisis or an economic slow-down (Chen & Kang,
2018). Yet, some argue that China’s debt level is manageable as a large share of it is
owned by SOEs, which facilitates governmental control and enhances the likelihood of a
bail-out (Magnus, 2018). Additionally, the country’s official NPL ratio of 1.59 percent in
2015 indicates no sign of market distress (PwC, 2015). Especially when put into
comparison with the World Bank’s global NPL average of 4.2 percent in 2015, concern
over China’s rapid credit growth seem unfounded (PwC, 2015).
Yet, the Chinese calculation of the NPL ratio poses several difficulties. Firstly, China has
a unique way to recognize NPLs. In particular, banks are given discretion such that they
only have to classify a loan as NPL when an actual loss on the banks’ side is expected
(PwC, 2015). Even if an outstanding debtor has filed for bankruptcy and lags more than
90 days behind the repayment’s due date, the loan does not necessarily have to be reported
as a NPL, as long as the bank does not expect to occur a loss on it (PwC, 2015). This is
contrary to European and American banks, which follow stricter reporting rules where a
loan is classified as a NPL once the debtor is more than 90 days in arrears of interest or
principal repayment (PwC, 2015). Secondly, a large share of lending occurs in the
shadow-banking market in which the number of NPLs is difficult to assess.
Hence, scholars and international institutions alike remain cautious over China’s official
NPL ratio, as it is assumed to understate the actual scale of the problem (Magnus, 2018).
Some estimates assume China’s NPL rate to be up to 22 percent (Zhong, 2016), whereas
a more conservative analysis by the IMF’s Global Financial Stability Report (2016)
estimated China’s NPL ratio to be around 15.5 percent of all lending. If the IMF’s
estimate holds, the country would face up to USD 1.3 trillion in bad debt, making its high
debt rate to a systematic threat (Daniel, 2016). Even though the actual scale of NPLs is
difficult to assess, the problem is bound to become more severe when the economy faces
a slow-down or an interest rate hike (Ma, 2019).
163.2 Shadow-Banking in China
The shadow-banking industry, also referred to as the informal financial sector, consists
of bank-like institutions which offer the same core service of credit intermediation and
investment solutions as their traditional counterparts (Kodres, 2013). Yet, shadow banks
are not subject to the same supervision and regulatory scrutiny as traditional banks
(Kawai & Liu, 2015; Kodres, 2013). Shadow banks operate in an informal, mostly under-
regulated area, and offer their services primarily to firms and individuals whose needs
have been under-served by the traditional financial sector (Tsai, 2015).
Shadow-banking activities are found in every financial system and are particularly
prominent in advanced economies (IMF, 2014). Although its form, offering and size
varies between the individual economies, a common denominator for growth is related to
increasing governmental restrictions and ample market liquidity (IMF, 2014).
3.2.1 Growth of China’s Shadow-Banking Industry
The rapid development of the Chinese shadow-banking market is based on several
factors. Firstly, growth was spurred by the financial repressions of the government which
favours SOEs over privately-owned companies (Tsai, 2015). This is further explained by
Tsai (2015), who highlights that over 85 percent of all loans granted by state-owned banks
are extended to state-affiliated enterprises. This development has caused a massive
misallocation of funds to often inefficient state-owned enterprises and away from more
market-driven private enterprises (Lo, 2015). Hence, private firms are, since the early
years of financial reforms, largely relying on the shadow-banking industry to finance their
operations (Tsai, 2015).
Secondly, and according to the IMF’s Global Financial Stability Report of 2014, the
tighter restrictions imposed by the Chinese government on lending practices have further
fuelled growth in the shadow-banking market. Resulting from the monetary easing and
stimuli programmes of 2008, bank lending rapidly increased and concerns about inflation
and the high debt rate became more prominent in 2010 (IMF, 2014). In order to curb-
down on excessive loan taking, the government imposed more conservative lending
quotas and reference rates which successfully slowed-down bank lending in the official
sector (IMF, 2014). Yet, the increasing regulations were unable to significantly reduce
17the over-all credit demand (Kawai & Liu, 2015). In order to meet the remaining high
demand for credit, and as clients were no longer able to refinance their loans in the official
sector, China’s commercial banks engaged in off-balance-sheet lending in the informal
banking sector (Kawai & Liu, 2015). This led to an unprecedented influx of borrowers
and lenders into the shadow-banking sector.
Thirdly, the rapid growth of the Chinese shadow-banking market was related to the
growing number of Chinese internet users and the development of new technologies.
Early on, the shadow-banking industry digitalised its offerings and therefore became
easier to access and available to a larger share of consumers (Tsai, 2015). By 2014, more
than 60 percent of the Chinese population had used online-based financing and
investment products (Tsai, 2015). As further outlined by Tsai (2015), internet finance in
China is considered to be a part of the shadow-banking industry due to its unregulated
character. In this segment, Peer-to-Peer (P2P) lending platforms, which match borrowers
and lenders together in return for a small fee, have become the fastest growing service
(Tsai, 2015). At its height in 2015, more than 6’000 individual P2P lending networks
operated in China and eased credit facilitation between lender and borrowers (Leng &
Tham, 2019).
Although a proper market size evaluation poses difficulty to assess due to the sector’s
unregulated nature, the IMF (2014) states that “As of March 2014, shadow-banking social
financing had risen to 35 percent of GDP and is expanding at twice the rate of bank
credit.” (p.77). Other estimates have assessed the size of China’s shadow-banking market
between 29 to 69 percent of total GDP (Tsai, 2015).
3.2.2 Risk Factors
The shadow-banking industry brings benefits to the financial system by complementing
and expanding the offerings of traditional banks (Luo, 2016). As such, the informal
banking sector has generated greater credit accessibility, improved market liquidity and
increased risk-sharing (IMF, 2014). Furthermore, the informal banking sector in China is
paramount to the funding of small and medium sized privately-held enterprises (Luo,
2016).
18Nonetheless, risks associated with the shadow-banking sector are substantial. As such,
Luo (2016) outlines that the industry faces a high liquidity risk resulting from poor cash
flow management and the financing of long-term illiquid investments through short-term
funds. This poses a substantial threat especially during financial crises, when a large
number of investors want to withdraw their capital at once and therefore force shadow
institutions to sell assets at well-below market prices (Kodres, 2013). Moreover, the
unregulated nature of the business makes a thorough assessment and evaluation of the
industry impossible (Tsai, 2015). Although this lack of disclosure obligation provides the
firms with greater flexibility compared to the traditional banks, its unregulated
characteristics are often related to improper risk management, low redemption reserves
and a misevaluation of asset prices (Kodres, 2013). Furthermore, Kawai and Liu (2015)
point out that the spread of shadow-banking activities can lead to a less autonomous and
effective monetary policy, and in general, the shadow-banking sector is assumed to have
a destabilising effect on financial markets.
3.2.3 Suppression of the Chinese Shadow-Banking Market
The aforementioned risks have had severe impact on the Chinese shadow-banking market
and its regulations. By 2013, first signs of market distress emerged and several smaller
P2P platforms became insolvent (Rabinovitch, 2014). The CCP has acknowledged these
risks and has since then taken several steps to extend greater control over the informal
banking sector. By 2014, the State Council ensured that each specific form of the shadow-
banking sector was subject to regulation by a dedicated agency (Tsai, 2015).
Yet, further problems amounted with a rising number of fraudulent platforms related to
asset theft and disappearing P2P platform owners (Wildau, 2017). As further reported by
Wildau (2017), these developments led to increased governmental scrutiny which
rigorously started to inspect and shut down on fraudulent platforms. Additionally, P2P
platforms were required to place assets with a custodian bank to prevent the theft of client
funds (Wildau, 2017). In line with these restrictions, the number of P2P networks dropped
from more than 6,000 platforms in 2015, to a mere 427 platforms by the end of October,
2019 (Leng & Tham, 2019).
By 2019, the government ordered still existing P2P lending platforms to exit the industry
and transform their business into regulated loan providers within two years (Leng &
19Tham, 2019). To do so, the firms are required to adhere to capital requirements of no less
than RMB 50 million, this reform is described by the government as a crucial step to
reduce credit risks, maintain social stability and to develop an inclusive financial market.
(Leng & Tham, 2019).
In summation, P2P lending and other shadow-banking activities were on an
unprecedented growth path since the GFC and attracted large sums of capital. However,
the once booming industry was overshadowed by concern over credit stability, capital
reserves and trustworthiness since 2013. The tighter governmental restrictions on the
once unregulated platforms has led to a massive reduction of operating platforms.
Additionally, the latest actions taken by the CCP in 2019 imply a complete shut-down of
the P2P lending business in China.
Overall, the government seems to be well aware of the issues that China’s contemporary
economic system faces. In 2016, The 13th Five-year plan of the CCP outlined the need
to rebalance the economy and move away from unbalanced and unsustainable growth.
Furthermore, the five-year plan provided detailed insights on the country’s economic and
social problems which have previously often been unreported on. In detail, the five-year
plan raises attention to the following points:
“[...] we must be soberly aware that China’s development model is
inefficient; uneven, uncoordinated, and unsustainable development continues
to be a prominent problem; the change of pace in economic growth, structural
adjustments, and the transformation of the drivers of growth present
interwoven problems; and we face a host of challenges, such as ensuring
steady growth, carrying out structural adjustments, guarding against risks,
and bringing benefit to the people. Weak effective demand exists alongside
insufficient effective supply; structural problems are becoming more evident;
traditional comparative strengths are growing less effective; the capacity for
innovation is not strong enough; downward pressure on the economy is
growing; imbalances between government revenue and expenditures have
become more marked, and latent risks are mounting in the financial sector.”
(Central Compilation and Translation Press & Central Committee of the Communist
Party of China, 2016, p. 6)
20You can also read