Cholera transmission dynamic models for public health practitioners
←
→
Page content transcription
If your browser does not render page correctly, please read the page content below
Fung Emerging Themes in Epidemiology 2014, 11:1
http://www.ete-online.com/content/11/1/1                                                                                EMERGING THEMES
                                                                                                                        IN EPIDEMIOLOGY

 ANALYTIC PERSPECTIVE                                                                                                                         Open Access

Cholera transmission dynamic models for public
health practitioners
Isaac Chun-Hai Fung1,2

  Abstract
  Great progress has been made in mathematical models of cholera transmission dynamics in recent years. However,
  little impact, if any, has been made by models upon public health decision-making and day-to-day routine of
  epidemiologists. This paper provides a brief introduction to the basics of ordinary differential equation models of
  cholera transmission dynamics. We discuss a basic model adapted from Codeço (2001), and how it can be modified
  to incorporate different hypotheses, including the importance of asymptomatic or inapparent infections, and
  hyperinfectious V. cholerae and human-to-human transmission. We highlight three important challenges of cholera
  models: (1) model misspecification and parameter uncertainty, (2) modeling the impact of water, sanitation and
  hygiene interventions and (3) model structure. We use published models, especially those related to the 2010 Haitian
  outbreak as examples. We emphasize that the choice of models should be dictated by the research questions in mind.
  More collaboration is needed between policy-makers, epidemiologists and modelers in public health.

Introduction                                                                         have been modeled; examples include estimation of the
Since the 19th century, humans have experienced seven                                basic reproduction number (R0) [3,4], seasonal variation in
cholera pandemics. The seventh pandemic started in                                   cholera incidence [5], inapparent cholera infections [6],
Indonesia in 1961 and continues to threaten vulnerable                               hyperinfectivity of V. cholerae [7], human-to-human trans-
populations globally [1]. The cholera outbreak that                                  mission [8], and the role of human mobility and river net-
began in October 2010 in Haiti, where cholera had been                               works in transmission [5,9]. Mathematical models also
absent for a century, reminds us the importance of                                   allow us to prospectively estimate the impact of various
timely cholera prevention, treatment and control and                                 interventions, from treatment (oral rehydration therapy
the critical importance of water and sanitation infra-                               and antibiotics) to prevention (oral cholera vaccine
structure that has eliminated cholera from much of the                               (OCV), and water, sanitation and hygiene (WASH) in-
developed world [2].                                                                 terventions (e.g. [9-12])).
   To better understand cholera epidemiology retrospect-                                The purpose of this paper is to introduce cholera dy-
ively and to predict the impact of interventions in the                              namic transmission models to public health practitioners,
future, many researchers have begun using mathematical                               with an educational emphasis of conveying modeling con-
models as tools complementary to field epidemiology                                  cepts to students of these models. Models are simple, but
and statistical analysis. Mathematical models help us                                not simplistic representations of the real world. They are
conceptualize the transmission dynamics in a quantita-                               used to capture the “essence” of a complex phenomenon.
tive way and allow us to test different hypotheses and                               Models may help us better understand the relationship be-
understand their relative importance in silico. Important                            tween different parts of the system. Some models may
epidemiological observations and hypotheses for cholera                              shed light on past epidemics while some may help us fore-
                                                                                     cast the future. Here we define dynamic transmission
                                                                                     models as models that explicitly simulate the transmission
Correspondence: CFung@georgiasouthern.edu
1
 Department of Epidemiology, Jiann-Ping Hsu College of Public Health,
                                                                                     dynamics of infectious diseases in time. This paper will
Georgia Southern University, Statesboro, GA, USA                                     focus on the ordinary differential equation (ODE) models
2
 Health Economics and Modeling Unit, Scientific and Program Services                 (population-based continuous-time models as contrast to
Branch, Division of Preparedness and Emerging Infections, National Center
for Emerging and Zoonotic Infectious Diseases, Centers for Disease Control
                                                                                     population-based discrete-time models using difference
and Prevention, Atlanta, GA, USA

                                        © 2014 Fung; licensee BioMed Central Ltd. This is an open access article distributed under the terms of the Creative Commons
                                        Attribution License (http://creativecommons.org/licenses/by/2.0), which permits unrestricted use, distribution, and
                                        reproduction in any medium, provided the original work is properly cited.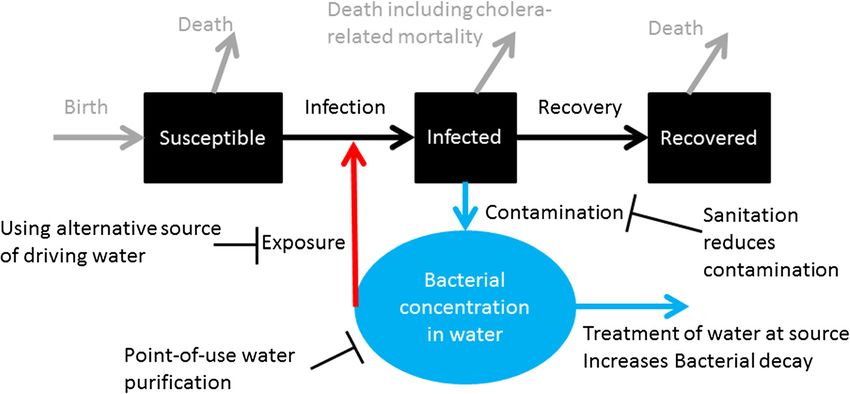
Fung Emerging Themes in Epidemiology 2014, 11:1                                                               Page 2 of 11
http://www.ete-online.com/content/11/1/1

equations), while we will mention relevant agent-based          ODE models can be programmed in computers using
models where appropriate (e.g. [9]).                          different languages, software and platforms, for example,
  Through a basic model, we will explain the major pa-        C, C++, Matlab, Mathematica, R, and Berkeley Madonna.
rameters and how interventions may change them. We            For further details of these models, public health students
will discuss how different assumptions and hypotheses         of mathematical modeling may refer to general modeling
can be accommodated by making changes to the model’s          texts, for example, Anderson and May [16], Cummings
structure. Focus is given to the way different research       and Lessler [14], Keeling and Rohani [17], and Vynnycky
questions dictate the model structure. Published models       and White [15].
were chosen as illustrations and the list is not meant to
be exhaustive. Priority is given to papers that model spe-
cifically the 2010 Haiti cholera epidemic. Instead of be-     The basic model
ing a systematic review of all existing cholera models,       Following the example of Grad et al. [18], we adapt the
my aim is to highlight three current major challenges of      model of Codeço [19] as our basic model through which
modeling efforts of cholera transmission dynamics: (1)        we explain how the transmission dynamics of cholera is
parameter uncertainty and model misspecification; (2)         modeled mathematically.
interventions (especially, water, sanitation and hygiene);      Figure 1 presents a schematic of the basic model. The
and (3) model structure. Spatial and climatic elements        black boxes represent people: susceptible (S in equations
are also important features but they are beyond the           in “The basic model” in Additional file 1); infectious (I);
scope of this paper (they are briefly discussed in the        and recovered (R). The blue circle represents cholera
Additional file 1). For a detailed review of the recent       bacterial concentration in the water reservoir (B).
cholera modeling literature, please refer to ref. [13].
                                                                 Black arrows: Susceptible people become infected/
                                                                  infectious and they later recover and become
Some basic concepts                                               immune.
First, let us review some basic concepts. In an ODE              Blue arrows: Infectious people contaminate the
model of infectious diseases, we divide the population            water supply with bacteria and the bacteria decay.
into a number of compartments. For example, in a                 Red arrow: Susceptible people are exposed to
Susceptible-Infected-Recovered (S-I-R) model, the popu-           contaminated water and may become infected.
lation is divided into three compartments depending on           Gray arrows: People are born into the susceptible
their status of being susceptible to the infection (S), be-       population; they may die as a result of cholera
ing infected and infectious (I), and having recovered             infection or other reasons.
from the infection (R). Individuals in each compartment
were assumed to be homogeneously mixing with each               Please refer to the Additional file 1 for the equations
other [14]. The ODEs of the model capture the change          and explanations of the variable and parameters. For
of the number of individuals in each compartment over         models that simulate an outbreak within a short period
continuous time. While ODE models have their own set          of time (e.g. one year), one can ignore the dynamics of
of assumptions and limitations, they are commonly used        population growth (birth rate and death rate, gray ar-
in epidemiologic modeling because we can use a few            rows) and assume a constant population.
equations to represent the transmission dynamics and            Here are the key assumptions:
create an easy-to-understand model for public health
practice.                                                       1. Infected individuals are infectious and contribute to
  The basic reproduction number, R0, is usually defined            bacteria shedding, which imply that asymptomatic
as the number of individuals that an infected (and infec-          individuals contribute as much bacteria to the water
tious) individual can infect when he or she is introduced          supply as symptomatic individuals.
into a completely susceptible population. For example,          2. Immunity obtained through infection lasts longer
for a disease with R0 = 2, an infected individual on aver-         than the timeframe studied by the model (for
age infects two individuals in a totally susceptible popu-         example, 1 year).
lation. The effective reproduction number, R or RE, is
defined as the number of individuals infected by a typ-         These assumptions will be relaxed later as we modify
ical infectious individual when a fraction of the popula-     the model structure to accommodate asymptomatic in-
tion is protected from infection through immunity,            dividuals and waning immunity.
prophylaxis or non-pharmaceutical interventions [15].           In the following sections, we will discuss three current
For example, for a disease with R0 = 2, and if half of the    major challenges of modeling efforts of cholera trans-
population is immune to this disease, RE = R0 * ½ = 1.        mission dynamics: (1) parameter uncertainty and model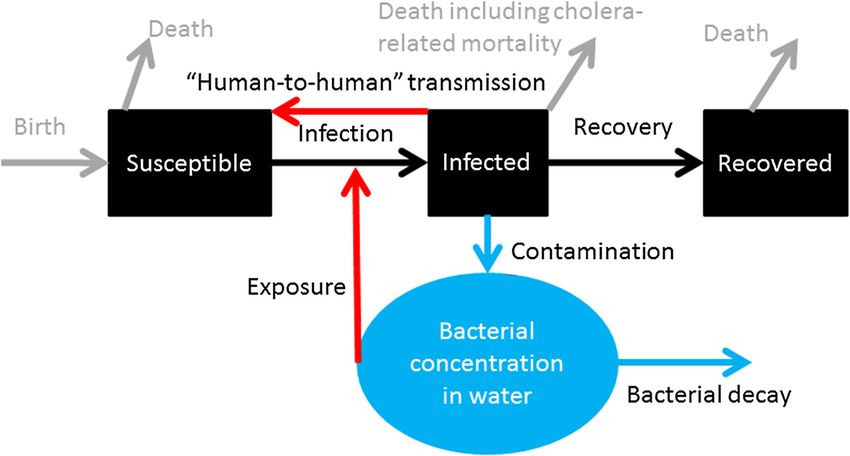
Fung Emerging Themes in Epidemiology 2014, 11:1                                                                     Page 3 of 11
http://www.ete-online.com/content/11/1/1

 Figure 1 Schematic of a basic model of cholera transmission dynamics (model adapted from Codeço [19]).

misspecification; (2) interventions (especially, water, sani-      problems are referred as model mis-specification, where
tation and hygiene), and (3) model structure.                      the item of interest is different from what the model ac-
                                                                   tually models, e.g. empirical experiments provide dose
Model misspecification and parameter uncertainty                   data in terms of the number of bacteria, while the model
The first challenge is model misspecification and param-           needs the bacteria concentration data in the environ-
eter uncertainty, that was highlighted by Grad et al. [18]         mental water [18].
and is briefly summarized as follows. To parameterize a
cholera transmission model is challenging. In the basic            Parameter uncertainty
model, we note that the rate of cholera transmission is a          The per capita recovery rate is probably the most certain
product of the force of infection (λ) and the size of the          of all parameters in the model. It is approximately equal
susceptible population (S). The force of infection in turn         to the reciprocal of the duration of infection (1/γ), a par-
depends on three parameters or variables (see Additional           ameter that more data are available. Cholera life span in
file 1):                                                           water reservoir (1/δ) depends on the local environment.
                                                                   While it is largely unmeasured in many endemic or epi-
  1. β: the “contact rate” between the susceptible                 demic contexts, modelers can use historical experimen-
     population with contaminated water,                           tal data from the literature and therefore this parameter
  2. B: the level of contamination of the water supply             is also relatively certain. The rate of water contamination
     (V. cholerae concentration), and                              by infectious people shedding V. cholerae into the water
  3. κ: the concentration of V. cholerae at which the              reservoir (ξ) depends on both bacteria shedding of the
     infection rate is 50% of the maximum infection rate,          infected individuals (a biological quantity) and the level
     that is β.                                                    of sanitation in the environment (an environmental as-
                                                                   sessment). This is largely unknown in most contexts.
Model mis-specification                                            These problems are that of parameter uncertainty.
The “contact rate” and the V. cholerae concentration are              Therefore, in the cholera mathematical model litera-
largely unknown in most contexts. As Grad et al. [18]              ture, the values of the parameters used vary greatly as
have rightly pointed out, there are no simple methods              seen in Table 1. Grad et al. have cautioned potential
that can convert results of experimental studies (for ex-          users of cholera models in their interpretation of model-
ample, “a measured dose-response relationship between              ing outputs as the high variability of some of these pa-
number of vibrios ingested and the risk of infection”              rameters would translate into great uncertainty in the
[18]) into the “contact rate” between susceptible individ-         outputs [18]. Uncertainty analysis should be performed
uals and bacteria in water (β), and the concentration of           for these parameters [18]. (For a detailed analysis of par-
V. cholerae in the water reservoir that will make 50% of           ameter uncertainty of cholera models, please refer to
the susceptible population ill (κ) [18]. The rate at which         ref. [18]. For a discussion of the values and their data
susceptible individuals become infected is determined by           sources of some of the parameters, see Additional file 1).
many variables in reality, most of which cannot be easily             Equally important is data collection from the field that
measured. As the “contact rate” (β) can rarely be mea-             informs model parameterization (see Table 1). For ex-
sured directly from experimental studies, it is usually es-        ample, in a neighborhood affected by cholera, we can in-
timated by fitting models to time series data. These               vestigate the various sources of drinking water for a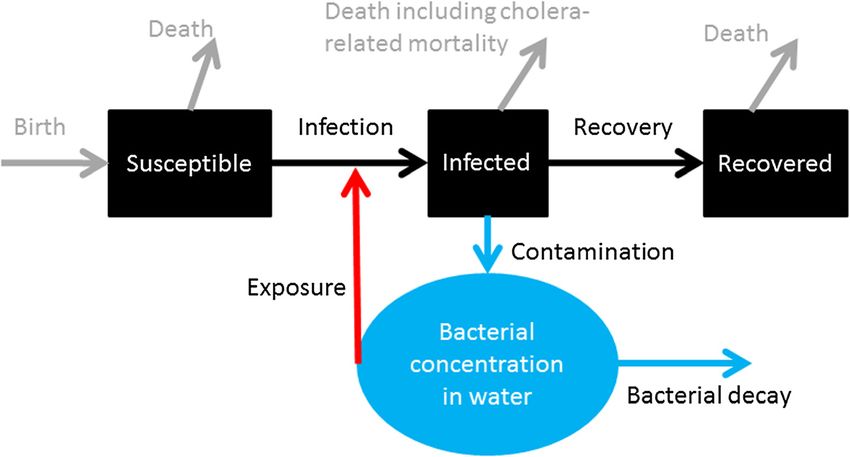
Fung Emerging Themes in Epidemiology 2014, 11:1                                                                                            Page 4 of 11
http://www.ete-online.com/content/11/1/1

Table 1 Parameters assumed or fitted based on selected published mathematical models of cholera (partly adapted
from Grad et al., 2012 [18])
Symbol Parameters                                     Range Comments                                          Potential data from field epidemiology
β       Rate of “contact” with reservoir water        10-5 to Difficult to convert empirical data into this Identity and location of drinking water
        (days-1)                                      1       “contact” rate.                               sources; frequency of water usage and
                                                                                                            volume drawn from these sources
1/γ     Duration of cholera infection (days)          2.9 to   The most certain among the 5 parameters Clinical data
                                                      14
1/δ     Cholera life span in water reservoir (days)   3 to     Usually not measured; depending on local Water samples for microbiological
                                                      41       environment (temperature, salinity), nature experiments
                                                               of the water source (running or static),
                                                               cholera phage concentration. Historical
                                                               experimental data available.
ξ       Rate of water contamination by humans, 0.01            Usually not measured; depending on             Clinical data: frequency and volume of
        i.e. rate of increase in V. cholerae        to 10      infection severity, sanitation provision and   watery stool and especially concentration
        concentration in the water reservoir (cells            water reservoir size.                          of vibrios in watery stool.
        * mL-1 * person-1 * day-1)
κ       Concentration of cholera that yields 50%      105 to   The dose–response curves depend on             Based on the volume of water intake per
        chance of infection (cells/mL)                106      strain and biological context (e.g. gastric    person per day and the vibrio
                                                               acidity). While empirical data provided        concentration in the water samples, one
                                                               data for doses (number of bacteria), the       can estimate the dose of vibrio intake per
                                                               parameter measures in concentration.           person per day

given household, their relative importance in terms of vol-                   with antibiotic treatment by decreasing cholera-related
ume drawn or frequency used, and the concentration of                         death rate and increasing recovery rate [24]. Alterna-
cholera vibrios and their decay rate in water samples col-                    tively, patients under treatment can be represented by a
lected from these sources. Just as the human contact data                     distinct compartment [25]. In this case, there will be a
for constructing the contact matrix between different age                     rate at which infected patients receives treatment and
groups in a population is important for influenza trans-                      the recovery rate of the treated patients respectively.
mission models [20], collecting water usage data from a
community is important to the parameterization of peo-                        Vaccine and immunity
ple’s “contact” rate with contaminated water. Eisenberg,                      People recovered from cholera develop immunity that
Robertson and Tien [21] recently suggested that if we can                     protects them from being infected again for several years
measure pathogen persistence time in environmental                            [1]. OCV, if completed with the adequate doses (2 doses
water sources (δ) or pathogen concentration in the water                      for either Dukarol or Shanchol), can also immunize indi-
(B), we can better estimate the parameters of the water-                      viduals against cholera infection for several years before
borne transmission pathway.                                                   they become susceptible again [26-29]. A simple way to
                                                                              represent it in the basic model is to allow oral cholera vac-
Interventions                                                                 cine transferring people from the Susceptible compart-
The second challenge is to model interventions cor-                           ment (S) to the Recovered/Immune compartment (R)
rectly. Interventions can be represented in the model as                      (Figure 2, orange arrow, as in [24]). Similarly, as immunity
a change in the value of a parameter, or a change in the                      wanes, people are transferred from the Recovered com-
model structure. I will first discuss treatment, and then                     partment to the Susceptible compartment (Figure 2, green
OCV, followed by WASH interventions.                                          arrow). If infection-conferred immunity wanes at a rate
                                                                              different from that of vaccine-conferred immunity, then a
Treatment                                                                     separate compartment representing vaccinated individual
The primary treatment for a cholera patient is oral rehy-                     is preferred.
dration treatment (ORT). It prevents dehydration and                             Not everyone vaccinated will be immune to infection.
averts mortality [22]. Severe cases are given antibiotics                     (For example, Shanchol confers 65% direct protection
to speed up their recovery and to reduce the amount of                        against cholera in a 5-year follow-up period) [29]. Fur-
bacteria shed into the environment (see ref. [23], p.127).                    thermore, there is an indirect effect through which un-
The effect of antibiotics treatment can be simulated in a                     vaccinated individuals are protected in communities
model by increasing the recovery rate, γ, and by redu-                        where some individuals are immunized. The concept of
cing the rate of water contamination by treated patients                      herd immunity refers to the fact that individuals im-
in terms of V. cholerae concentration in the water reser-                     mune to an infection will not transmit an infection since
voir, ξ [11]. Another model simulated combined ORT                            they are not infected in the first place. Therefore, by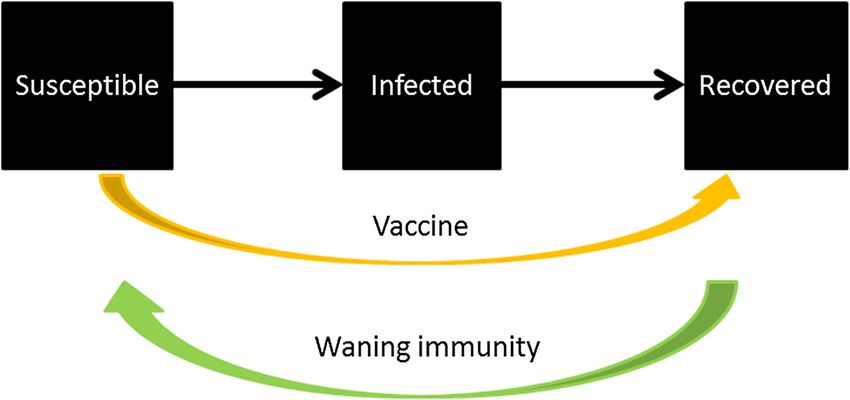
Fung Emerging Themes in Epidemiology 2014, 11:1                                                                   Page 5 of 11
http://www.ete-online.com/content/11/1/1

 Figure 2 Vaccine and waning immunity (Model 1).

vaccinating individuals in a population, indirect protec-      from latrines to flush toilets, reduce water contamination
tion is conferred to other members of the population           from human feces by separating them from the drinking
who are not immunized. For non-immunizing interven-            water supply (reducing contamination rate, ξ). Chlorin-
tions like water, sanitation and hygiene interventions, a      ation of piped water removes bacteria from the water (in-
similar concept may apply and is sometimes known as            creasing the removal rate of bacteria, δ). Point-of-use
herd protection or indirect protection.                        purification via boiling, chlorination, or filters, reduces the
   A dynamic model that explicitly simulates the transmis-     bacterial concentration in drinking water (reducing B). In-
sion mechanism can take these factors into account, if we      terventions that promote alternative sources of drinking
slightly modify the model structure as in Figure 3. The        water reduce “contact” between susceptible populations
compartment “Vaccinated” represents individuals who re-        and contaminated water (reducing β, as in [10-12,24])
ceive two doses of vaccine, are successfully immunized         (Figure 4, Table 2 and Additional file 1). Sometimes inter-
and are truly immune. Some susceptible individuals             vention descriptions in the modeling literature may be
become immune through vaccination (orange arrow) or            confusing, for example, provision of clean drinking water
through recovery from infection (black arrow). As their        might be described as “sanitation” as in ref. [12,24] (see
immunity wanes, they become susceptible again (green           Additional file 1: Table S3). Apparently, linking coverage to
arrow). For more discussion, see Additional file 1.            effectiveness is not easy: some models might reduce β by a
                                                               prescribed fraction in the absence of any inputs in cover-
Water, sanitation and hygiene interventions                    age and in protective effectiveness of a given intervention
Provision of clean water, sanitation and personal hygiene      (Table 3). Instead of simply reducing β by x%, it may be
are all important interventions that can stop cholera trans-   more useful to model the provision of clean water with
mission. In transmission dynamic models, one can simu-         protective effectiveness, y%, and coverage, z%, that results
late the effects of these interventions by changing the        in x% reduction of β, i.e. x = y * z, assuming a linear
values of one or more parameters. Sanitation interventions,    coverage-effectiveness relationship. Policy-makers need to

 Figure 3 Vaccine and waning immunity (Model 2).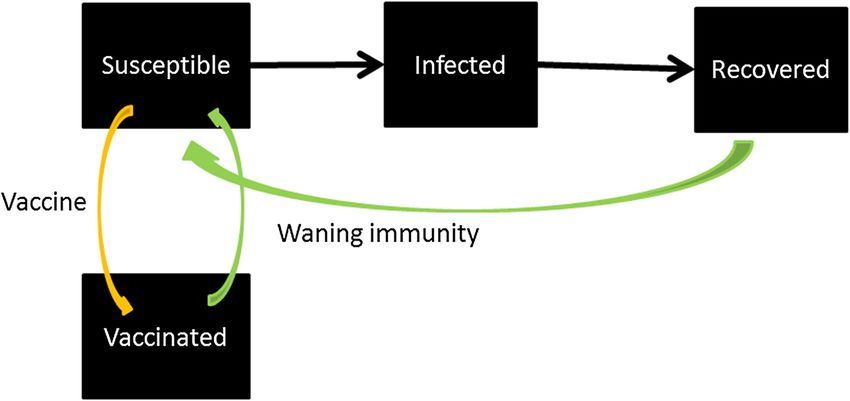
Fung Emerging Themes in Epidemiology 2014, 11:1                                                                                            Page 6 of 11
http://www.ete-online.com/content/11/1/1

 Figure 4 Water, sanitation and hygiene interventions.

know which types of WASH interventions to choose and                           were cited as references. Such a rate of increasing clean
the level of coverage needed to obtain desired outcomes                        water provision, as a daily percent reduction of the rate of
(as in number of averted cases of cholera).                                    drinking contaminated water (β), led to an exponential de-
  Probably the weakest link in modeling WASH inter-                            cline of β [11]. This implies that as coverage of clean water
ventions is the dearth of data that link the programmatic                      provision increases in time (number of weeks, n), the
variables (e.g. implementation coverage) to the reduction                      “contact” rate with contaminated water (β) would reduce
of the transmission coefficient. For example: in one                           as: β*(1–0.01)n. But it is difficult to tell how much more
paper [24], while a value of 10 US dollars per the square                      coverage increase per day is needed to achieve such an
of level of sanitation was provided, it would be in the                        effect.
interest of the readers to provide the means to convert                           Another model [10] estimated the number of people
such “level of sanitation” (i.e. the proportion of reduc-                      who would need clean water provision to achieve the same
tion in β) into any quantity of coverage of any sanitation                     effect as 500,000 people being vaccinated in Haiti. The im-
projects in reality. Likewise, it will be beneficial to the                    plied assumption was that if clean water was provided,
readers if details can be provided as to the “set of mea-                      there would be a 100% reduction of waterborne transmis-
sures” of sanitation that would lead to a 40% reduction                        sion (but not human-to-human transmission). What mat-
in β over a period of one month in Haiti in another ex-                        tered was coverage. (See section ‘Hyperinfectious bacteria
ample [12]. Similarly, readers would benefit if a third ex-                    and “human-to-human” transmission’ below.)
ample [9] could provide data to support their choice of                           The WASH interventions that are chosen, and their
10% or 30% reduction in cholera exposure through a                             effectiveness and coverage have a huge impact upon the
health education campaign of hygiene and sanitation                            results. Comparing a poorly defined WASH intervention
that accompanies the vaccination campaign.                                     with OCV could inadvertently misinform policy-makers
  There are exceptions though. One model [11] simulated                        about which programs should be expanded.
“the effect of a 1% per week reduction in the proportion of                       While it is useful to illustrate ranges of possibilities,
the population consuming contaminated water based on                           future studies should be designed to provide data to
present estimates of clean water provision” in Haiti, by                       parameterize these models. Another example was a model
converting “the estimated proportion covered [by clean                         that incorporated a separate compartment for people who
water provision] since the start of the cholera outbreak into                  received health education and therefore may be infected at
a rate of [increasing] clean water provision”. Two progress                    a rate different from those who did not. It will be benefi-
reports published by Red Cross and Oxfam respectively                          cial if empirical data can be provided to parameterize the

Table 2 Effect(s) on model parameters by water, sanitation and hygiene (wash) interventions
WASH interventions                                                  Effect(s) on parameters
Sanitation interventions and health promotion of their utilization Reduce water contamination rate (ξ)
Treatment of water at source (e.g. chlorination of piped water)     Increases the rate of bacteria removal from water (δ)
Point-of-use water purification (via boiling, chlorination or filters) Reduces the concentration of bacteria (B) of drinking water
Using alternative source of drinking water                          Reduces the “contact” rate between susceptible population with contaminated water (β)
Fung Emerging Themes in Epidemiology 2014, 11:1 Page 7 of 11
http://www.ete-online.com/content/11/1/1
Table 3 Reduction in transmission coefficient (“contact rate”) by water, sanitation and hygiene (WASH) interventions
in selected published models of the Haiti epidemic
Model WASH intervention that the model was Reduction in transmission coefficient Empirical data sources for WASH
supposed to simulate (“contact” rate, β) interventions’ effectiveness or
coverage
Andrews Expansion of clean water provision Exponential decline in β (1% decrease per Estimated coverage of clean water since
and Basu week) the outbreak’s beginning, from two
[11] progress reports by Red Cross and
Oxfam respectively
Bertuzzo Sanitation: “a set of measures”, not explained 40% reduction for 1 month None provided
et al. [12] in their paper
Chao Educational campaign to promote improved 10% or 30% (additional) reduction, in areas None provided
et al. [9] hygiene and sanitation, that accompanies the covered by vaccination campaign
vaccination campaign
Tuite Clean water provision, either to “the same Reduction of waterborne transmission (but not None provided. Implied assumption:
et al. [10] number of people who could be vaccinated” human-to-human transmission) by a fraction 100% reduction of “contact” rate if
or to “the number of people who would that is the probability of provision of clean covered by clean water provision.
need to receive clean water to have the same water within a Haitian department (equivalent
effect on epidemic spread as that achievable to a province), for up to 2 years, beginning at
through vaccination” the same time as vaccination program would
do for the sake of comparison.
rates of health education, of failure to comply with in- is as high as 500–1000 mL/h [31]. Severe cases may shed
structions of health education, and of infection rates of bacteria for one to two weeks while asymptomatic pa-
health-educated individuals (all three parameters were “as- tients typically shed for one day [32]. It is also likely that
sumed”) [25]. Likewise, for the compartment for quaran- the amount of viable Vibrio cholerae per gram of stool
tine of health-educated individuals who were exposed to excreted by a symptomatically infected cholera patient is
cholera, their rate of quarantine after exposure and their greater than (or equal to) the amount of viable vibrios
rate of actually being infected, it will be beneficial if empir- per gram of stool excreted by an asymptomatically in-
ical data can be provided to parameterize them [25]. fected person. It is perhaps worth noting that for the
most part, surveillance data only captures symptomatic
Model structure: additional components infections.
The third challenge is to correctly build the model struc- Bertuzzo et al. [12] took into account asymptomatic
ture. There are debates in the literature as to the essen- infection when they compared their simulation results
tial components of a model that successfully replicate to the observed cumulative incidence curve, including
observed cholera dynamics. These are tied to our under- an underreporting scaling factor (See Additional file 1),
standing in biology and epidemiology as to the relative but chose not to distinguish asymptomatic infections
importance of certain features of the cholera life cycle or from symptomatic infections in the mathematical model
its epidemiology. The basic model can be modified to structure. Other modelers believe that these are import-
take these elements into account. In this section, we ant elements and incorporated into their model a com-
focus on two issues: (1) asymptomatic, or ‘inapparent’, partment for asymptomatic individuals whose bacterial
infections, and (2) hyperinfectious bacteria and human- shedding rate are lower than that of symptomatic indi-
to-human transmission. viduals (60% - 90% of infected individuals being asymp-
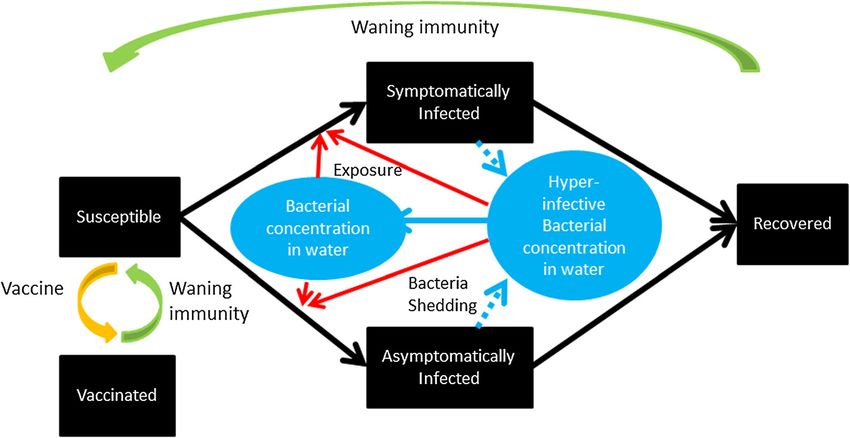
tomatic as in ref. [11], see Figure 5), less infectious than
Asymptomatic infection symptomatic individuals (e.g. 10% of the infectiousness
There was a debate with regard to the relative import- of symptomatic individuals as assumed in ref. [9]), and
ance of asymptomatic infection to transmission dynam- with a lower cholera-related death rate and faster recov-
ics [30]. As noted by Grad et al. [18], the basic model ery rate (as in ref. [24]). Chao et al. [9] found that their
assumes that throughout an epidemic, there is a con- results were sensitive to the fraction of infected people
stant ratio of asymptomatic to symptomatic infections, who became symptomatic. The higher the symptomatic
and that the infectious dose “determines the likelihood proportion, the higher was the incidence of reported
of infection, but not the likelihood of being symptom- cases. Others proposed that ‘inapparent’ infections may
atic” [18]. However, the volume of bacteria shedding is prove to be like a vaccine, through which people ac-
likely very different: A person with severe cholera shed a quire immunity against cholera [6]. This idea is consist-
lot more stool than that shed by an asymptomatically in- ent with experimental data from a volunteer challenge
fected person. Rate of diarrhea for severe cholera cases study [33].Fung Emerging Themes in Epidemiology 2014, 11:1 Page 8 of 11
http://www.ete-online.com/content/11/1/1
Figure 5 Hyperinfectious bacteria and asymptomatic infection (adapted from Andrews and Basu, 2011 [11]) note: The “Vaccinated”
compartment refers to successfully vaccinated individuals who become immune.
The key to the debate in ref. [30] was how would we freshly shed by humans, but such properties would dis-
explain the rapid reduction of the effective reproduction appear after 24 hours in the in vitro environment [36]. It
number in the first few months of the Haitian outbreak. has also been demonstrated that growth in a biofilm in-
Underreporting of cases, including asymptomatic cases, duces a hyperinfectious phenotype of V. cholerae [37].
should be taken into account when fitting modeling out- This was the basis of the hypothesis that freshly shed V.
puts to observed data (even if the model does not have a cholerae existed in a hyperinfectious state for less than
distinct compartment for asymptomatic cases). Nonethe- one day and that they contributed to cholera transmission
less, the reduction in effective reproduction number dur- more than we previously expected. These implied that a
ing the first three months of the epidemic cannot be so-called “human-to-human” transmission route played an
solely explained by the depletion of susceptible individ- important role than the environmental, “water-borne”
uals through infection, as the surge in incidence in June route [38].
and July 2011 (see Figure 1 of ref. [34]) would be diffi- Some modelers argue that these hyperinfectious bacteria
cult to explain. (For details of the debate and our com- hold the key to our understanding of cholera transmission
ments, see Additional file 1). dynamics (e.g. refs. [7,11]) (Figure 5). They include in their
models a separate compartment for these hyperinfectious
Hyperinfectious bacteria and “human-to-human” bacteria with a very high infectiousness (a higher β). These
transmission bacteria will leave their hyperinfectious state and become
The second issue is how important hyperinfectious V. normal within a day (Table 4). However, Pascual et al. [39]
cholerae are to the transmission process. A decade ago, rightly argued that the extra compartment is redundant
Merrell et al. [35] discovered that freshly shed V. cho- for most purposes unless the specific question in mind is
lerae were much more infectious than those that were to study the hyperinfective state. Therefore, for the sake of
grown in-vitro. However, these hyperinfectious bacteria parsimony, “human-to-human” transmission is seen by
would lose their hyperinfectiousness once they were some as a good proxy for the impact of hyperinfectious
cultured in vitro in broth for 18 hours. Later, researchers bacteria, as in refs. [10,40,41] (Figure 6; see Additional file
demonstrated that mouse-passaged V. cholerae also dem- 1 for details). With their very brief period of existence, the
onstrated similar hyperinfectious properties as those impact of hyperinfectious bacteria is the greatest upon
Table 4 Parameters for hyperinfectious bacteria as found in selected published mathematical models (adapted from
Grad et al., 2012 [18])
Parameter Andrews and Hartley Chao et al. Original empirical data sources cited
Basu [11] et al. [7] [9] by authors
Multiplier for infectiousness of freshly shed vibrio 50 700 100 [35,36]
(hyperinfectious state)
Duration of hyperinfective state (hours) 24 5 24 [35,36]
For further discussion on these parameter values, please refer to the Additional file 1.Fung Emerging Themes in Epidemiology 2014, 11:1 Page 9 of 11
http://www.ete-online.com/content/11/1/1
Figure 6 “Human-to-human” infection incorporated into the basic model.
family members who live under the same roof and share Control and Prevention (CDC) made use of Abrams
the same water source. This is consistent with observa- et al.’s model [43] to inform policy-makers (that model will
tions in a cholera outbreak that family contacts of an be further discussed in the Additional file 1). In the future,
index case had a higher risk of getting infected [42]. we can cross-validate models for both their model struc-
Therefore, Chao et al. limited “human-to-human” trans- ture and parameters against various historical epidemio-
mission to transmission within a household in their logical datasets, and then use the validated models for
model [9]. outbreak response. In some outbreak scenarios, seasonal-
To model “human-to-human” transmission is challen- ity can be omitted from the model, as only a short time
ging in two aspects. Firstly, the relative magnitude of the frame is needed. Elements of spatial heterogeneity can be
transmission coefficient (“contact” rate) of “human-to- included if relevant data are readily available. Modeling
human” transmission to waterborne transmission is un- packages that use models of relatively few parameters and
certain (See Table 4 and the Additional file 1). Secondly, variables can be created and made readily available before
to correctly capture the impact of interventions upon the next outbreak. At the beginning of an outbreak when
“human-to-human” transmission is not easy. Take for data are limited, field epidemiologists and policy-makers
example, in Tuite et al.’s model [10], the relative reduc- (for example, Epidemic Intelligence Service officers and
tion in total cases by “equal allocation of clean water” their superiors in the CDC) who are not trained in math-
was much smaller than that by an “optimized allocation ematical modeling can deploy such models to provide
of vaccine”. The major reason was that Tuite et al. as- estimates of attack rates (cumulative incidence) and inter-
sumed that clean water provision stopped waterborne vention effects in different scenarios. The model inputs
transmission but not “human-to-human” transmission. will either be provided for by the model as default (ob-
However, clean water provision may, in fact, reduce the tained from historical data in the literature) or require
“human-to-human” transmission. Cholera is transmitted users’ inputs (as estimated based on limited data at the be-
via the oral-fecal route. The hyperinfectious state only ginning of an outbreak). To facilitate its use in developing
makes the necessary infectious dose (or the IC50) much countries, the use of software that requires expensive
lower. Given that the “human-to-human” transmission is licenses can be avoided. Free software like R is a good al-
only a mathematical proxy of the impact of the hyperin- ternative. Many public health practitioners find the avail-
fectious bacteria, clean water provision should have an ability of a user-friendly Graphical User Interface helpful.
impact on human-to-human transmission, even if it may One example is to use Excel as the user’s interface to an
not stop transmission completely. executable file compiled from a C++ code, as in the influ-
enza model Community Flu 2.0 that is available on CDC
Moving forward website [44].
Our research questions dictate our choice of models. The second direction is cholera control in endemic
For the purpose of public health practice and policy- contexts. First, the elucidation of the drivers of, and their
making, we propose the following two directions for fu- effects upon, seasonal patterns of cholera incidence, and
ture development of cholera models. the effect of population and hydraulic movements upon
The first direction is emergency preparedness and re- spatial heterogeneity of incidence, will help epidemiolo-
sponse for cholera outbreaks. During the early phase of gists predict future outbreaks (some of the related
the Haitian epidemic in 2010, the US Centers for Disease models are briefly discussed in the Additional file 1).Fung Emerging Themes in Epidemiology 2014, 11:1 Page 10 of 11
http://www.ete-online.com/content/11/1/1
Second, the estimation of the long-term effects on chol- 3. Mukandavire Z, Liao S, Wang J, Gaff H, Smith DL, Morris JG Jr: Estimating
era incidence and the return on investment of long-term the reproductive numbers for the 2008–2009 cholera outbreaks in
Zimbabwe. Proc Natl Acad Sci U S A 2011, 108:8767–8772.
infrastructure building and intervention programs will 4. Mukandavire Z, Smith DL, Morris JG Jr: Cholera in Haiti: reproductive
be valuable to policy-makers. Complementary to this numbers and vaccination coverage estimates. Sci Rep 2013, 3:997.
modeling effort, we will need to collect better data for 5. Rinaldo A, Bertuzzo E, Mari L, Righetto L, Blokesch M, Gatto M, Casagrandi R,
Murray M, Vesenbeckh SM, Rodriguez-Iturbe I: Reassessment of the
intervention effectiveness (including indirect effect) and 2010–2011 Haiti cholera outbreak and rainfall-driven multiseason
costs. projections. Proc Natl Acad Sci U S A 2012, 109:6602–6607.
6. King AA, Ionides EL, Pascual M, Bouma MJ: Inapparent infections and
cholera dynamics. Nature 2008, 454:877–880.
Conclusion 7. Hartley DM, Morris JG Jr, Smith DL: Hyperinfectivity: a critical element in
Dynamic transmission models of cholera have been devel- the ability of V. Cholerae to cause epidemics? PLoS Med 2006, 3:e7.
8. Tien JH, Earn DJ: Multiple transmission pathways and disease dynamics
oped very rapidly in recent years, especially after the 2010 in a waterborne pathogen model. Bull Math Biol 2010, 72:1506–1533.
Haitian outbreak. Many models have been published but 9. Chao DL, Halloran ME, Longini IM Jr: Vaccination strategies for epidemic
few make any impact on decision-makers and field epi- cholera in Haiti with implications for the developing world. Proc Natl
Acad Sci U S A 2011, 108:7081–7085.
demiologists. This paper provides an introduction to the 10. Tuite AR, Tien J, Eisenberg M, Earn DJ, Ma J, Fisman DN: Cholera epidemic
basics of ordinary differential equation models of cholera in Haiti, 2010: using a transmission model to explain spatial spread of
transmission dynamics, in the hope that the usefulness of disease and identify optimal control interventions. Ann Intern Med 2011,
154:593–601.
modeling in public health research and decision-making 11. Andrews JR, Basu S: Transmission dynamics and control of cholera in
may be better appreciated. Field epidemiologists are cru- Haiti: an epidemic model. Lancet 2011, 377:1248–1255.
cial in the partnership with modelers as they provide ac- 12. Bertuzzo E, Mari L, Righetto L, Gatto M, Casagrandi R, Blokesch M,
Rodriguez-Iturbe I, Rinaldo A: Prediction of the spatial evolution and
tual data that help parameterize the models. Model-driven effects of control measures for the unfolding Haiti cholera outbreak.
data collection and data-driven model construction are Geophys Res Lett 2011, 38, L06403.
equally important. Likewise, policy makers that are 13. Chao DL, Longini IM Jr, Morris JG Jr: Modeling cholera outbreaks.
Curr Top Microbiol Immunol 2013. In press.
well-informed with the assumptions and implications of 14. Cummings DAT, Lessler J: Infectious disease dynamics. In Infectious Disease
mathematical models and the data that are used to Epidemiology. Edited by Nelson KE, Masters Williams C. Burlington, MA:
parameterize them, will be able to use mathematical Jones & Bartlett Learning; 2013.
15. Vynnycky E, White RG: An introduction to Infectious Disease Modelling.
modeling studies to facilitate their decision-making.
Oxford: Oxford University Press; 2010.
More collaboration between policy makers, epidemiolo- 16. Anderson RM, May RM: Infectious Diseases of Humans: Dynamics and Control.
gists and modelers is needed if we want to make pro- Oxford: Oxford University Press; 1991.
gress in controlling cholera in Haiti and beyond. 17. Keeling MJ, Rohani P: Modeling Infectious Diseases in Humans and Animals.
Princeton University Press: Princeton; 2008.
18. Grad YH, Miller JC, Lipsitch M: Cholera modeling: challenges to
quantitative analysis and predicting the impact of interventions.
Additional file Epidemiology 2012, 23:523–530.
19. Codeco CT: Endemic and epidemic dynamics of cholera: the role of the
Additional file 1: Online Supplementary Materials. aquatic reservoir. BMC Infect Dis 2001, 1:1.
20. Mossong J, Hens N, Jit M, Beutels P, Auranen K, Mikolajczyk R, Massari M,
Salmaso S, Tomba GS, Wallinga J, et al: Social contacts and mixing
Competing interests patterns relevant to the spread of infectious diseases. PLoS Med 2008,
The authors declare that they have no competing interests. 5:e74.
21. Eisenberg MC, Robertson SL, Tien JH: Identifiability and estimation of
Acknowledgements multiple transmission pathways in cholera and waterborne disease.
The author thanks Mr. Joseph Abrams, Dr. Bishwa Adhikari, Dr. David L. Fitter, J Theor Biol 2013, 324:84–102.
Dr. Manoj Gambhir, Dr. John Glasser, Dr. Andrew J. Leidner, Dr. Martin I. 22. Guerrant RL, Carneiro-Filho BA, Dillingham RA: Cholera, diarrhea, and oral
Meltzer, Dr. Eric Mintz, Dr. Scott Santibanez, Dr. Zhisheng Shuai, Dr. Jordan rehydration therapy: triumph and indictment. Clin Infect Dis 2003,
Tappero and the anonymous reviewers for their comments on some of the 37:398–405.
early versions of this manuscript. 23. Heymann DL: Control of Communicable Diseases Manual. 19th edition.
Washington DC: American Public Health Association; 2008.
24. Miller Neilan RL, Schaefer E, Gaff H, Fister KR, Lenhart S: Modeling optimal
Disclaimer intervention strategies for cholera. Bull Math Biol 2010, 72:2004–2018.
The findings and conclusions expressed in this report do not necessarily 25. Mwasa A, Tchuenche JM: Mathematical analysis of a cholera model with
represent the official position of the Centers for Disease Control and public health interventions. Biosystems 2011, 105:190–200.
Prevention. 26. Sur D, Kanungo S, Sah B, Manna B, Ali M, Paisley AM, Niyogi SK, Park JK,
Sarkar B, Puri MK, et al: Efficacy of a low-cost, inactivated whole-cell oral
Received: 9 May 2013 Accepted: 22 January 2014 cholera vaccine: results from 3 years of follow-up of a randomized,
Published: 12 February 2014 controlled trial. PLoS Negl Trop Dis 2011, 5:e1289.
27. Sur D, Lopez AL, Kanungo S, Paisley A, Manna B, Ali M, Niyogi SK, Park JK,
References Sarkar B, Puri MK, et al: Efficacy and safety of a modified killed-whole-cell
1. Harris JB, LaRocque RC, Qadri F, Ryan ET, Calderwood SB: Cholera. Lancet oral cholera vaccine in India: an interim analysis of a cluster-randomised,
2012, 379:2466–2476. double-blind, placebo-controlled trial. Lancet 2009, 374:1694–1702.
2. Tappero JW, Tauxe RV: Lessons learned during public health response to 28. Ali M, Emch M, von Seidlein L, Yunus M, Sack DA, Rao M, Holmgren J,
cholera epidemic in Haiti and the Dominican Republic. Emerg Infect Dis Clemens JD: Herd immunity conferred by killed oral cholera vaccines in
2011, 17:2087–2093. Bangladesh: a reanalysis. Lancet 2005, 366:44–49.Fung Emerging Themes in Epidemiology 2014, 11:1 Page 11 of 11
http://www.ete-online.com/content/11/1/1
29. Bhattacharya SK, Sur D, Ali M, Kanungo S, You YA, Manna B, Sah B, Niyogi
SK, Park JK, Sarkar B, et al: 5 year efficacy of a bivalent killed whole-cell
oral cholera vaccine in Kolkata, India: a cluster-randomised, double-
blind, placebo-controlled trial. Lancet Infect Dis 2013, 13:1050–1056.
30. Rinaldo A, Blokesch M, Bertuzzo E, Mari L, Righetto L, Murray M, Gatto M,
Casagrandi R, Rodriguez-Iturbe I: A transmission model of the 2010 cholera
epidemic in Haiti. Ann Intern Med 2011, 155:403–404. author reply 404.
31. Sack DA, Sack RB, Nair GB, Siddique AK: Cholera. Lancet 2004, 363:223–233.
32. Nelson EJ, Harris JB, Morris JG Jr, Calderwood SB, Camilli A: Cholera
transmission: the host, pathogen and bacteriophage dynamic. Nat Rev
Microbiol 2009, 7:693–702.
33. Cash RA, Music SI, Libonati JP, Craig JP, Pierce NF, Hornick RB: Response of
man to infection with vibrio cholerae. II. Protection from illness afforded
by previous disease and vaccine. J Infect Dis 1974, 130:325–333.
34. Barzilay EJ, Schaad N, Magloire R, Mung KS, Boncy J, Dahourou GA, Mintz
ED, Steenland MW, Vertefeuille JF, Tappero JW: Cholera surveillance during
the Haiti epidemic–the first 2 years. N Engl J Med 2013, 368:599–609.
35. Merrell DS, Butler SM, Qadri F, Dolganov NA, Alam A, Cohen MB,
Calderwood SB, Schoolnik GK, Camilli A: Host-induced epidemic spread of
the cholera bacterium. Nature 2002, 417:642–645.
36. Alam A, Larocque RC, Harris JB, Vanderspurt C, Ryan ET, Qadri F, Calderwood
SB: Hyperinfectivity of human-passaged vibrio cholerae can be modeled by
growth in the infant mouse. Infect Immun 2005, 73:6674–6679.
37. Tamayo R, Patimalla B, Camilli A: Growth in a biofilm induces a
hyperinfectious phenotype in vibrio cholerae. Infect Immun 2010,
78:3560–3569.
38. Codeco CT, Coelho FC: Trends in cholera epidemiology. PLoS Med 2006,
3:e42.
39. Pascual M, Koelle K, Dobson AP: Hyperinfectivity in cholera: a new
mechanism for an old epidemiological model? PLoS Med 2006, 3:e280.
40. Koelle K, Pascual M: Disentangling extrinsic from intrinsic factors in
disease dynamics: a nonlinear time series approach with an application
to cholera. Am Nat 2004, 163:901–913.
41. Koelle K, Rodo X, Pascual M, Yunus M, Mostafa G: Refractory periods and
climate forcing in cholera dynamics. Nature 2005, 436:696–700.
42. Cans C: An epidemic of cholera in the city of Pemba (Mozambique) in
1983. Rev Epidemiol Sante Publique 1986, 34:419–426.
43. Abrams JY, Copeland JR, Tauxe RV, Date KA, Belay ED, Mody RK, Mintz ED:
Real-time modelling used for outbreak management during a cholera
epidemic, Haiti, 2010–2011. Epidemiol Infect 2013, 141:1276–1285.
44. Community Flu 2.0. http://www.cdc.gov/flu/pandemic-resources/tools/
communityflu.htm.
doi:10.1186/1742-7622-11-1
Cite this article as: Fung: Cholera transmission dynamic models for
public health practitioners. Emerging Themes in Epidemiology 2014 11:1.
Submit your next manuscript to BioMed Central
and take full advantage of:
• Convenient online submission
• Thorough peer review
• No space constraints or color figure charges
• Immediate publication on acceptance
• Inclusion in PubMed, CAS, Scopus and Google Scholar
• Research which is freely available for redistribution
Submit your manuscript at
www.biomedcentral.com/submitYou can also read


