Chromatin and epigenetics - cross-journal focus EMBO Molecular Medicine - EMBO Press
←
→
Page content transcription
If your browser does not render page correctly, please read the page content below
EMBO
             Molecular
             Medicine

cross-journal focus

Chromatin and
epigenetics
cross-journal focus

Chromatin and
epigenetics
EDITORS
                                      Esther Schnapp
                                      Senior Editor
                                      esther.schnapp@embo.org | T +49 6221 8891 502
                                      Esther joined EMBO reports in October 2008. She was awarded her PhD in 2005 at the Max Planck
                                      Institute for Molecular Cell Biology and Genetics in Dresden, Germany, where she studied tail
                                      regeneration in the axolotl. As a post-doc she worked on muscle development in zebrafish and on
                                      the characterisation of mesoangioblasts at the Stem Cell Research Institute of the San Raffaele
                                      Hospital in Milan, Italy.

                                      Anne Nielsen
                                      Editor
                                      a.nielsen@embojournal.org | T +49 6221 8891 408
                                      Anne received her PhD from Aarhus University in 2008 for work on miRNA processing in Joergen
                                      Kjems’ lab. As a postdoc she then went on to join Javier Martinez’ lab at IMBA in Vienna and focused
                                      on siRNA-binding proteins and non-conventional splicing in the unfolded protein response. Anne
                                      joined The EMBO Journal in 2012.

                                      Maria Polychronidou
                                      Editor
                                      maria.polychronidou@embo.org | T +49 6221 8891 410
                                      Maria received her PhD from the University of Heidelberg, where she studied the role of nuclear
                                      membrane proteins in development and aging. During her post-doctoral work, she focused on the
                                      analysis of tissue-specific regulatory functions of Hox transcription factors using a combination
                                      of computational and genome-wide methods.

                                      Céline Carret
                                      Editor
                                      c.carret@embomolmed.org | T +49 6221 8891 310
                                      Céline Carret completed her PhD at the University of Montpellier, France, characterising host
                                      immunodominant antigens to fight babesiosis, a parasitic disease caused by a unicellular
        EMBO                          Apicomplexan parasite closely related to the malaria agent Plasmodium. She further developed
        Molecular                     her post-doctoral career on malaria working at the Wellcome Trust Sanger Institute in Cambridge,
        Medicine                      UK and Instituto de Medicina Molecular in Lisbon, Portugal. Céline joined EMBO Molecular
                                      Medicine as a Scientific Editor in March 2011.

emboj.embopress.org   |   embor.embopress.org           |          embomolmed.embopress.org                  |          msb.embopress.org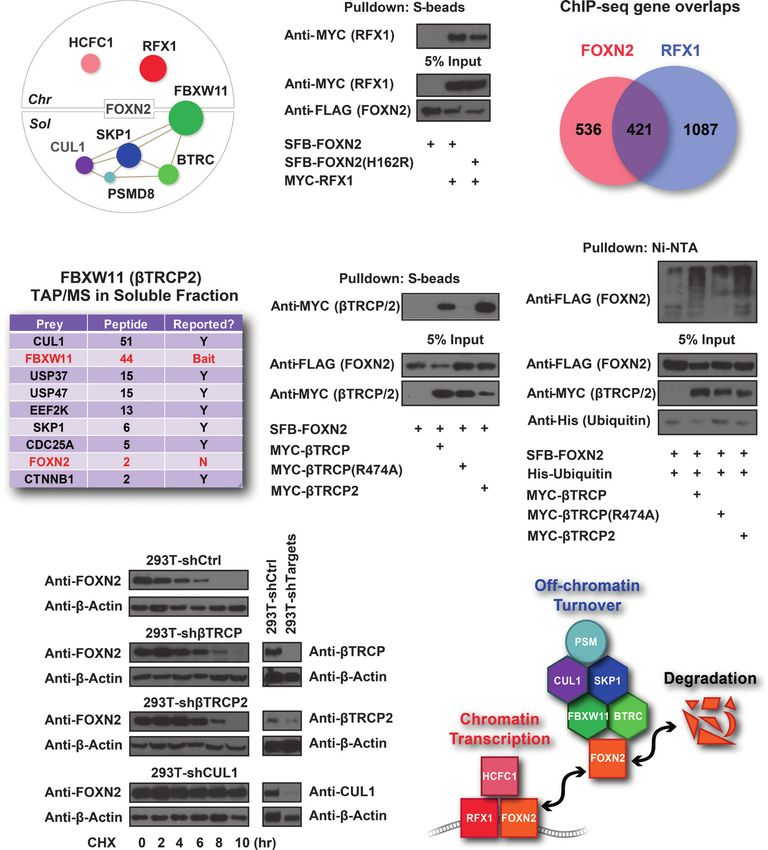
full articles
EMBO Reports
Epigenetic predisposition to reprogramming fates in
somatic cells
EMBO reports (2015) Epub ahead of print
Pour M, Pilzer I, Rosner R, Smith ZD, Meissner A, Nachman I.
DOI 10.15252/embr.201439264 | Published online 19.01.2015
The EMBO Journal
Dynamics of genomic H3K27me3 domains and role of EZH2
during pancreatic endocrine specification
The EMBO Journal (2014) 33, 2157-2170
Cheng-Ran Xu, Lin-Chen Li, Greg Donahue, Lei Ying, Yu-Wei Zhang, Paul Gadue,
Kenneth S Zaret
DOI 10.15252/embj.201488671 | Published online 08.08.2014
EMBO Molecular Medicine
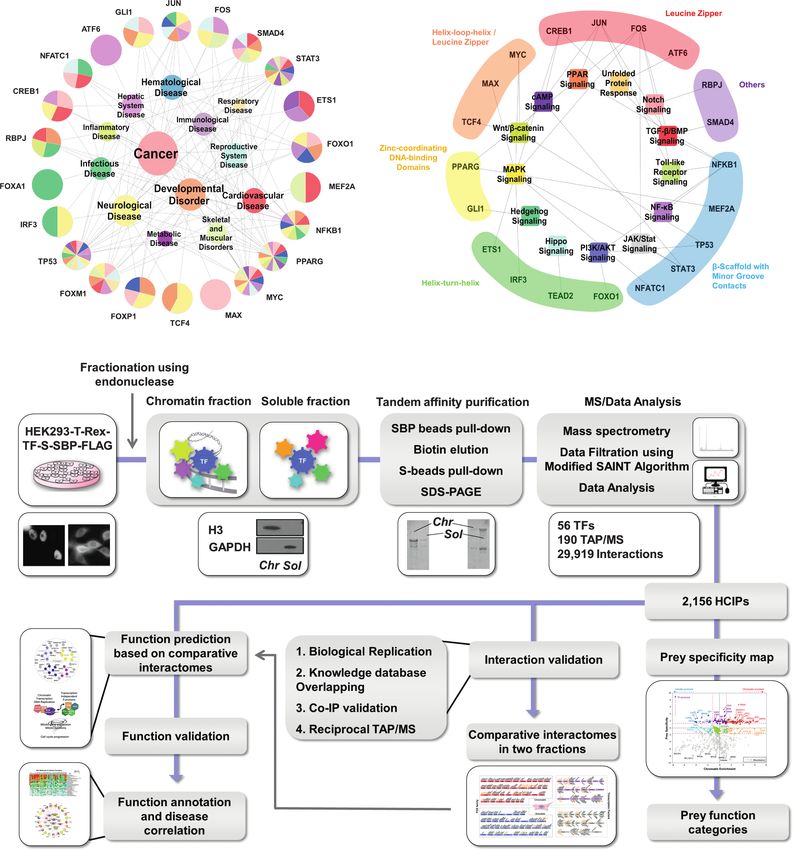
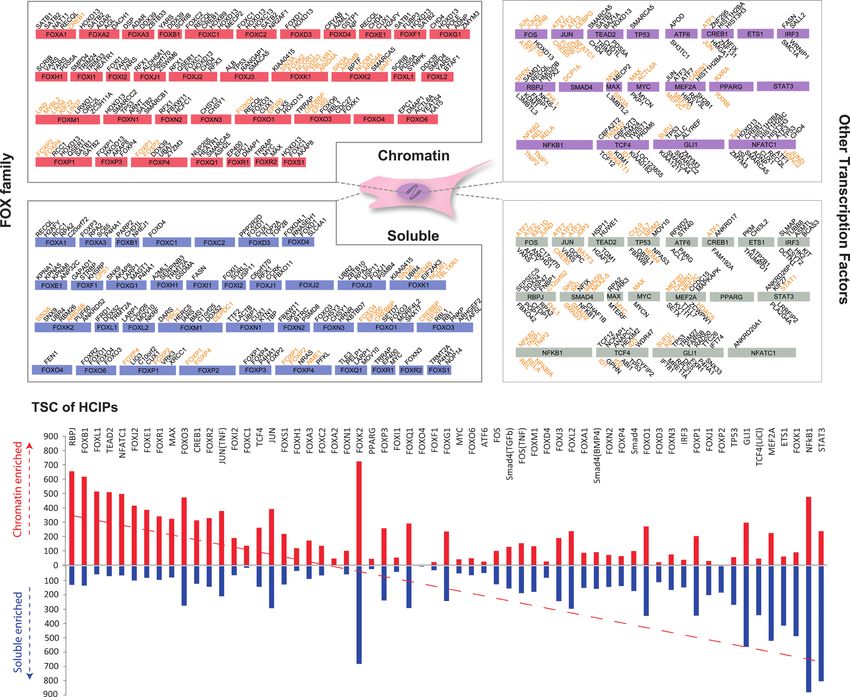
Proteomic analyses reveal distinct chromatin-associated
and soluble transcription factor complexes
Molecular Systems Biology (2015) 11: 775
Li X, Wang W, Wang J, Malovannaya A, Xi Y, Li W, Guerra R, Hawke DH, Qin J, Chen J
DOI 10.15252/msb.20145504
For further reading please see inside back cover
108306-CG-EMBO-ChromatinReprint-Text.indb 3 16/03/2015 15:22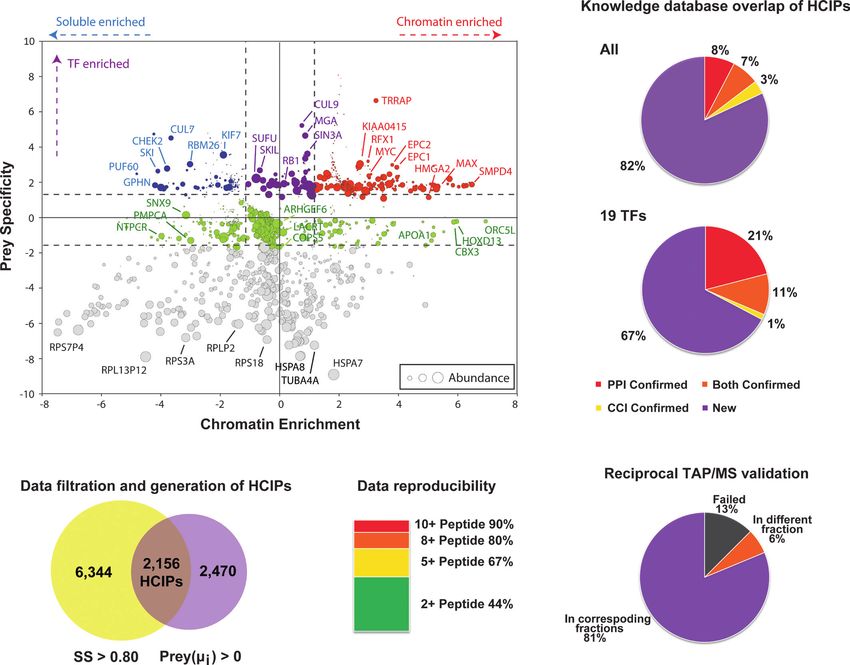
108306-CG-EMBO-ChromatinReprint-Text.indb 4 16/03/2015 15:22
Scientific Report

           Epigenetic predisposition to reprogramming fates
           in somatic cells
           Maayan Pour1,†, Inbar Pilzer1,†, Roni Rosner1, Zachary D Smith2, Alexander Meissner2 &
           Iftach Nachman1,*

           Abstract                                                                             by widespread epigenetic changes that generate induced pluripotent
                                                                                                stem cells (iPSCs) with the functional and molecular characteristics of
           Reprogramming to pluripotency is a low-efficiency process at                         embryonic stem cells (ESCs) derived from the early embryo [3,5–9].
           the population level. Despite notable advances to molecularly                        Generation of iPS cells is a robust and highly reproducible proce-
           characterize key steps, several fundamental aspects remain poorly                    dure, yet it is exceedingly inefficient at the per-cell level and
           understood, including when the potential to reprogram is first                       requires an extended latency before autonomous pluripotency is
           established. Here, we apply live-cell imaging combined with a                        acquired [10]. Different models have been suggested to explain
           novel statistical approach to infer when somatic cells become                        these two notable attributes [11]. On one extreme, a fully stochastic
           fated to generate downstream pluripotent progeny. By tracing cell                    model suggests that every cell division essentially constitutes a coin
           lineages from several divisions before factor induction through to                   toss in which the cell ‘decides’ whether or not to reprogram. In this
           pluripotent colony formation, we find that pre-induction sister                      model, all cells are equally likely to reprogram at any time after
           cells acquire similar outcomes. Namely, if one daughter cell                         factors have been induced, independent of their history prior to the
           contributes to a lineage that generates induced pluripotent stem                     time of induction. On the other extreme, a deterministic ‘elite’
           cells (iPSCs), its paired sibling will as well. This result suggests that            model posits that the initial cell population contains a subpopula-
           the potential to reprogram is predetermined within a select                          tion that is predisposed or fated to successfully reprogram. Experi-
           subpopulation of cells and heritable, at least over the short term.                  mental work designed to test these models have offered different
           We also find that expanding cells over several divisions prior to                    perspectives that vary between these two extremes. For instance,
           factor induction does not increase the per-lineage likelihood of                     low-frequency stochastic reprogramming is inherent to any continu-
           successful reprogramming, nor is reprogramming fate correlated                       ously proliferating lineage given enough time and cellular divisions
           to neighboring cell identity or cell-specific reprogramming factor                   [12]. We have previously described an early decision point after
           levels. By perturbing the epigenetic state of somatic populations                    which the trajectory to successful reprogramming becomes defined,
           with Ezh2 inhibitors prior to factor induction, we successfully                      suggesting that the initial response to factor induction may deter-
           modulate the fraction of iPSC-forming lineages. Our results there-                   mine the downstream trajectory [13]. By sampling single-cell tran-
           fore suggest that reprogramming potential may in part reflect                        scription over the reprogramming timeline, high cell-to-cell
           preexisting epigenetic heterogeneity that can be tuned to alter the                  variability in gene expression was found to describe early repro-
           cellular response to factor induction.                                               gramming, after which a deterministic hierarchical phase is acquired
                                                                                                [14]. Finally, a recent study suggested that only select subpopula-
           Keywords cell fate decisions; live-cell imaging; reprogramming                       tions of granulocyte–monocyte progenitors can reprogram, and do
           Subject Category Stem Cells                                                          so with higher efficiency, while the majority of cells remain intransi-
           DOI 10.15252/embr.201439264 | Received 3 July 2014 | Revised 11 December             gent [15].
           2014 | Accepted 12 December 2014 | Published online 19 January 2015                     To investigate this in more detail, we used a live imaging
           EMBO Reports (2014) 16: 370–378                                                      approach to characterize key decision points and contributing
                                                                                                factors during the reprogramming process. We find evidence
                                                                                                suggesting that the potential to reprogram is largely pre-established
           Introduction                                                                         within somatic cells before reprogramming factors are induced. We
                                                                                                show that responding cells differ in their pre-induction properties
           Somatic cells can be reprogrammed to a pluripotent state by overex-                  from non-responding ones and that perturbing the epigenetic state
           pression of defined transcription factors, Oct4, Sox2, Klf4, and                     of the somatic population prior to reprogramming can alter the
           c-Myc (OSKM) [1–4]. The reprogramming process is characterized                       potential of single cells to generate iPSC-forming lineages. Our

           1 Department of Biochemistry and Molecular Biology, Tel Aviv University, Tel Aviv, Israel
           2 Department of Stem Cell and Regenerative Biology, Harvard University, Cambridge, MA, USA
             *Corresponding author. Tel: +972 3 640 5900; E-mail: iftachn@post.tau.ac.il
             †
              These authors contributed equally to this work

     370       EMBO reports Vol 16 | No 3 | 2015                                                                                                      ª 2015 The Authors

108306-CG-EMBO-ChromatinReprint-Text.indb 5                                                                                                                         16/03/2015 15:22
Maayan Pour et al        Epigenetic predisposition to reprogramming fates                                                             EMBO reports

          findings emphasize the relevance of preexisting cell-to-cell variabil-      will be within the dynamic range (i.e., lower than 96 wells) to
          ity in reprogramming, expanding prior studies that pointed to the           precisely measure per-cell efficiency. As it has been reported that
          early stages following factor induction as critical to the final            reprogramming potential in fibroblasts is diminished by progressive
          outcome. These observations will eventually lead to a better molec-         passaging [18], we separately tested reprogramming efficiency in
          ular definition of cellular state that includes a given cell’s potential    cells that were expanded for 5 days before being replated and
          to respond to transcriptional perturbation and has implications to          induced by OSKM (Supplementary Text S1, Supplementary Fig S1).
          other processes beyond reprogramming to pluripotency.                       We found no effect for the 5-day expansion period, ruling out a
                                                                                      possible confounding effect of reduced efficiency due to a later
                                                                                      generation.
          Results                                                                         We first calculated the reprogramming efficiency using plates in
                                                                                      which dox was applied on day 0 (with no delay, Fig 1A, top). In
          We employed the NGFP2 MEF secondary reprogramming system,                   these plates, the starting cell number and the number on the day of
          where all somatic cells contain identical integrations of OSKM              induction are trivially the same, so the estimated efficiency would
          factors under doxycycline (dox)-inducible promoters [13,16], and            be applicable to both models. By computing the fraction of positive
          therefore, phenotypic variability must be non-genetic in origin. In         wells for a certain starting number, the standard efficiency can be
          all experiments, we focused on colonies generated within a                  easily calculated (Fig 1B, blue). After verifying that reprogramming
          2-week reprogramming timeline to concentrate on the initial wave            efficiency does not depend on the location of the well on the plate
          of iPSC colony formation, which is generally more defined than              (Supplementary Fig S2), we determined the ‘standard failure rate’
          colonies that emerge later [12, 13]. To assist in cell lineage track-       parameter, which represents the probability that a cell does not
          ing, we transduced the MEFs with lentiviral vectors that constitu-          produce any reprogrammed progeny, to be 0.989  0.004 (maximum-
          tively express fluorescent proteins prior to reprogramming to               likelihood estimator, see Supplementary Text S2), consistent with
          create populations of uniquely labeled cells. To minimize effi-             previous lineage normalized estimates using this system [13]. A
          ciency calculation errors resulting from previously described satel-        similar efficiency was obtained using labeled subpopulations within
          lite colonies that emanate from primary reprogramming lineages              a standard cell density (Supplementary Fig S3), verifying the low
          [13] and do not represent de novo acquisition of pluripotency, we           density in this experiment does not affect efficiency.
          used a colony-counting method which is estimated exclusively                    We next estimated the efficiency in wells where the addition of
          from colonies that can be traced back to the original fibroblast            dox followed a 5-day expansion period of our restricted starting cell
          (see Materials and Methods).                                                populations (Fig 1A, bottom). To increase the distinction between
                                                                                      the two tested models, we only used wells that at least doubled their
          Cells are predisposed to major cell fate decisions before                   cell number between the two counts (n = 71 wells). We estimated
          factor induction                                                            the failure rate parameter separately according to starting cell count
                                                                                      (0.990  0.002) or count at time of dox (0.996  0.001) using boot-
          To determine when the potential to successfully generate iPSC colo-         strap sampling over a maximum-likelihood estimator (see Supple-
          nies is established, we devised a strategy inspired by the Luria–           mentary Text S2). The failure rate parameter according to starting
          Delbrück experiment. The original experiment demonstrated that             cell count is closer to the standard failure rate parameter computed
          acquisition of resistance through mutation precedes selection by            above, where the number of reprogramming lineages matches the
          employing a pre-growth period prior to screening for mutants [17].          number of cells at the time of induction. In fact, the efficiency as
          In our version, we begin with a known number of MEFs and allow              estimated from the number of cells at the time of induction (‘+ dox
          them to divide several times prior to factor induction, increasing the      count’) is 2.5-fold lower than expected if the likelihood of repro-
          number of cells per well while holding the number of lineages               gramming were stochastically distributed to all cells equally at that
          constant (Fig 1A). If the potential to reprogram is largely predeter-       time (Fig 1C). To visualize the reprogramming efficiency according
          mined, the fraction of iPSC containing wells will depend on the             to each model, we divided the 71 wells to 6 groups of 10–13 wells,
          initial population size, assuming that the potential is inherited in        where each group has a similar initial cell count (Supplementary
          daughter cells over the short term. In a post-determined model,             Table S1), and plotted the average efficiency for each group accord-
          reprogramming will depend only on the number of cells at the time           ing to either initial count or dox-day count (Fig 1B). Efficiency as a
          of induction, increasing the fraction of iPSC containing wells as a         function of starting cell number (Fig 1B, red) is closer to the day 0
          function of population number.                                              ‘scaling points’ (Fig 1B, blue) than the efficiency as a function of
              We seeded cells at different low densities in 96-well plates            cell number at time of induction (Fig 1B, green). This suggests that
          (n = 17) and initiated reprogramming after 0 days (13 plates) or            starting cell count (day 0) is a better predictor of reprogramming
          5 days (4 plates), counting the exact number of cells in each well          efficiency than the number of cells at the time of induction, favoring
          both at the day of plating and at the time of OSKM induction. After         a predetermined per-lineage model over any post-determined model,
          2 weeks, we assessed the fraction of wells containing iPSC-marker-          including a fully stochastic one. To rule out the possibility that a
          positive colonies and inferred the per-cell efficiency (Materials and       higher local density after 5 days could reduce the per-cell exposure
          Methods). By counting wells rather than colonies, we avoid inaccu-          to dox, or deleteriously bias reprogramming in any way, we specifi-
          rate scoring of satellite colonies as unique reprogramming events           cally disrupted cellular position within each well by brief trypsiniza-
          when estimating efficiency [13]. Given an expected reprogramming            tion prior to factor induction, resulting in no effect on the apparent
          efficiency of 1% for our system, we seeded only a small number of           lineage dependence of reprogramming outcome (Supplementary
          cells per well (10–100) to ensure that the fraction containing iPSCs        Fig S4).

          ª 2015 The Authors                                                                                                EMBO reports Vol 16 | No 3 | 2015      371             3

108306-CG-EMBO-ChromatinReprint-Text.indb 6                                                                                                                     16/03/2015 15:22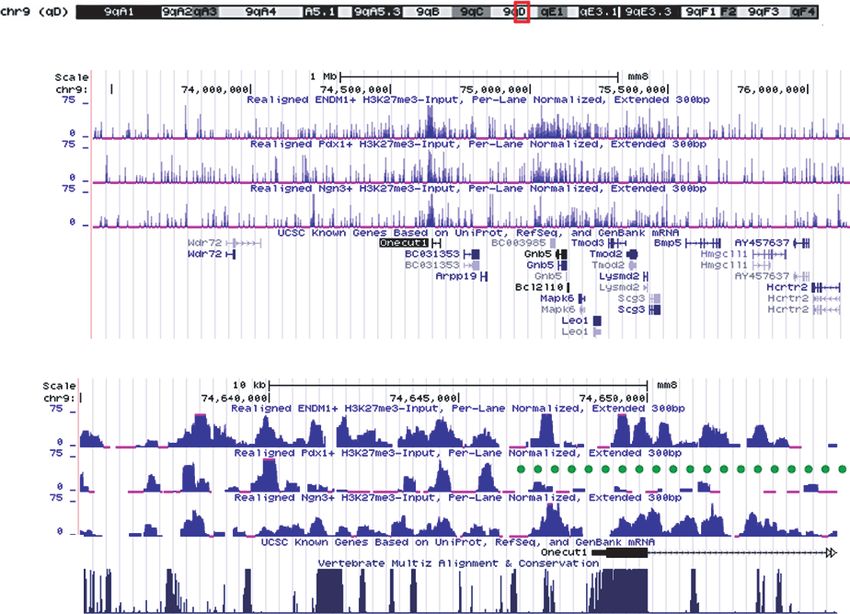
EMBO reports Epigenetic predisposition to reprogramming fates Maayan Pour et al
A + Dox
14 days
Cell count Positive well count
Initial day dependent
+ Dox
OR
5 days 14 days
+Dox day dependent
Initial +Dox
Cell count Cell count
B C
Standard, = 0.989 ± 0.004
Fraction iPSC positive wells
1.5%
Initial count, = 0.990 ± 0.002
+Dox count, = 0.996 ± 0.001 Efficiency
0.6 1.0%
0.5%
0.4.
St
In
+D
0.2. iti
an
ox
al
da
co
co
rd
un
un
0
t
t
0 20 40 60 80 100 120
Cells per well
Figure 1. The potential to reprogram is determined prior to factor induction.
A Schematic of the Luria–Delbrück inspired experiment. Doxycycline (dox) was administered after either no delay or 5 days following plating. Cells in each well were
counted both after plating and at dox induction. The number of GFP+ wells at the end of 14 days was used to distinguish between different potential acquisition
models (see text).
B Reprogramming efficiencies measured as fraction of wells with GFP+ colonies as a function of cells per well. Dark blue mark denotes mean and standard deviation
of one 96-well plate experiment where dox was administered immediately after plating. Red and green marks denote wells that were induced to reprogram 5 days
after plating binned according to their cell number as demonstrated in Supplementary Table S1. For each group: red mark, initial cell count; green mark, cell
count at day of dox induction. A pair of marks with the same y-value corresponds to the same group of wells. The dashed box highlights the specific wells
exemplified in Supplementary Table S1. The solid curve of each color represents the theoretical efficiency for the corresponding reprogramming probability
parameter, calculated as the maximum-likelihood estimator according to each data set separately (see Supplementary Text S2). The data are based on two
independent experiments.
C Reprogramming efficiency parameters corresponding to the three models shown in (B). Error bars represent standard deviation computed using sample bootstrapping
(see Supplementary Text S2). Efficiency computed from initial count is more similar to the standard than that computed from count at day of dox induction.
Predetermined potential is symmetrically maintained over secondary MEFs. Cells were tracked from 2 days before induction of
the short term reprogramming. After the first division, prior to dox induction, two
sister cells were tagged as paired lineages. We designated the fate of
The results above suggest the potential to reprogram is determined each cellular lineage into one of three categories: iPSC (Nanog-
before OSKM induction, with limited acquired potential generated GFP+ forming), fast dividers (FD, Nanog-GFP-, indicative of trans-
during ensuing divisions. However, we do not know how the poten- formation without reprogramming), and non-responder (NR, which
tial is inherited within the lineage or how stable it is. For example, it do not acquire rapid proliferation or exhibit overt changes in fibro-
could be restricted in sequential steps along the lineage, similar to blast morphology, see Materials and Methods for full definitions).
fate restriction during early development. Alternatively, it could be We then independently assigned these fates to both lineages within
equally inherited during each cell division. A third option is that a pair to examine the possible combinations between them (Fig 2A).
cells within the potentiated lineage interconvert between ‘amenable’ Notably, in each of the pairs examined, the two lineages adopted
and ‘recalcitrant’ states. To better understand how reprogramming the same fate (Fig 2B, Supplementary Movie S1). We prospectively
potential is restricted and to validate the point of its appearance, we counted 58 pairs of FD-FD lineages, 6 pairs of iPS-iPS lineages, and
analyzed the fate statistics of lineage pairs of fluorescently labeled 79 pairs of NR-NR lineages. We did not observe any pair of lineages
1 372 EMBO reports Vol 16 | No 3 | 2015 ª 2015 The Authors
108306-CG-EMBO-ChromatinReprint-Text.indb 7 16/03/2015 15:22
Maayan Pour et al Epigenetic predisposition to reprogramming fates EMBO reports
acquiring mixed fates (such as iPS-FD, where only one of the decide to proliferate in response to OSKM, and only as a second
lineages contributes to iPSC and the other is transformed). Repeat- decision may proliferating cells acquire full reprogramming poten-
ing the same experiment at a higher cell density resulted in similar tial (Fig 2C). The time of acquiring each of these potentials would
within-pair correlations, verifying the effect is not density dependent be reflected statistically within our lineage pair counts. A model in
(Supplementary Fig S5). which cells acquire the potential to proliferate (shared between
We used these lineage pair counts to rule out different models iPSC and FD fates) only after the first division can be ruled out by
in which potential is acquired or lost after the first division. For computing a P-value of iPSC and FD versus NR lineage pairs,
example, by taking the observed counts of all 6 possible paired which represents the probability of getting the observed count or
lineage combinations for the three fates (FD, NR, or iPSC), we can higher of same-fate lineage pairs from our data compared to an
reject a model in which cells ‘decide’ their fate after the initial alternate random pairing model. Given random pairing, if potential
division (here, the term decision refers to gain or loss of a fate is acquired independently after the initial division, the observed
potential). It is possible, however, that multiple fate decisions may combinations of pairs (in this case NR-NR, NR-FD/iPS, or FD/iPS-
occur within discrete steps. For example, cells may or may not FD/iPS) will follow a random distribution (see Supplementary
Text S3). A model in which proliferative cells acquire or lose
A reprogramming potential after the initial division can also be ruled
iPSC potential
+Dox
out by computing the P-value for which our FD versus iPSC lineage
iPSC potential data reflect the random acquisition of FD-FD, FD-iPS, and iPS-iPS
pairs. Using our empirical paired lineage counts, we can reject all
three of these models at high significance (Fig 2D, top). Repeating
B the same analysis for pairs resulting from the second observed
division resulted in similar statistics (Fig 2D, bottom), suggesting
Pre-Induction
fate potential is maintained (not gained or lost) over at least two
divisions. Pairs from later divisions are harder to track, but some
loss (or partial fulfillment) of fate potential in parts of the sub-
d -2 , 0 5 :2 0 h r s d -2 , 0 8 :0 0 h r s d -2 , 1 0 :4 0 h r s d -2 , 1 8 :4 0 h r s d -1 , 0 2 :4 0 h r s
lineages is observed (Fig 2B, Supplementary Movie S1).
The apparent predisposition toward different reprogramming
+ Dox
fates suggests there are different internal states in the somatic cell
population, which may be reflected by other cellular properties.
d 0 d 2 , 1 2 :0 0 h r s d 4 ,1 8 :0 0 h r s d 1 3 , 1 5 :0 0 h r s d 1 4 ,0 6 :0 0 h r s We first tested whether the proliferation rate of the cells prior to
induction correlates with their response to reprogramming by
C
Proliferation decision point: Reprogramming decision point:
Figure 2. Response potential is shared between daughter cells during
NR NR NR FD\ iPSC FD \ iPSC FD \ iPSC FD FD FD iPSC iPSC iPSC early divisions.
D First division: A Schematic of the ‘paired lineage’ concept, depicting the last cell division
Number of pairs observed prior to induction of OSKM (black arrow). The paired lineages can be
Model P-value
FD-FD iPSC-iPSC FD-iPSC NR-NR FD-NR iPSC-NR classified into three categories with respect to when the potential to
Prolifera�on and reprogramming 58 6 0 79 0 0 8.8E-52
Prolifera�on decision point 64 79 0 2.8E-43 become an iPSC is obtained: potential may be acquired before the first
Reprogramming decision point 58 6 0 - - - 3.2E-09 division and both sub-lineages will include iPSC colony forming events
Second division: (left); potential may be acquired in one sub-lineage (or lost in its sibling
Number of pairs observed lineage) after the first division, resulting in two different fates (center); or
Model P-value
FD-FD iPSC-iPSC FD-iPSC NR-NR FD-NR iPSC-NR
Prolifera�on and reprogramming 19 6 0 11 0 0 4.89E-16 no potential is acquired over the timeline (right). Green color denotes a
Prolifera�on decision point 25 11 0 3.35E-10
sub-lineage that will form iPSCs.
Reprogramming decision point 19 6 0 - - - 1.46E-06
B Snapshots from imaging a cell lineage originating from a single MEF where
the first cell division occurred 8 h after imaging. From that division on, the
E 500 paired lineages (marked red and green) were traced. After 18:40 h, the green
Pre-Induction + Dox
lineage divided again and its sub-lineages were tracked separately. Dox was
(prior to induction)
added at day 0. The final GFP+ colonies are composed of cells from different
Last division
30
sub-lineages (see also Supplementary Movie S1). Scale bar, 500 lm.
20 C Possible paired lineage outcomes for two different decision points under a
Cell number
model assuming sequential acquisition of proliferation and reprogramming
10 potentials. Left: possible pairs given the point of obtaining the potential for
fast proliferation (marked by an arrow). Right: possible pairs given the point
0 of obtaining the potential for reprogramming, assuming the cell already
has fast proliferation potential.
last division
Second to
10 D Counts of tracked lineage pairs from the 1st or 2nd division with each
corresponding fate combination. No mixed-fate pairs (e.g., iPS-FD) were
20
observed. P-values are shown for each post-division fate decision model as
0 10 20 30 40 50 60 described in text, rejecting all three post-division decision models.
No Divisions
Time (hours) E Division times during the 48 h that cells were tracked before initiating
reprogramming, grouped according to their response as proliferating (either
iPSC or FD, blue) and non-responding (NR, red) lineages. The ‘no division’
bar represents cells that did not divide prior to dox induction.
ª 2015 The Authors EMBO reports Vol 16 | No 3 | 2015 373 3
108306-CG-EMBO-ChromatinReprint-Text.indb 8 16/03/2015 15:22
EMBO reports                                                             Epigenetic predisposition to reprogramming fates      Maayan Pour et al

               marking the number of divisions in each lineage during the 48 h           mesenchymal to epithelial transition (MET) occurs early during
               prior to OSKM induction (Fig 2E). While proliferating cells of            reprogramming [19, 20]. Replating during this phase may disturb
               either the iPSC or FD fates could not be distinguished in this            MET mechanically and consequently perturb downstream events.
               manner, both are likely to divide more times before induction than        To study the effect of replating in isolation, we repeated the experi-
               non-responding cells. Most responding cells divide at least twice         ment differently by plating over empty or feeder-covered wells. We
               during this period, while the majority of NR cells do not divide at       estimated final colony counts for different replating days (2–12) as
               all during the same period of time, and about 10% of them divide          well as time of colony appearance after replating (Supplementary
               once. Thus, while division rate may distinguish between senes-            Fig S6). Replating early in the process (days 2–4) resulted in both
               cence-prone cells and proliferative cells, it cannot sufficiently         marked delay in appearance of colonies and lower number of final
               predict whether responding cells will successfully navigate to pluri-     iPSC colonies compared to the non-replated case. Alternatively,
               potency or simply acquire features associated with transformation.        replating during the later stages of the process (days 8–12) resulted
               While we cannot rule out that the source of proliferation rate            in increasingly higher number of iPSC colonies that form with mini-
               heterogeneity present in MEFs prior to factor induction could be          mal delay after replating, suggesting that by this stage, iPSC-forming
               effected by a mosaically represented genetic component, previous          cells are more likely to maintain their route. For these later time
               evidence converting non-responding to reprogramming cells by              points, replating may increase colony number as a trivial reflection
               Mbd3 inhibition suggest these differences can be altered                  of multiple iPSC-fated cells from each iPSC lineage being spatially
               epigenetically [3].                                                       distributed to different positions [14].
                                                                                             The per-cell expression level of the OSKM factors represents an
               Reprogramming potential is independent of local neighborhood              ectopically induced cue that could also affect reprogramming poten-
               and of early OSKM levels                                                  tial. Despite the clonal origin of our secondary system, differential
                                                                                         activation within single cells is possible. Different epigenetic states
               What are the mechanisms that predetermine a cell’s response               at sequence features of the lentiviral vectors could affect factor
               during the reprogramming process and what enables a predisposed           induction from their Tet-responsive promoters and lead to different
               lineage to realize this potential? One option is that environmental       fates in a simple way. For example, OSKM level could positively
               cues—such as reinforcing signals coming from neighboring cells—           correlate to reprogramming outcome, and previous reports have
               affect the future fate of the colonies. As cells within a lineage         shown that refractory reprogramming lineages with low factor
               reside in close proximity to one another, they could respond simi-        expression can be rescued by elevating OKSM levels [21]. We found
               larly as a consequence of a shared local environment. Support             that OKSM levels are much higher in the NGFP2 inducible system
               from neighboring cells should be reflected by some preferential           than in the polycistronic OKSM cells used in Polo et al and that
               relative locations of future iPSC lineages to a specific type of          efficiency is not increased by additional supplementation (Supple-
               lineage. To test this possibility, we examine the distribution of         mentary Fig S7). To test whether the different behaviors are caused
               distances between starting cells in a reprogramming experiment            by different nuclear concentrations of the factors early in the repro-
               (Fig 3A) and how it statistically depends on the final fates of their     gramming process, we examined the correlation between OSKM
               progeny. We observed no significant difference between the                protein levels and the behavior of cells after induction. After 2 days
               distance distributions of iPSC to FD, iPSC to NR, or FD to FD             of reprogramming, cells undergo consistent changes in morphology,
               progenitors (Fig 3B), suggesting the relative location of starting        usually resulting in a decrease in cell size [13] as well as nucleus
               cells does not affect their future fate. However, the reprogramming       size (Supplementary Fig S8). Using this behavior, we can distin-
               lineage itself could also supply a self-supportive local niche, which     guish cells that respond positively to factor induction (FD/iPSC)
               supports identical fates within each pair of sub-lineages. To tempo-      from those that do not. We stained reprogramming cells on days 0,
               rarily remove the possible effect of lineage niche, we replated a         2, 4, and 6 days after induction using antibodies against OSKM. We
               CFP-labeled population of reprogramming MEFs at specific time             indeed observe a variable level for each of the factors from day 2
               points onto YFP-labeled cells reprogrammed in parallel (Fig 3C). In       onward, but found no negative correlation between nucleus size
               this system, reprogramming CFP cells are isolated from their              and the level of fluorescence (Fig 3F, Supplementary Fig S9).
               original spatial niche, which includes both their lineage mates and       Together, these results suggest that the variable response to repro-
               neighboring lineages, and are randomly distributed among YFP              gramming is not due to obvious differences in OSKM factor levels at
               lineages of different fates. After replating of the CFP cells, we         early stages.
               followed the lineages for an additional 10–14 days and annotated
               the terminal fate of both CFP and YFP lineages. We then computed          Perturbing H3K27 or H3K4 methylation pre-induction alters
               the distribution of distances between different lineage types (Fig 3D     future lineage fates
               and E). At both early (days 2–6) or late (days 8–12) replating time
               points, we could not find any spatial effect—the distance distribu-       With exogenous explanations for these fated responses discounted,
               tions between all lineage types are similar. These results suggest        we hypothesized that differences in reprogramming potential may
               that though signals from other colonies in the well may provide           be epigenetic in origin and reflect innate differences in nuclear state.
               supportive and essential signals for successful reprogramming,            Discrete MEF responses may be a consequence of different chroma-
               the local proximity to specific neighboring lineages does not             tin states, either global or at the level of specific genes, that could
               distinguish between different lineage fates.                              permit constructive factor engagement at target sites upon their
                   It is possible that cell replating during the course of reprogram-    induction. Perturbation of chromatin modifiers has been extensively
               ming can disrupt the process. For example, it has been shown that a       screened over the reprogramming process itself, some targets of

3        374      EMBO reports Vol 16 | No 3 | 2015                                                                                             ª 2015 The Authors

    108306-CG-EMBO-ChromatinReprint-Text.indb 9                                                                                                               16/03/2015 15:22
Maayan Pour et al Epigenetic predisposition to reprogramming fates EMBO reports
A B A -2 -1 0 Reprogramming 14 Days
4 FD to FD
Pairs of cells (fraction)
0.12 FD to NR
3 6 NR to NR 48hr dose
FD to iPSC 24hr dose
NR to iPSC
1 9 iPSC to iPSC Inhibitor duration + Dox
2 all to all
5 0.06
10 B
7 8
12
NGFP+ colonies
10
C 0
8
0 1 2 3 4
Distance (mm) 6
Days
+Dox D 4
2
Pairs of colonies (fraction)
2 iPSC-C to iPSC-Y 0
0.15 all-C to all-Y
JQ
JQ
D
D
Az
G
VP
R
LS
D
U
iPSC-C to all-Y
zn
zn
G
M
nt
9a
a
A
D
10
EZ
EZ
SO
re
e
e
-i
1-
all-C to all-C
C
p,
p,
at
8
00
00
i
ed
4
2
5,
5,
8h
4h
0.10
48
24
r
r
4
hr
hr
0.05
C Mixed
FD-FD 5% FD-FD
0
6 0 1 2 3 11% 19%
Distance (mm) iPSC-iPSC iPSC-iPSC
E 6%
NR-NR
3%
NR-NR
78% 78%
Pairs of olonies (fraction)
8 iPSC-C to iPSC-Y
0.15 all-C to all-Y
iPSC-C to all-Y
all-C to all-C
0.10 D Ezh2 inhibitor Untreated
10 + Dox + Dox
Mixed
0.05
iPSC-iPSC
0
12 0 1 2 3 FD-FD
Distance (mm)
NR-NR
F
intensity (A.U.)
0.02 0 20 40 60 80 0 20 40 60 80
c-Myc Klf4 Oct4 Sox2 Inhibitor Time (Hours)
Median
0.01 duration
00 1 20 1 20 1 20 1 2 Figure 4. Reducing H3K27 or increasing H3K4 methylation prior to OSKM
Nucleus area (x10 µm )
3 2
induction increases per-lineage reprogramming potential.
A Schematic of inhibitors experiment. Inhibitors were added during the 48 h
preceding dox induction, for either 24 or 48 h.
Figure 3. Reprogramming fate is not influenced by local signaling from
B Effect of pre-treatment with different inhibitors on reprogramming
neighbor lineages or by OSKM levels.
efficiency. Shown are mean and standard deviation for imaged colony counts
A, B All cells in a standard reprogramming experiment were annotated by over 6 replicate wells (see counting procedure in Materials and Methods).
final lineage fate, and distances between them at the time of induction C Fraction of lineage pairs with each corresponding fate combination after
were computed. Sample frame (A) at day 0 with 10 annotated cells. Scale transient Ezh2 inhibition in the somatic population (left) or after no
bar, 100 lm. Histograms of cell-to-cell distances (B) between cells with treatment (right, taken from Fig 2).
different terminal fates show no significant relationship between D Time of first division for the different lineage pairs under Ezh2 pre-dox
proximity and outcome. inhibition (left) or no treatment (right).
C Schematic of replating experiments. CFP- and YFP-labeled MEF cells
were reprogrammed separately and in parallel. At specific time points
within the 2nd to 12th day of reprogramming, CFP-labeled cells were
replated onto stage-matched YFP cells. Scale bar, 200 lm. induction, if they alter the cell’s epigenome in a manner that
D, E Histograms of distances between colonies of various fates replated after changes its predisposition to reprogram. To test this hypothesis, we
days 2–6 (D) or 8–12 (E). iPSC-C, iPSC-Y: CFP- or YFP-labeled iPSC colony,
subjected our secondary system to a panel of drugs that affect epige-
respectively; all-C, all-Y: CFP- or YFP-labeled colony of any type,
respectively. The similarity between all distance distributions shows that netic modifications for either 24 or 48 h during the 2 days that
there is no preference for the relative location of iPSC colonies. precede factor induction (Fig 4A). We compared the NGFP+ colony
F Correlation between the level of each factor on day 2 of reprogramming count at day 14 to an untreated control. Of the drugs tested, both
and morphological response. Plots show size of nuclear immunostaining
Lsd1 and Ezh2 inhibitors showed the most significant increase in
signal for a given factor within induced cells against their median
fluorescence intensity. efficiency, increasing the number of Nanog-positive colonies ~3-fold
compared to DMSO-treated and untreated controls (Fig 4B). Ezh2 is
a histone methyltransferase that catalyzes repressive H3K27 methyl-
which contribute to population level effects in reprogramming ation [24] (Supplementary Fig S10), while Lsd1 is a histone demeth-
efficiency [3,19,22,23]. Our findings suggest that such treatments ylase removing H3K4 mono- and di-methylation [25]. Subsequently,
could also be effective when limited to a period preceding OSKM inhibition of either may result in a permissive chromatin state that
ª 2015 The Authors EMBO reports Vol 16 | No 3 | 2015 375 3
108306-CG-EMBO-ChromatinReprint-Text.indb 10 16/03/2015 15:22EMBO reports Epigenetic predisposition to reprogramming fates Maayan Pour et al
could enable otherwise recalcitrant cells to switch to a reprogram- during reprogramming, based on high cell-to-cell variability in
ming amenable state. expression of specific genes in the same inducible system as the
We further studied the effect of Ezh2 inhibitor pre-treatment on current study [14]. Our results suggest that this variability may stem
reprogramming. We hypothesized that Ezh2 inhibition could from preexisting differences in cell states, rather than stochastic
improve reprogramming by several different mechanisms: it could switching between different states after reprogramming is initiated
alter the number of reprogramming amenable MEFs, enable down- [26]. Stochastic steps leading to potential loss or realization within
stream stochastic fate switching, or simply amplify predisposed each iPSC lineage may still occur at later divisions, but the likelihood
lineages, such that the final colony count is higher but the per-cell of realization has to be high enough such that each pair member
efficiency would be unchanged. To distinguish between these contributes to iPSC colonies within the allotted time window. The
options, we repeated our ‘paired lineage’ experiment on cells treated results imply that some predictive early marker could be identified
with the Ezh2 inhibitor during the 2-day window where cell lineages and potentially used to isolate cells that will respond positively to
are traced prior to dox induction. We reasoned that a delayed factor induction. Our efforts to see whether Thy1 [21], a fibroblast
stochastic switch would enable the appearance of mixed pairs (e.g., specific marker heterogeneously present in the MEF population, can
FD-iPS), which would result in only one of the branches acquiring be used as such a marker indicate that Thy1 expression at day 0 is
reprogramming potential. Alternatively, if all lineage pairs remain not predictive of lineage fate (Supplementary Fig S11). The stability
symmetrical in terms of their fates, as was observed in the untreated of the transcriptional state may only be one marker for a cell’s
case, but with a higher fraction of pairs becoming iPSCs, then Ezh2 response, while other relevant characteristics could include the pres-
inhibition acts to increase the number of amenable cells within the ence of supportive (or the absence of deleterious) cofactors or the
population. Under the third scenario, the same number of lineages epigenetic configuration of target enhancer sequences. Genetic vari-
would reprogram, but would divide faster during the treatment ants in the starting MEF population could also contribute to a cell’s
period, creating more colonies of a secondary nature that increase potential to reprogram. However, efforts to characterize specific
the efficiency estimate artifactually. Supplementary Movie S2 shows genetic variation within iPSC colonies generated from fibroblast pools
a representative 16-day time lapse with lineage tracking for one have found only very rare instances of overrepresented polymor-
such well. 27% of the wells (19/71) generated iPSC colonies, phisms [27], suggesting that genetic contributions to this process
compared to 11% (11/96) in the no-treatment experiment (Fig 2), would fall below the overall frequency of ~1% that we observe for
consistent with the global efficiency calculated during our screen fibroblasts that successfully reprogram over our time course.
(Fig 4B). Our data indicate the effect of Ezh2 inhibition is not on Our spatial dependence analysis shows no substantial contribu-
proliferation. Instead, the distribution of pair types (Fig 4C) suggests tion from the local niche, in terms of signaling from neighboring
the majority of additional iPSC pairs may come from converted FD cells, to the final lineage fate. This suggests paired lineages do not
pairs. Though the majority of pairs we followed were still symmetri- adopt similar fates because of local ‘nurturing’ external effects but
cal, about 10% (10/98) were asymmetrical (4 NR-iPS pairs and 6 rather because of internal cell state. Additionally, the differential
NR-FD pairs). These results suggest the Ezh2 inhibitor treatment effect in colony formation between early and late replating during
increases the number of cells that generate iPSC-forming lineages, reprogramming suggests that from around day 6, cells are less prone
with some asymmetric lineage pairs between proliferative and non- to disturbance in their route to an iPSC fate, even though molecular
proliferative fates possibly reflecting some cytotoxic effect. We markers associated with complete reprogramming have not yet been
compared the time of first division (that generates each pair) activated.
between Ezh2 inhibition and no pre-treatment conditions (Fig 4D). Effects of epigenetic perturbations on reprogramming efficiency
The treatment appears to delay division time, causing a significant have been demonstrated previously [3,22]. Here, we show that such
fraction of cells to divide for the first time only after OSKM induction. a perturbation of H3K27 methylation through Ezh2 inhibition can
Interestingly, all mixed pairs divide early during the treatment period, change reprogramming potential by altering cellular state prior to
while their following divisions occur mostly after dox induction and factor induction. Furthermore, the shift in fates adopted by inhibitor
drug withdrawal (not shown). These pairs were exposed to Ezh2 treated cells suggests that the difference in potential may be chroma-
inhibition for a longer period as individual cells than symmetrically tin-related, consistent with recent results where a major barrier to
fated pairs, allowing more time for the treatment to act differentially reprogramming is how transcription factors modify target chromatin
on isolated daughter cells, possibly allowing modulation between once engaged [3]. Ezh2 inhibition increased the total number of
different responses. iPSC-forming lineages at the expense of ‘fast dividers’, the other
continuously proliferating response to factor induction, and not of
senescence-prone ‘non-responding’ fates, contrary to other methods
Discussion of improving reprogramming efficiency that act by altering the
population of dividing cells only [12,18]. Paired lineages with mixed
Our main results show that reprogramming potential is inherent to fates also arose solely under inhibitor treatment, but usually for
somatic cells prior to factor induction and that this potential is cells that divided early during dosage, and as such spent more time
shared between a pair of lineages originating from the same pre- under treatment as separate cells. This suggests an asymmetry
induced progenitor cell. These data suggest that reprogramming either in the cumulative effect of Ezh2 inhibition on sister cells, or
potential is set at least several divisions before induction and is heri- in the sisters’ internal states after division. All mixed-lineage pairs
table in the short term. Consistently, we do not find any effect of are between either iPSC- or FD-forming lineages and senescent non-
local signaling from neighboring lineages on the fate adopted by responders, and never between alternate proliferating fates. As
cells. Recently, an early stochastic phase was proposed to exist such, they may represent compounding effects between drug
5 376 EMBO reports Vol 16 | No 3 | 2015 ª 2015 The Authors
108306-CG-EMBO-ChromatinReprint-Text.indb 11 16/03/2015 15:22Maayan Pour et al Epigenetic predisposition to reprogramming fates EMBO reports
toxicity and the oncogenic stress of OSKM induction. Finally, the connected 6 × 6 or 7 × 7 spatial range at 10× magnification in up to
effect of Ezh2 inhibition is likely not mediated through a change three fluorescent wavelengths and phase contrast using NIS Elements
in OSKM levels, as these levels are unaltered by the inhibitor software. Acquisitions were taken every 2–4 h for 14–18 days.
(Supplementary Fig S12).
Characterizing the molecular events that prescribe successful Image analysis
reprogramming is challenged by the low efficiency and extended
latency of the process. As such, most studies have generally relied Tracking cell divisions during the first few generations, as well as
on inferences from static population sampling or via lineage tracing tracking lineage dynamics at later generations, was done manually
with a limited number of reporters. The methodology we present using ImageJ. Cell segmentation was done using CellProfiler [29]. Cell
here seeks to address fundamental aspects of reprogramming counting as well as final colonies counting was done automatically
lineages with minimal preconceived assumptions about the exact using CellProfiler and verified manually. In replating experiments,
molecular mechanisms in play. This strategy may be used to track CFP and YFP colony identification was done using CellProfiler. iPSC-
decision time points along other complex cellular lineages where positive colonies were determined by coordinate comparison with the
little is known, such as in vitro differentiation or cancer progression. red channel, containing the Nanog staining data.
Using live imaging and statistical analysis, we show that reprogram-
ming potential in MEFs is preset and can be manipulated epigeneti- Cell fate classification
cally. With a greater understanding of the key determinants through
which reprogramming lineages are first established, future experi- Cells were traced from 2 days before dox induction. All cells, at first
ments may be designed to identify the underlying mechanisms that division, if occurred during that 48 h period, were segmented as
enable somatic cells to change fates in a directed fashion. paired lineages. All lineages as well as cells that did not divide
during that time were traced to their final fates. Final fate of a cell or a
lineage was assigned to one of three categories: (1) non-responder
Materials and Methods (NR)—cells that did not divide at all after dox induction or divide
slowly prior to death or senescence within 4 days of induction; (2)
Cell culture fast dividers (FD—can also be referred to as partly reprogrammed
cells)—cells that divide quickly after dox induction, creating a spread
Secondary Nanog-GFP (NGFP2) MEFs derived from isolated E13.5 out lineage with morphological features of fibroblasts, and do not
doxycycline-inducible murine fibroblasts as previously described [1] survive after switching into N2B27 medium (day 12) or do not stain
and cultured in ES cell medium, DMEM (Invitrogen) supplemented for E-cadherin and Nanog. A lineage is classified FD only if it yields
with 15% FBS, L-glutamine, penicillin–streptomycin, nonessential no iPSC colonies; and (3) IPSC—cells that divide to form a condensed
amino acids (Biological Industries), b-mercaptoethanol (Sigma), colony that resolves to a clear Nanog-GFP positive colony after
and 1,000 U/ml leukemia inhibitory factor (LIF, Millipore). All switching into N2B27 + LIF + 2i conditions at the end of the experi-
experiments were conducted after three passages from isolation. mental time course. These colonies are confirmed by positive staining
Collagen-OKSM-Oct4-EGFP MEFs [28] were grown in the same for E-cadherin and Nanog (for some experiments, alkaline phospha-
conditions as the NGFP2 MEFs. tase activity was also measured). A lineage is classified as iPSC if it
yields any iPSC colony, even if some cells within the subsequent
Reprogramming and image acquisition lineage are FD.
Nanog-GFP (YFP, or H2B-Cerulean labeled)-inducible MEFs were Pre-treatment with chromatin modifiers inhibitors
plated on gelatin-coated 24-well, 12-well, and 6-well plates
(TC-treated polystyrene plate) at a density of 5,000, 10,000, and Ezh2 methyltransferase was inhibited with two different inhibitors:
20,000 cells per well, respectively. In 96-well plates, cells were 3-deazaneplanocin A (DZNep, Sigma, 5 lM) which inhibits the
seeded on feeder cells, either at low densities of 30–200 cells per expression of Ezh2, and JQ EZ005, an Ezh2 inhibitor that was kindly
well, or at high density, mixing 20–40 CFP-labeled cells with 1,000 provided by J. Bradner. Each inhibitor was added to ES medium at
YFP-labeled cells per well, as denoted in the text. Imaging started concentration of 5 lM. Other chromatin modifiers tested included
about 16 h after plating. Cells were cultured under serum starvation the LSD1 inhibitor RN-1 (Millipore, 0.01–1 lM), the DNA methyl-
conditions (0.5% FBS) for ~16 h before switching into standard transferase inhibitors RG108 (Cayman chemical, 10 lM), and
mouse ES medium supplemented with 2 lg/ml doxycycline (Sigma) 5-azacytidine (Sigma, 2 lM), the histone deacetylase inhibitor
for all experiments to ensure all traced lineages began reprogramming valproic acid (VPA, Sigma, 1 mM) and the G9a inhibitor BIX01294
from G1. Cells were kept on doxycycline for the duration of all imaging (Stemgent, 1 lM). Effects of these inhibitors on reprogramming effi-
experiments. Growth medium (supplemented with dox) was replaced ciency were measured against untreated and vehicle treated (0.1%
every 24–48 h. On day 12, the medium was switched to DMSO, Sigma) controls. Cells were grown and plated for experiment
N2B27 + LIF + 2i + dox medium, containing neurobasal medium, as described above. During the 2 days before dox induction, cells
DMEM/F12, B27, BSA (Invitrogen), Ndiff (Millipore), 3 lM CHIR were treated with either inhibitors for 2 different time periods (see
99021 (Biovision), 1 lM PD0325901 (Santa Cruz). After 14 days, cells Fig 4A). The concentration and duration of treatment was calibrated
were fixed and immunostained against pluripotency markers. Induc- to identify conditions that maintain viability, enhance reprogram-
ible MEFs were imaged using a Nikon TiE epi-fluorescence microscope ming, and aberrate their target epigenetic modification as deter-
equipped with a motorized XY stage (Prior) and taken within a mined by immunofluorescence or taken from the literature.
ª 2015 The Authors EMBO reports Vol 16 | No 3 | 2015 377 3
108306-CG-EMBO-ChromatinReprint-Text.indb 12 16/03/2015 15:22EMBO reports Epigenetic predisposition to reprogramming fates Maayan Pour et al
Additional experimental methods as well as description of colony 13. Smith ZD, Nachman I, Regev A, Meissner A (2010) Dynamic single-cell
counting are provided in the Supplementary Materials and Methods. imaging of direct reprogramming reveals an early specifying event. Nat
Full description of the statistical methods employed is given in the Biotechnol 28: 521 – 526
Supplementary Information. 14. Buganim Y, Faddah DA, Cheng AW, Itskovich E, Markoulaki S, Ganz K,
Klemm SL, van Oudenaarden A, Jaenisch R (2012) Single-cell expression
Supplementary information for this article is available online: analyses during cellular reprogramming reveal an early stochastic and a
http://embor.embopress.org late hierarchic phase. Cell 150: 1209 – 1222
15. Guo S, Zi X, Schulz VP, Cheng J, Zhong M, Koochaki SH, Megyola CM,
Acknowledgements Pan X, Heydari K, Weissman SM et al (2014) Nonstochastic reprogram-
We thank J. Bradner for contributing an Ezh2 inhibitor and C. Sindhu for help ming from a privileged somatic cell state. Cell 156: 649 – 662
with cell sorting. This study was supported in part by the Human Frontiers 16. Wernig M, Lengner CJ, Hanna J, Lodato MA, Steine E, Foreman R, Staerk
Scientific Program (HFSP RGY0080/2011), the Binational Science Foundation J, Markoulaki S, Jaenisch R (2008) A drug-inducible transgenic system
(BSF 2009403), and the Edmond J. Safra Center for Bioinformatics at Tel Aviv for direct reprogramming of multiple somatic cell types. Nat Biotechnol
University. 26: 916 – 924
17. Luria SE, Delbrück M (1943) Mutations of bacteria from virus sensitivity
Author contributions to virus resistance. Genetics 28: 491 – 511
MP, IP, ZDS, AM, and IN conceived or designed the experiments. MP and IP 18. Utikal J, Polo JM, Stadtfeld M, Maherali N, Kulalert W, Walsh RM,
performed the experiments. MP and RR analyzed the data. MP, IP, ZDS, AM, Khalil A, Rheinwald JG, Hochedlinger K (2009) Immortalization
and IN wrote the manuscript. eliminates a roadblock during cellular reprogramming into iPS cells.
Nature 460: 1145 – 1148
Conflict of interest 19. Samavarchi-Tehrani P, Golipour A, David L, Sung HK, Beyer TA, Datti A,
The authors declare that they have no conflict of interest. Woltjen K, Nagy A, Wrana JL (2010) Functional genomics reveals a BMP-
driven mesenchymal-to-epithelial transition in the initiation of somatic
cell reprogramming. Cell Stem Cell 7: 64 – 77
References 20. Li R, Liang J, Ni S, Zhou T, Qing X, Li H, He W, Chen J, Li F, Zhuang Q
et al (2010) A mesenchymal-to-epithelial transition initiates and is
1. Takahashi K, Yamanaka S (2006) Induction of pluripotent stem cells required for the nuclear reprogramming of mouse fibroblasts. Cell Stem
from mouse embryonic and adult fibroblast cultures by defined factors. Cell 7: 51 – 63
Cell 126: 663 – 676 21. Polo JM, Anderssen E, Walsh RM, Schwarz BA, Nefzger CM, Lim SM,
2. Hochedlinger K, Jaenisch R (2006) Nuclear reprogramming and pluripo- Borkent M, Apostolou E, Alaei S, Cloutier J et al (2012) A molecular
tency. Nature 441: 1061 – 1067 roadmap of reprogramming somatic cells into iPS cells. Cell 151:
3. Rais Y, Zviran A, Geula S, Gafni O, Chomsky E, Viukov S, Mansour AA, 1617 – 1632
Caspi I, Krupalnik V, Zerbib M et al (2013) Deterministic direct repro- 22. Onder TT, Kara N, Cherry A, Sinha AU, Zhu N, Bernt KM, Cahan P, Marcarci
gramming of somatic cells to pluripotency. Nature 502: 65 – 70 BO, Unternaehrer J, Gupta PB et al (2012) Chromatin-modifying enzymes
4. Jaenisch R, Young R (2008) Stem cells, the molecular circuitry of pluripo- as modulators of reprogramming. Nature 483: 598 – 602
tency and nuclear reprogramming. Cell 132: 567 – 582 23. Mikkelsen TS, Hanna J, Zhang X, Ku M, Wernig M, Schorderet P,
5. Aoi T, Yae K, Nakagawa M, Ichisaka T, Okita K, Takahashi K, Chiba T, Bernstein BE, Jaenisch R, Lander ES, Meissner A (2008) Dissecting direct
Yamanaka S (2008) Generation of pluripotent stem cells from adult reprogramming through integrative genomic analysis. Nature 454:
mouse liver and stomach cells. Science 321: 699 – 702 49 – 55
6. Hanna J, Markoulaki S, Schorderet P, Carey BW, Beard C, Wernig M, 24. Vire E, Brenner C, Deplus R, Blanchon L, Fraga M, Didelot C, Morey L,
Creyghton MP, Steine EJ, Cassady JP, Foreman R et al (2008) Direct Van Eynde A, Bernard D, Vanderwinden JM et al (2006) The Polycomb
reprogramming of terminally differentiated mature B lymphocytes to group protein EZH2 directly controls DNA methylation. Nature 439:
pluripotency. Cell 133: 250 – 264 871 – 874
7. Maherali N, Sridharan R, Xie W, Utikal J, Eminli S, Arnold K, Stadtfeld M, 25. Shi Y (2007) Histone lysine demethylases: emerging roles in develop-
Yachechko R, Tchieu J, Jaenisch R et al (2007) Directly reprogrammed ment, physiology and disease. Nat Rev Genet 8: 829 – 833
fibroblasts show global epigenetic remodeling and widespread tissue 26. Snijder B, Pelkmans L (2011) Origins of regulated cell-to-cell variability.
contribution. Cell Stem Cells, 1: 55 – 70 Nat Rev Mol Cell Biol 12: 119 – 125
8. Wernig M, Meissner A, Foreman R, Brambrink T, Ku M, Hochedlinger 27. Young MA, Larson DE, Sun CW, George DR, Ding L, Miller CA, Lin L,
K, Bernstein BE, Jaenisch R (2007) In vitro reprogramming of fibroblasts Pawlik KM, Chen K, Fan X et al (2012) Background mutations in parental
into a pluripotent ES-cell-like state. Nature 448: 318 – 324 cells account for most of the genetic heterogeneity of induced pluripo-
9. Okita K, Ichisaka T, Yamanaka S (2007) Generation of germline-compe- tent stem cells. Cell Stem Cell 10: 570 – 582
tent induced pluripotent stem cells. Nature 448: 313 – 317 28. Stadtfeld M, Maherali N, Borkent M, Hochedlinger K (2010) A
10. Yamanaka S (2009) A fresh look at iPS cells. Cell 137: 13 – 17 reprogrammable mouse strain from gene-targeted embryonic stem cells.
11. Yamanaka S (2009) Elite and stochastic models for induced pluripotent Nat Methods 7: 53 – 55
stem cell generation. Nature 460: 49 – 52 29. Carpenter AE, Jones TR, Lamprecht MR, Clarke C, Kang IH, Friman O,
12. Hanna J, Saha K, Pando B, van Zon J, Lengner CJ, Creyghton MP, van Guertin DA, Chang JH, Lindquist RA, Moffat J et al (2006) CellProfiler:
Oudenaarden A, Jaenisch R (2009) Direct cell reprogramming is a image analysis software for identifying and quantifying cell phenotypes.
stochastic process amenable to acceleration. Nature 462: 595 – 601 Genome Biol 7: R100
7 378 EMBO reports Vol 16 | No 3 | 2015 ª 2015 The Authors
108306-CG-EMBO-ChromatinReprint-Text.indb 13 16/03/2015 15:22You can also read