CIBC Virtual Canadian Mine Tour Young-Davidson - June 8, 2021 - Public now
←
→
Page content transcription
If your browser does not render page correctly, please read the page content below
CIBC Virtual Canadian Mine Tour

               Young-Davidson
                     June 8, 2021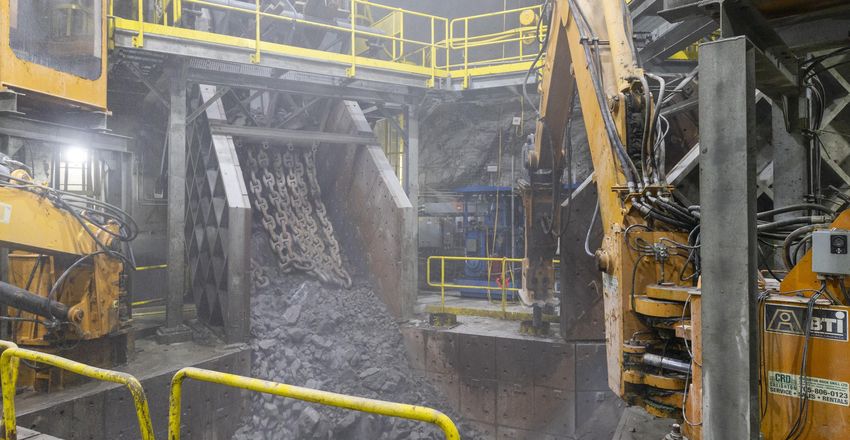
Cautionary Notes
This presentation, the information contained herein, any other materials provided in connection with this presentation and any oral remarks accompanying this presentation (collectively, the “Presentation”), has been prepared by Alamos Gold Inc. (“Alamos” or the “Company”) solely for information purposes. No stock exchange,
securities commission or other regulatory authority has approved or disapproved of the information contained herein. This Presentation does not constitute an offering of securities and the information contained herein is subject to the information contained in the Company’s continuous disclosure documents available on the
SEDAR website at www.sedar.com or on EDGAR at www.sec.gov.
Cautionary Notes
This Presentation contains statements that constitute forward-looking information as defined under applicable Canadian and U.S. securities laws. All statements in this Presentation, other than statements of historical fact, which address events, results, outcomes or developments that Alamos expects to occur are, or may be
deemed to be forward-looking statements. Forward-looking statements are generally, but not always, identified by the use of forward-looking terminology such as "expect", “assume”, “inferred”, “schedule”, "estimate", "budget", “continue”, “potential”, “outlook”, “trending”, “plan”, “target” or variations of such words and
phrases and similar expressions or statements that certain actions, events or results “may", "could”, “would", "might" or "will" be taken, occur or be achieved or the negative connotation of such terms. Such statements include information as to Alamos’ net asset value, operating cash flow, free cash flow, forecast gold
production, mineral reserves, mineral resources, exploration potential, mine life, gold grades, recoveries, waste-to-ore ratios, total cash cost, all-in sustaining costs, debt levels, capital expenditures, mining and milling rates, , development of the Lynn Lake project, shaft expansion project at Island Gold, expected completion of new
tailings facility (TIA1) and underground infrastructure, and future plans and objectives based on forecasts of future operational or financial results. Alamos cautions that forward-looking statements are necessarily based upon several factors and assumptions that, while considered reasonable by Alamos at the time of making such
statements, are inherently subject to significant business, economic, legal, political and competitive uncertainties and contingencies. Known and unknown factors could cause actual results to differ materially from those projected in the forward-looking statements. Such factors and assumptions include, but are not limited to:
changes to current estimates of mineral reserves and resources; changes to production estimates (which assume accuracy of projected ore grade, mining rates, recovery timing and recovery rate estimates which may be impacted by unscheduled maintenance, labour and contractor availability and other operating or technical
difficulties); operations may be exposed to new diseases, epidemics and pandemics, including the effects and potential effects of the global COVID-19 widespread pandemic; the impact of the COVID-19 pandemic on the broader market and the trading price of the Company's shares; provincial and federal orders or mandates
(including with respect to mining operations generally or auxiliary businesses or services required for our operations) in Canada, Mexico, the United States and Turkey; the duration of regulatory responses to the COVID-19 pandemic; governments and the Company’s attempts to reduce the spread of COVID-19 which may affect
many aspects of the Company's operations including the ability to transport personnel to and from site, contractor and supply availability and the ability to sell or deliver gold dore bars; fluctuations in the price of gold or certain other commodities such as, diesel fuel, natural gas, and electricity; changes in foreign exchange rates;
the impact of inflation; changes in our credit rating; any decision to declare a quarterly dividend, employee and community relations; litigation and administrative proceedings; (including but not limited to the investment treaty claim announced on April 20, 2021 commenced against the Republic of Turkey by the Company’s
wholly-owned Netherlands subsidiaries, Alamos Gold Holdings Coöperatief U.A, and Alamos Gold Holdings B.V.); disruptions affecting operations; availability of and increased costs associated with mining inputs and labour; expansion delays with the Phase III Expansion Project at the Island Gold mine; delays in completion of the
new tailings facility at the Young-Davidson mine, inherent risks associated with mining and mineral processing; the risk that the Company’s mines may not perform as planned; uncertainty with the Company’s ability to secure additional capital to execute its business plans, the speculative nature of mineral exploration and
development, including the risks of obtaining and maintaining necessary licenses and permits, including the necessary licenses, permits, authorizations and/or approvals from the appropriate regulatory authorities for the Company’s development stage and operating assets; labour and contractor availability (and being able to
secure the same on favourable terms); contests over title to properties; expropriation or nationalization of property, inherent risks and hazards associated with mining including environmental hazards, industrial hazards, industrial accidents, unusual or unexpected formations, pressures and cave-ins; changes in national and local
government legislation (including tax and employment legislation), controls or regulations in jurisdictions in which the Company does or may carry on business in the future; increased costs and risks related to the potential impact of climate change; failure to comply with environmental and health and safety laws and regulations;
disruptions in the maintenance or provision of required infrastructure and information technology systems; risk of loss due to sabotage, protests and other civil disturbances; impact of global liquidity and credit availability and the values of assets and liabilities based on projected future cash flows; risks arising from holding
derivative instruments; and business opportunities that may be pursued by the Company. The litigation against the Republic of Turkey, described above, results from the actions of the Turkish government in respect of the Company’s projects in the Republic of Turkey. Such litigation is a mitigation effort and may not be effective or
successful. If unsuccessful, the Company’s projects in Turkey may be subject to resource nationalism and further expropriation; the Company may lose the full value of its assets and gold mining projects in Turkey and its ability to operate in Turkey. Even if successful, there is no certainty as to the quantum of any damages award or
recovery of all, or any, legal costs. Any resumption of activities in Turkey, including renewal of the requisite operating licenses or permits, or even retaining control of its assets and gold mining projects in Turkey can only result from agreement with the Turkish government. The litigation described in this presentation may have an
impact on foreign direct investment in the Republic of Turkey which may result in changes to the Turkish economy, including but not limited to high rates of inflation and fluctuation of the Turkish Lira which may also affect the Company’s relationship with the Turkish government, the Company’s ability to effectively operate in
Turkey, and which may have a negative effect on overall anticipated project values. Additional risk factors and details with respect to risk factors affecting the Company’s ability to achieve the expectations set forth in the forward-looking statements contained in this Presentation are set out in the Company’s 40-F/Annual
Information Form for the year ended December 31, 2020 under the heading “Risk Factors”, which is available on the SEDAR website at www.sedar.com or on EDGAR at www.sec.gov. The foregoing should be reviewed in conjunction with the information found in this Presentation. The Company disclaims any intention or obligation
to update or revise any forward-looking statements whether as a result of new information, future events or otherwise, except as required by applicable law. Market data and other statistical information used throughout this Presentation are based on internal company research, independent industry publications, government
publications, reports by market research firms or their published independent sources. Industry publications, governmental publications, market research surveys and forecasts generally state that the information contained therein has been obtained from sources believed to be reliable. Although Alamos believes such information
is accurate and reliable, it has not independently verified any of the data from third party sources cited or used for the Company’s management’s industry estimates, nor has Alamos ascertained the underlying economic assumptions relied upon therein. While Alamos believes internal company estimates are reliable, such
estimates have not been verified by any independent sources, and Alamos makes no representations as to the accuracy of such estimates.
Note to U.S. Investors
All resource and reserve estimates included in this Presentation have been prepared in accordance with Canadian National Instrument 43-101 - Standards of Disclosure for Mineral Projects (“NI 43-101”) and the Canadian Institute of Mining, Metallurgy and Petroleum (the “CIM”) – CIM Definition Standards on Mineral Resources
and Mineral Reserves, adopted by the CIM Council, as amended (the “CIM Standards”). NI 43-101 is a rule developed by the Canadian Securities Administrators, which established standards for all public disclosure an issuer makes of scientific and technical information concerning mineral projects. The terms “Mineral Reserve”,
“Proven Mineral Reserve” and “Probable Mineral Reserve” are Canadian mining terms as defined in accordance with NI 43-101 and the CIM Standards. Investors are cautioned not to assume that all or any part of mineral deposits in these categories will ever be converted into reserves. “Inferred Mineral Resources” have a great
amount of uncertainty as to their existence, and great uncertainty as to their economic and legal feasibility. It cannot be assumed that all or any part of an Inferred Mineral Resource will ever be upgraded to a higher category. Under Canadian rules, estimates of Inferred Mineral Resources may not form the basis of feasibility or
pre-feasibility studies, except in very limited circumstances. Investors are cautioned not to assume that all or any part of an Inferred Mineral Resource exists or is economically or legally mineable. Disclosure of “contained ounces” in a Mineral Resource is permitted disclosure under Canadian regulations.
Cautionary non-GAAP Measures and Additional GAAP Measures
Note that for purposes of this section, GAAP refers to IFRS. The Company believes that investors use certain non-GAAP and additional GAAP measures as indicators to assess gold mining companies. They are intended to provide additional information and should not be considered in isolation or as a substitute for measures of
performance prepared with GAAP. “Cash flow from operating activities before changes in non-cash working capital” is a non-GAAP performance measure that could provide an indication of the Company’s ability to generate cash flows from operations, and is calculated by adding back the change in non-cash working capital to
“cash provided by (used in) operating activities” as presented on the Company’s consolidated statements of cash flows. “cash flow per share” is calculated by dividing “cash flow from operations before changes in working capital” by the weighted average number of shares outstanding for the period. “Free cash flow” is a non-
GAAP performance measure that is calculated as cash flows from operations net of cash flows invested in mineral property, plant and equipment and exploration and evaluation assets as presented on the Company’s consolidated statements of cash flows and that would provide an indication of the Company’s ability to generate
cash flows from its mineral projects. “Mine site free cash flow” is a non-GAAP measure which includes cash flow from operating activities at, less capital expenditures at each mine site. “Return on equity” is defined as earnings from continuing operations divided by the average total equity for the current and previous year.
“Mining cost per tonne of ore” and “cost per tonne of ore” are non-GAAP performance measures that could provide an indication of the mining and processing efficiency and effectiveness of the mine. These measures are calculated by dividing the relevant mining and processing costs and total costs by the tonnes of ore processed
in the period. “Cost per tonne of ore” is usually affected by operating efficiencies and waste-to-ore ratios in the period. “Total cash costs per ounce”, “all-in sustaining costs per ounce”, and “mine-site all-in sustaining costs” as used in this analysis are non-GAAP terms typically used by gold mining companies to assess the level of
gross margin available to the Company by subtracting these costs from the unit price realized during the period. These non-GAAP terms are also used to assess the ability of a mining company to generate cash flow from operations. There may be some variation in the method of computation of these metrics as determined by the
Company compared with other mining companies. In this context, “total cash costs” reflects mining and processing costs allocated from in-process and dore inventory and associated royalties with ounces of gold sold in the period. Total cash costs per ounce are exclusive of exploration costs. “All-in sustaining costs per ounce”
include total cash costs, exploration, corporate and administrative, share based compensation and sustaining capital costs. “Mine-site all-in sustaining costs” include total cash costs, exploration, and sustaining capital costs for the mine-site, but exclude an allocation of corporate and administrative and share based compensation.
“Adjusted net earnings” and “adjusted earnings per share” are non-GAAP financial measures with no standard meaning under IFRS. “Adjusted net earnings” excludes the following from net earnings: foreign exchange gain (loss), items included in other loss, certain non-reoccurring items and foreign exchange gain (loss) recorded in
deferred tax expense. “Adjusted earnings per share” is calculated by dividing “adjusted net earnings” by the weighted average number of shares outstanding for the period.
Additional GAAP measures that are presented on the face of the Company’s consolidated statements of comprehensive income and are not meant to be a substitute for other subtotals or totals presented in accordance with IFRS, but rather should be evaluated in conjunction with such IFRS measures. This includes “Earnings from
operations”, which is intended to provide an indication of the Company’s operating performance and represents the amount of earnings before net finance income/expense, foreign exchange gain/loss, other income/loss, and income tax expense. Non-GAAP and additional GAAP measures do not have a standardized meaning
prescribed under IFRS and therefore may not be comparable to similar measures presented by other companies. A reconciliation of historical non-GAAP and additional GAAP measures are detailed in the Company’s Management’s Discussion and Analysis available at www.alamosgold.com.
Technical Information
Chris Bostwick, FAusIMM, Alamos Gold’s Vice President, Technical Services, has reviewed and approved the scientific and technical information contained in this presentation. Chris Bostwick is a Qualified Person within the meaning of NI 43-101. The Qualified Persons for the NI 43-101 compliant Mineral Reserve and Resource
estimates are detailed in the tables in the appendix of this Presentation.
                                                                                                                                                                                                                                                                                                                                                    2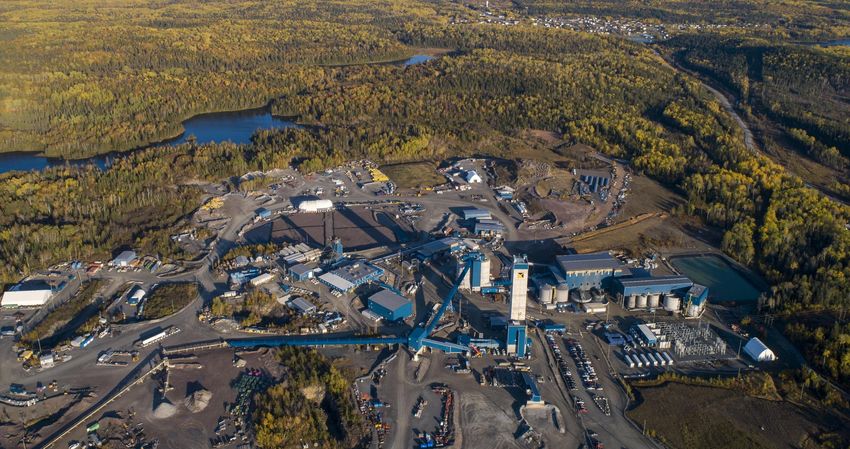
Introduction

                        Jamie Porter
               Chief Financial Officer
                                     3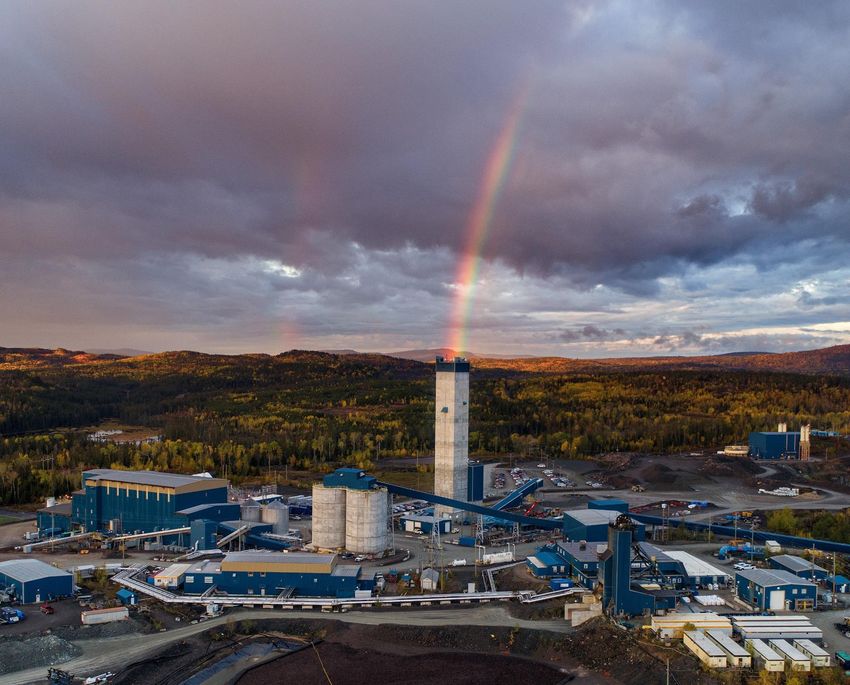
Strong platform for delivering sustainable long-term value

         Growing, diversified,                                                            Expanding margins &                                                                  Conservative, low-                  Sustainable business
          intermediate gold                                                                   profitability                                                                      risk strategy                       model supporting
               producer                                                                                                                                                                                            growing returns over
                                                                                                                                                                                                                      the long-term

                    470-510k oz                                                                   $1,025-$1,075                                                                  Safe jurisdictions                Balanced approach
                    2021E gold production                                                            2021E AISC per ounce1,2                                                   100% North American production              to capital allocation

                         ~750k oz                                                                             ~$800                                                                        Debt-free                          $208m
                                                                                                                                                                                                                   Returned to shareholders through
               2025E production potential                                                          2025E AISC per ounce1,2                                                 $238m cash & $738m total liquidity4
                                                                                                                                                                                                                        dividends & buybacks

                           12 year                                                        Strong FCF outlook                                                                            Fully funded              Long-term track record
                       average mine life3                                                including significant growth in                       20252                                             organic growth    of value creation for all stakeholders
1 Total consolidated all-in sustaining costs include corporate and administrative and share based compensation expenses. For the purposes of calculating all-in sustaining costs at individual
mine sites, the Company does not include corporate and administrative and share based compensation expenses
2 Please refer to Cautionary Notes on non-GAAP Measures and Additional GAAP Measures
3 Average mine life based on Proven & Probable Mineral Reserves as of December 31, 2020 at Young-Davidson and Mulatos and Phase III Expansion mine plan at Island Gold
4 Cash & cash equivalents and debt as of March 31, 2021
                                                                                                                                                                                                                                                            4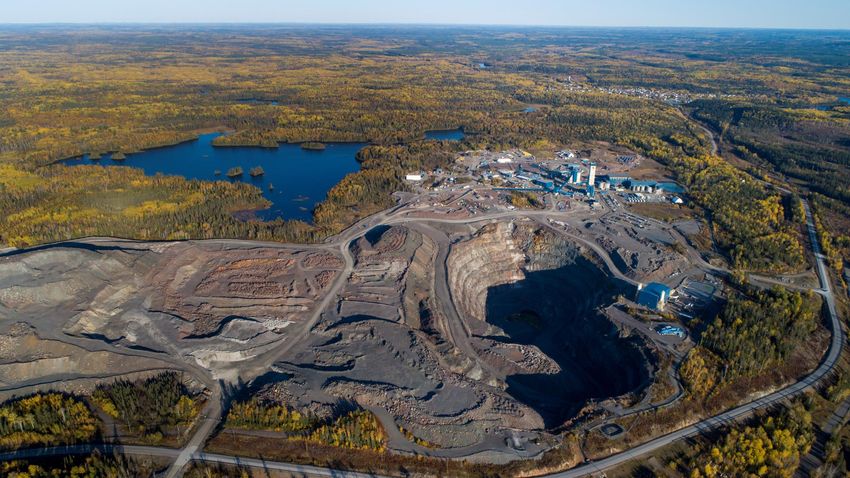
Diversified asset base; low political risk profile

                                                                                                 Island Gold, Ontario, Canada
                                                                                                 2021E Au Production 130-145 koz
                                                                                                 2021E Mine-site AISC4 $750-800/oz                                          ~500 koz
                                                                                                                                                                    Long-life annual production base;
                                                                                                      Young-Davidson, Ontario, Canada
                                                                                                      2021E Au Production       190-205 koz
                                                                                                                                                                     growth potential to ~750 koz in
                                                                                                      2021E Mine-site AISC4 $1,000-1,050/oz                                       20251
                     Lynn Lake, Canada

                                                                                                                                              Turkish Development
                 Quartz Mountain, USA                                                                                                                Projects
                                                                                                                                                                               100%
                                                                                                                                                                    North American gold production,
Mulatos, Sonora, Mexico
2021E Au Production       150-160 koz                                                                                                                                  including ~70% Canadian
2021E Mine-site AISC4 $1,060-1,110/oz

                                   Esperanza, Mexico

                                                                                                                                                                              12 year
                                                                                                                                                                    Average mine life supported by
           Producing Assets
                                                                                                                                                                    9.9m oz Mineral Reserve base2,3
           Exploration / Development Assets

1 750koz growth potential includes completion of Phase III Expansion at Island Gold and development of Lynn Lake
2 Proven & Probable Mineral Reserves total 9.9 million ounces of gold (204.1 mt at 1.50 g/t Au)
3 Average mine life based on existing operating mines
4 Please refer to Cautionary Notes on non-GAAP Measures and Additional GAAP Measures                                                                                                                    5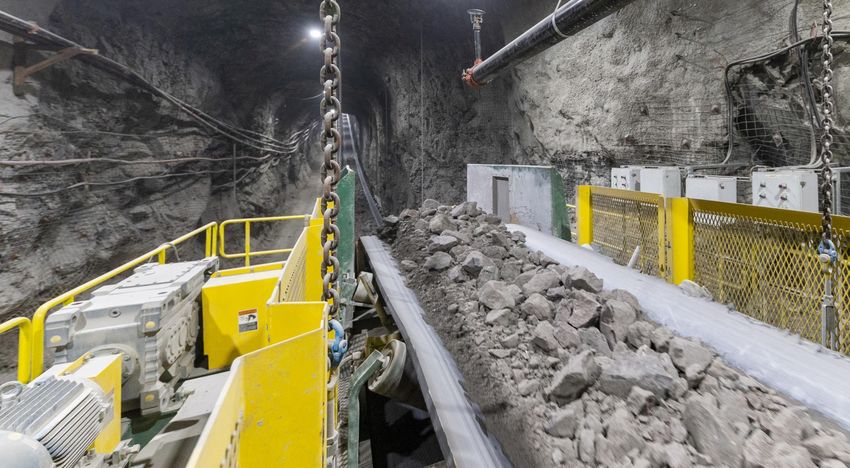
Growing, long-life North American production; declining cost profile

                                                                                    ~750k oz annual production potential by 2025 at ~$800/oz AISC1
                             800

                                                                                                                                                                                                                                    Lynn Lake3
                             700
                                                                                                                                                                                                    10 year reserve life2           ~170k oz per year 2025+
                             600
                                                                                                                                                                                                                                    Mulatos
    Production (000 oz Au)

                             500                                                                                                                                                                    7 year reserve life2            ~150k oz per year 2021+

                             400
                                                                                                                                                                                                                                    Island Gold
                                                                                                                                                                                                    15 year mine life2              ~138k oz in 2021
                             300
                                                                                                                                                                                                                                    ~236k oz per year 2025+
                             200

                             100                                                                                                                                                                   14 year reserve life2
                                                                                                                                                                                                                                    Young-Davidson
                                                                                                                                                                                                                                    200k oz+ per year 2021+
                              0
                              2020A                2021E                               2022E                               2023E                               2024E                               2025E                    2026E

                                                      Additional value                            creation opportunities with Turkish projects, Esperanza & Quartz Mountain
1 Please refer to Cautionary Notes on non-GAAP Measures and Additional GAAP Measures
2 Mineral Reserve life based on Mineral Reserves as of December 31, 2020. Island Gold mine life based on Phase III Expansion Study. See Mineral Reserve and Resource estimates and associated footnotes in appendix
3 For more detail on Lynn Lake project, see press release dated December 14, 2017
                                                                                                                                                                                                                                                              6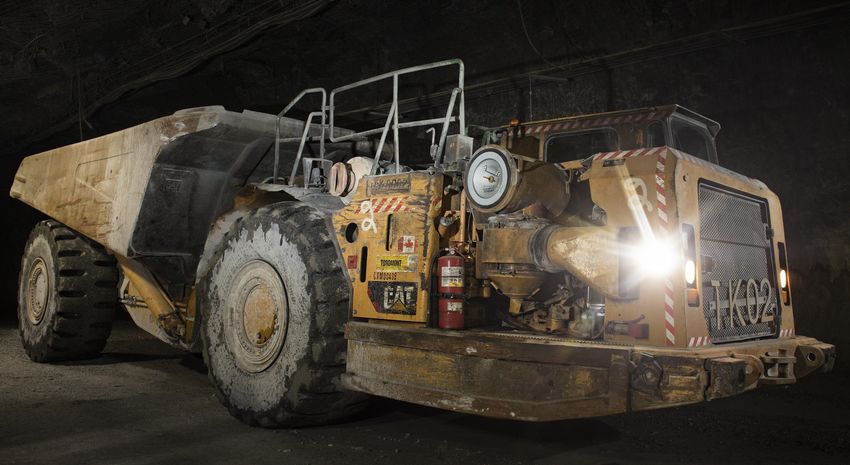
Track record of adding value through M&A & exploration

                        Mulatos (US$m)                                                                                     Young-Davidson (US$m)                                                               Island Gold (US$m)

                                                                                                                                                                      $69
                                                                                                                                                                                                                                    $209

                                                        $460                                                                                                        $1,465
                                                                                                                                                                                                                                   $1,319
                                                                                                                          $950
                                                                                                                                                                                                           $624
                                                        $530
                   $10

     Acquisition Cost (2003)                  Consensus NAV &                                              Acquisition Cost (2015)                         Consensus NAV &                       Acquisition Cost (2017) & 3   Consensus NAV &
                                               Cumulative FCF                                                                                               Cumulative FCF                      Royalty Repurchase (2020)       Cumulative FCF

                                                                                     Acquisition Cost                                  Consensus NAV1                         Cumulative FCF2

 1 Based on consensus analyst net asset value (NAV) estimates
 2 Cumulative free cash flow (FCF) generated since acquisition as of Q1 2021. Please refer to Cautionary Notes on non-GAAP Measures and Additional GAAP Measures
 3 Acquisition cost based on the value of Richmont Mines on closing ($627 million), net of $58 million in cash on its balance sheet. Royalty repurchase totaled $55 million                                                                      7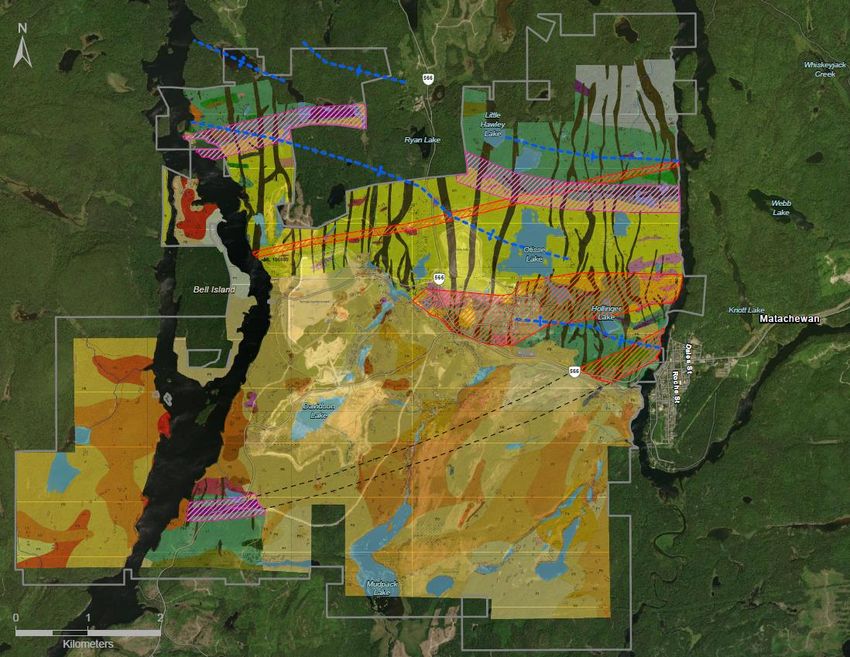
Young-Davidson overview

                                 Peter MacPhail
                          Chief Operating Officer
                                                8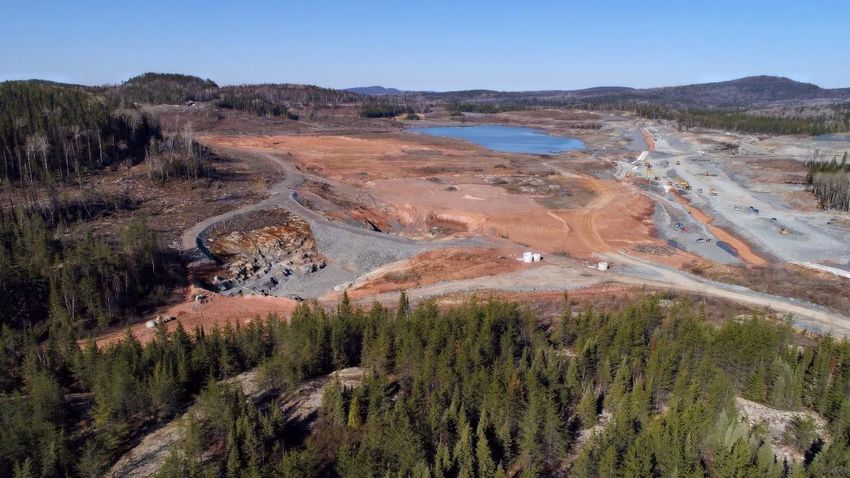
Young-Davidson – flagship, long-life production
        Location: Ontario, Canada                                                      Stage: Producing
        Ownership: 100% interest                                                       Operation: Underground

        •      One of Canada’s largest underground gold mines

        •      Stable jurisdiction, close to major centres

        •      14 year mine life based on YE 2020 Mineral Reserves

        •      Large resource base & exploration potential to support mine life extension

        •      $1.24B tax pools – minimal expected taxes payable in Canada until 20252

        Gold Reserves & Resources1                                                     Tonnes         Grade      oz Au
        As of December 31, 2020                                                         (000)        (g/t Au)    (000)

        P&P Mineral Reserves                                                           41,191             2.44   3,232

        M&I Mineral Resources                                                          11,011             3.22   1,140

        Inferred Mineral Resources                                                     2,331              2.86   214
1   See Mineral Reserve and Resource estimates and associated footnotes in appendix.
2   Tax pools as of December 31, 2020. Assumes gold price of $1800/oz Au.                                                9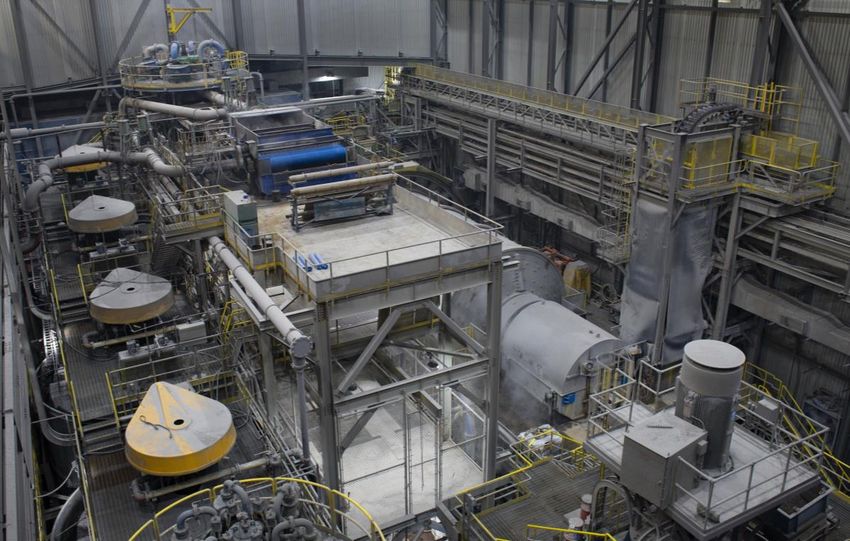
Regional map

                 Kidd Creek Mine
                                                              Clavos Mine
                                                                                Black Fox      Holloway
                           Bell Creek Mine                             Taylor                    Mine
                                                                                  Mine
                                                 Hoyle Pond
                                                                                                   Holt Mine
                 Timmins                     Dome Mine
                   West        Hollinger     Mine                                                                Operating mines/projects
                   Mine         Mine
                                                                                                                 City
                                                                                     Macassa
                                                                                      Mine

                                                        Young-Davidson
                                                             Mine                                                       >100M oz
                                                                                                                historic production from
                                                                                                               underground gold mines in
                                                                                                                Timmins & Kirkland Lake

        Cote
       Project

                                                                                                                                            10
Young-Davidson – recent history
2017
2012 • Produced a record 200k oz
• Q1 - mill commissioned • Generated record $34m free
• Apr 30: first gold pour 2015 cash flow1 2020
2008 • Sept 1: commercial Alamos & • Completed MCM waste pass Completion of
2005 • NXG reports total UG 2010 production (mill & OP) AuRico merged & raise bore of NG shaft lower mine
Northgate (NXG) resource of 1.86m oz NXG began • Oct: production of UG in US$1.5B expansion
acquired YD mine & • PEA published construction stoping ore transaction
MCM claims
2005 2006 2007 2008 2009 2010 2011 2012 2013 2014 2015 2016 2017 2018 2019 2020
2007 2011 2018
NXG established • AuRico acquired • Received schedule 2
portal & NXG for US$1.5B 2013 amendment for TIA1
• Open pit mining 2016
exploration ramp 2009 Oct 31: U/G • 1 millionth ounce
• MCM shaft
• NXG reports total UG commenced commercial production; produced
commissioned
resource of 3.8m oz commissioning of
• Transition to owner
• Preliminary Northgate shaft
development
Feasibility Study
completed
published
1 Please refer to Cautionary Notes on non-GAAP Measures and Additional GAAP Measures. 11Young-Davidson operational overview
Luc Guimond
General Manager, Young-Davidson
12ESG – Safety and Social
Safety Social
o Fostering positive relationships with all stakeholders
Lost Time Injury Frequency Rate1 o Partnerships with local communities
0.40 o Matachewan and Temagami First Nations
o Regional economic engine
0.25
38% o >$36m spent with local suppliers in 2020
improvement in LTIFR
o 696 employees (2020)
0.12
vs. 2018
o >85% of mine workforce from local regions
o 10% of total workforce are MFN or other FN band members
2018 2019 2020
Workforce by location
5%
Total Recordable Injury 3%
4%
Frequency Rate1 4%
6.36 6.62 4%
39%
46% 10%
3.45 improvement in
TRIFR vs. 2018
10%
21%
2018 2019 2020
Kirkland Lake Temiskaming Shores Englehart
Matachewan Sudbury Matachewan First Nation
Timmins Elk Lake Other
1 LTI and TRI per 200,000 hours worked 13ESG – leading on key environmental metrics
40,116 40,676
tCO2e total & per oz produced
38,503
• Reducing carbon intensity with increased automation from Improving GHG emissions
0.30
lower mine expansion, energy reduction initiatives, and lower
development requirements intensity
0.21 0.21
driven by completion of lower
• Using SAGR technology for ammonia removal in final effluent – mine expansion
752,000 m3 treated in 2020 to well below permitted limits 2019 2020 2021E
Total emissions (tCO2e)
Emission intensity (tCO2e/oz)
0.59
tCO2e/oz produced
0.51
Low GHG emissions
intensity1,2
0.21
per ounce gold produced relative
to intermediate & senior averages
Young-Davidson Int Avg Sr Avg
30.8
water withdrawl m3/oz
25.5
High water efficiency1,2
per ounce gold produced
Submerged Attached Growth Reactor (SAGR) 6.6
compared to intermediate and
senior averages
1 Source: 2019 data; Bloomberg, Credit Suisse 2020 Precious Metals ESG Scorecard (October 2020) Young-Davidson Int Avg Sr Avg 14
2 Intermediate average includes BTO, CG, ELD, IMG, NGD, OGC, YRI. Senior average includes AEM, GOLD, K, KL, NEMMining & processing
15Mining – highly productive bulk mining supporting 8,000 tpd capacity
Mining method
• Transverse long hole stoping
• For wider zones (12-40m)
• 94% of Mineral Reserve
• 35m sub levels in lower mine – an increase
from 30m sub levels in upper mine
• Paste backfill
• Mining recovery ~92%; dilution ~10%
• Grades & tonnes have reconciled well with
block model to date
Upper mine
infrastructure
Smaller production fleet post expansion
• 11 trucks (30 & 42t)
• 16 trucks prior to tie-in
• 11 production scoops (12yd)
Ore handling
Lower mine
• Dual shaft system – MCM & NG shafts infrastructure
• Combined skipping capacity 10,895 tpd
(ore + waste; post tie-in)
Highly mechanized – low personnel requirements 16Dual shaft system – excess skipping capacity post tie-in
Combined Skipping
Skipping Capacity Northgate Shaft MCM Shaft
Capacity (ore + waste)
Shaft system Friction hoist Dual drum hoist
Material movement Ore + waste Waste + personnel & materials
Post tie-in capacity (ore + waste) 9,995 tpd 900 tpd 10,895 tpd
Combined Skipping
Material movement Ore mined Waste mined Waste co-disposed
Requirements (ore + waste)
Peak ore + waste movement 8,000 tpd 1,550 tpd 750 tpd 8,800 tpd
Ore + Waste Mined & Skipped (tpd)
12,000
10,000
8,000
6,000
4,000
2,000
0
2019 2020 2021 2022 2023 2024 2025 2026 2027 2028 2029 2030
Ore mined & skipped Waste skipped Total skipping capacity
• Skipping capacity exceeds ore & waste skipping requirements by ~2,100 tpd
• MCM moving to double cage configuration given excess capacity – will facilitate more efficient
movement of personnel & material 17Lower mine infrastructure larger, more productive & highly automated
Upper mine Lower mine % Change
Lateral material handling trucking conveying
Mid shaft ore trucking from below 9590 L trucking n/a
Fine ore bin capacity 500t 6,000t +1,100%
Skip size 17.5t 24.5t +40%
Sub level spacing 30m 35m
Average stope size 24,000t 37,000t +54%
Economies of scale 6,000 tpd 8,000 tpd +33%
Increased scale, automation & productivity improvements driving costs lower
18Mining rates approaching lower mine design capacity
Capacity of new lower-mine
infrastructure
8,000 3
7,000
Capacity of decommissioned
upper-mine infrastructure
Underground mining rate (TPD)
6,000 2.5
5,000
g/t Au
4,000 2
3,000
2,000 1.5
1,000
0 1
Q1/14
Q2/14
Q3/14
Q4/14
Q1/15
Q2/15
Q3/15
Q4/15
Q1/16
Q2/16
Q3/16
Q4/16
Q1/17
Q2/17
Q3/17
Q4/17
Q1/18
Q2/18
Q3/18
Q4/18
Q1/19
Q2/19
Q3/19
Q4/19
Q1/20
Q2/20
Q3/20
Q4/20
Q1/21
Underground TPD Processed Grade
• Mining rates improved to exceed mid-mine capacity of 6,000 tpd between 2017 & 2019
• Completion of lower mine expansion debottlenecked underground ore handling & capacity; mining rates
approaching new design capacity of 8,000 tpd
• Long-term grades expected to average Mineral Reserve grade of 2.44 g/t Au
19Mill capacity of 8,000 tpd
9,000 100%
8,000 98%
7,000 96%
Mill throughput (TPD)
6,000 94%
Recoveries (%)
5,000 92%
4,000 90%
3,000 88%
2,000 86%
1,000 84%
0 82%
Q1/14
Q2/14
Q3/14
Q4/14
Q1/15
Q2/15
Q3/15
Q4/15
Q1/16
Q2/16
Q3/16
Q4/16
Q1/17
Q2/17
Q3/17
Q4/17
Q1/18
Q2/18
Q3/18
Q4/18
Q1/19
Q2/19
Q3/19
Q4/19
Q1/20
Q2/20
Q3/20
Q4/20
Q1/21
Mill Throughput (TPD) Recoveries
• Mill has exceeded 8,000 tpd when ore feed allowed
• Mill recoveries have increased over time to consistently average between 90-92%
20KPIs trending well following completion of lower mine expansion
Monthly underground mining and milling rates
10000
9000
8000
Ore Mined & Processed (TPD)
7000
6000
5000
4000
3000
2000
1000
0
Jan-20 Feb-20 Mar-20 Apr-20 May-20 Jun-20 Jul-20 Aug-20 Sep-20 Oct-20 Nov-20 Dec-20 Jan-21 Feb-21 Mar-21
Average underground mining rate (tpd) Average milling rate (tpd)
• Monthly mining & milling rates have exceeded 8,000 tpd post tie-in
• Additional mining horizon will enable consistent mining rates of 8,000 tpd in H2 2021
212021 guidance – on track to achieve design mining rates in H2 2021
2019A 2020A 2021E Guidance Q1 2021A
Gold Production (k oz) 188 136 190-205 48
Cost of Sales1 (US$/oz) $1,224 $1,491 $1,290 $1,291
Total Cash Costs2 (US$/oz) $800 $1,019 $790-$840 $873
Mine-site AISC2,3 (US$/oz) $1,047 $1,214 $1,000-$1,050 $1,075
Underground throughput (tpd) 6,720 5,345 7,500-8,000 7,791
Underground grade (g/t Au) 2.56 2.24 2.20-2.65 2.25
Mill throughput (tpd) 7,045 5,960 7,500-8,000 8,147
Milled grade (g/t) 2.46 2.08 2.20-2.65 2.23
Recovery (%) 91% 92% 90-92% 91%
Capital Expenditures (US$m)
Sustaining Capital (US$m) $46.2 $26.1 $40-$45 $9.5
Growth Capital (US$m) $53.7 $75.6 $25-$30 $11.4
Capitalized exploration - - $7 $1.0
Total Capital (US$m) $99.9 $101.7 $72-$82 $21.9
• Mining rates expected to average 7,500 tpd in Q2 2021, increasing to 8,000 tpd in H2 2021
• Total cash costs & mine-site AISC expected to decrease in H2 2021 reflecting higher throughput rates & grades
• 2021 growth capital focused on completing new tailings facility (TIA1) & underground infrastructure
1 Cost of sales includes mining and processing costs, royalties and amortization.
2 Please refer to Cautionary Notes on non-GAAP Measures and Additional GAAP Measures.
3 For the purposes of calculating mine-site all-in sustaining costs, the Company does not include an allocation of corporate and administrative and share based compensation expenses 22Unit costs & currency sensitivities
Unit costs per tonne (C$) 2019A 2020A 2021E Q1 2021A LOM
Underground $52 $60 $49 $48 $45
Mill Processing1 $20 $20 $18 $17 $17
Administration1 $5 $6 $8 $8 $6 YD Cost Structure - 2021
$114 Other
$77 Royalties 4%
3%
Underground mining cost
Equipment &
$54 $53 $54 $53 Maintenance
$51 $52 $51 $51 Personnel Costs
$48 17%
(C$/tonne)
$45 $44 35%
Gen & Admin
Costs
2%
Consumables Contractors &
19% Consultants
Q1/18 Q2/18 Q3/18 Q4/18 Q1/19 Q2/19 Q3/19 Q4/19 Q1/20 Q2/20 Q3/20 Q4/20 Q1/21
5%
Chemicals
• Unit mining costs expected to decrease to C$45/t long-term Electricity Diesel
& Gases 6%
9%
• Significant Leverage to C$/US$
• 95%+ of all outflows in C$
• $0.05 change in C$ impacts FCF US$15M in 2021 at Young-Davidson
• 2021 budget based on USD/CAD $0.75:1
1 Per tonne processed 23Capital outlook – declining intensity
2022 – 2023E 2024 – 2030E
Capital Estimates (US$m)1 2021E >2031E
Average Average
Sustaining $40-45 $35-40 - -
Growth $25-30 $15-20 - -
Total $65-75 $50-60 $40-50 $20-25
• TIA 1 construction
• Additional ventilation &
Major capital projects • Declining infrastructure
ore pass raises
requirements
Lateral development over mineral
~13km/yr ~12km/yr ~3km/yr
reserve life
Footnotes:
1. Assumes 0.75 CAD$ to every 1 US dollar
• Declining capital intensity post completion of tie-in of upper & lower mine
• Completion of TIA 1 tailings facility
• Declining infrastructure requirements
• Declining rates of underground development
24TIA 1 – new life of mine tailings facility
• Fully permitted – Schedule 2 Amendment received December 2018
• Centerline design consistent with industry best practices
• Construction expected to be completed late 2021
• Footprint sufficient for existing Mineral Reserves & Resources
• Total construction capital (2019-2021): $42m, including $14m to be spent in 2021
• Existing TIA 7 facility construction completed in 2018 – sufficient capacity to mid-2022
25Growing production & declining costs
Production & mine-site AISC
60,000 $2,000
$1,800
50,000
$1,600
$1,400
40,000
$1,200
30,000 $1,000
$800
20,000
$600
$400
10,000
$200
0 $0
Q1/18 Q2/18 Q3/18 Q4/18 Q1/19 Q2/19 Q3/19 Q4/19 Q1/20 Q2/20 Q3/20 Q4/20 Q1/21
1,2
Production (oz Au) Mine-site AISC (US$/oz)
• Higher production, lower costs & lower capital spending driving higher free cash flow
1 Please refer to Cautionary Notes on non-GAAP Measures and Additional GAAP Measures.
2 For the purposes of calculating mine-site all-in sustaining costs, the Company does not include an allocation of corporate and administrative and share based compensation expenses
26Young-Davidson free cash flow summary – quarterly
$50
$44
$39
$36
$31
$27 $27
$23 $24 $24 $23 $24 $22
$12 $11
$8 $7
$5 $4 $3
$2 $1 $1
-$3
-$19 -$19 -$20
-$23 -$22 -$23 -$22 -$24 -$23 -$22
-$27 -$27 -$27 -$26
-$30
Q1/18 Q2/18 Q3/18 Q4/18 Q1/19 Q2/19 Q3/19 Q4/19 Q1/20 Q2/20 Q3/20 Q4/20 Q1/21
1 2 2
Total capital (US$m) Operating cash flow (US$m) Mine-site free cash flow (US$m)
• Young-Davidson self-financed lower mine expansion since 2015
• $53m mine-site free cash flow generated in first two full quarters operating from lower mine infrastructure
1 Includes capitalized exploration
2
27
Please refer to Cautionary Notes on non-GAAP Measures and Additional GAAP MeasuresYoung-Davidson free cash flow summary – annual
$195
$114 $113 $118
$99 $98 $101
$34
$11 $13
$4
$0
-$80 -$77
-$87
-$95 -$100 -$102
3
2016A 2017A 2018A 2019A 2020A 2021E
1 2 2
Total capital (US$m) Operating cash flow (US$m) Mine-site free cash flow (US$m)
• Mine-site free cash flow expected to exceed record $100m in 2021 and beyond
• 14 year Mineral Reserve life + additional Resources & exploration upside to support long-life FCF generation
1 Includes capitalized exploration
2 Please refer to Cautionary Notes on non-GAAP Measures and Additional GAAP Measures
3 Based on the mid-point of guidance and assuming an $1,800/oz gold price in 2021
28Exploration
Scott RG Parsons
VP, Exploration
292021 exploration drilling – significant potential
Composite longitudinal, looking north Mineralization open at depth,
Northgate MCM Historic
W Historic
Shaft Shaft MCM Mine E along strike to west
YD Pit
Surface Drill Target
8,000 m of underground
exploration drilling from the
Surface Drill Target lower mine
500m
6,000 m of underground
exploration drilling from drill
9440L platforms in the mid-mine
9440L
Mid-Mine
UG Drill
Mid-Mine 1000m
UG Drill
Target Area Focus on expanding syenite-
Target Area YTD 2021 3000m hosted mineralization, as well
as continuing to evaluate
8990L
Timiskaming sediments and
Tisdale mafic-ultramafic flows
2020 – 6900m 1500m
YTD 2021 3000m
Lower Mine UG Drill Target Area 2021 marks first significant
exploration program at YD
Young Davidson Resource Wireframe YE2020 since 2011
302021 regional exploration program
7,500 m of surface exploration drilling H2 2021
(2 & 3)
OK03-26 (2003 ddh)
4.58gpt/4.2m
No. 29 (1937 ddh)
37.23gpt/0.91m
No. 40A ( 1945 ddh) (2 & 3)
19.2gpt/0.61m 1. Morrison Break – Investigate historic
SO96-04 (1996 ddh)
6.17gpt/6.0m
showings, follow up and target strategic
structural and mineralized trends
Young-Davidson Mine
2. Timiskaming / Tisdale Contact – Important
structural/lithological contact, hosting
Young-Davidson deposit
?? 3. Ultramafic Volcanics – Regionally important
Christie Gold Showing
17.63gpt/2.29m (1932 chip sample)
lithology for partitioning strain, alteration
(3) and subsequent mineralization, often found
along important structural breaks
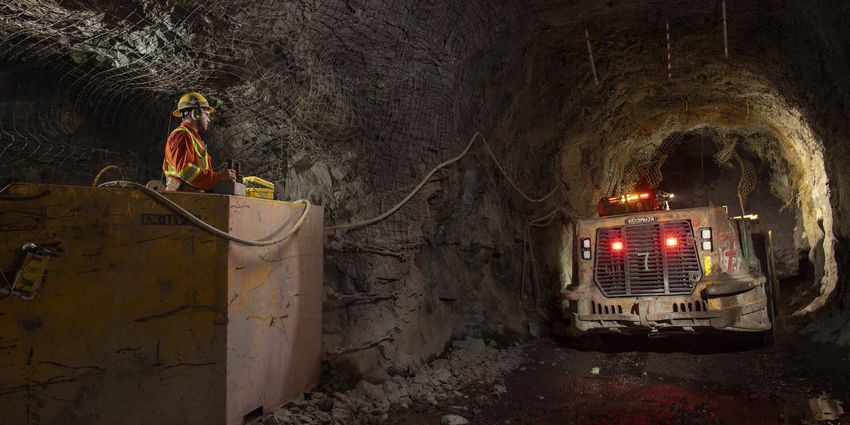
31Virtual site tour
Upper mine
infrastructure
Lower mine
infrastructure
32Appendix
33Increasing mining rates & productivity
Q3/15 Q4/15 Q1/16 Q2/16 Q3/16 Q4/16 Q1/17 Q2/17 Q3/17 Q4/17 Q1/18 Q2/18 Q3/18 Q4/18 Q1/19 Q2/19 Q3/19 Q4/19 Q1/20 Q2/20 Q3/20 Q4/20 Q1/21
Gold production (oz) 38,201 44,694 39,065 42,644 43,629 44,662 40,400 47,300 55,800 56,500 41,000 39,100 49,000 50,900 45,000 45,000 50,000 48,000 28,700 23,100 36,400 48,000 48,000
Cost of sales1 (US$/oz) $1,165 $986 $1,058 $1,182 $1,032 $1,077 $1,148 $1,113 $966 $1,107 $1,273 $1,350 $1,276 $1,184 $1,293 $1,278 $1,191 $1,149 $1,515 $2,059 $1,421 $1,264 $1,291
Total cash costs per oz. (2,3) $681 $617 $616 $738 $607 $667 $710 $677 $572 $690 $824 $890 $824 $764 $839 $822 $781 $766 $1,093 $1,564 $923 $792 $873
Mine-site AISC per oz.(2,3) $979 $980 $846 $965 $849 $926 $851 $895 $744 $859 $994 $1,083 $1,029 $974 $1,068 $1,077 $960 $1,083 $1,242 $1,809 $1,196 $934 $1,075
Underground mine
Tonnes mined per day 5,081 5,911 5,776 6,123 5,467 6,675 6,400 6,377 6,544 7,227 6,501 6,087 6,005 6,402 6,540 6,728 6,606 7,000 4,290 2,686 6,713 7,651 7,791
Grades (g/t) 2.6 2.6 2.6 2.4 2.8 2.4 2.6 2.6 2.9 2.7 2.4 2.4 2.6 2.7 2.5 2.4 2.6 2.7 2.2 2.5 2.24 2.20 2.25
Development metres 3,619 3,769 3,490 3,168 2,677 3,044 3,242 3,425 3,344 2,776 3,144 3,079 2,811 2,975 2,900 2,877 2,817 2,925 3,202 2,894 3,231 3,223 3,352
Unit UG mining costs (US$/t) $32 $294 $31 $34 $34 $32 $36 $33 $34 $34 $43 $41 $41 $38 $39 $40 $39 $39 $57 $82 $34 $34 $38
Unit UG mining costs (CAD$/t) $41 $384 $42 $44 $45 $42 $47 $44 $43 $44 $54 $53 $54 $51 $52 $53 $51 $51 $77 $114 $45 $44 $48
Mill processing facility
Tonnes processed per day 7,680 7,630 7,342 7,006 6,833 7,552 7,718 6,917 7,553 7,786 7,437 6,574 7,293 8,104 6,777 7,516 7,124 6,761 5,107 4,344 6,430 7,932 8,147
Grades (inc. OP stockpile) 1.9 2.2 2.1 2.1 2.4 2.2 2.2 2.5 2.7 2.6 2.2 2.2 2.4 2.4 2.5 2.3 2.5 2.7 1.9 1.85 2.19 2.21 2.23
Recoveries (%) 92% 91% 90% 92% 93% 90% 89% 92% 93% 92% 90% 92% 93% 92% 90% 91% 92% 92% 91% 93% 93% 91% 91%
1 Cost of sales includes mining and processing costs, royalties and amortization
2 Please refer to Cautionary Notes on non-GAAP Measures and Additional GAAP Measures
3 Excludes Net Realizable Value (“NRV”) inventory adjustments. See associated MD&A for a full reconciliation
4 Excludes hydro rebate not attributable to Q4/15 34Mill flow sheet
Process Line
CYCLONE OVERFLOW
Carbon Line
Primary
Cyclone Trash Eluate Solution Line
Screen
MIRON BELT CYCLONE UNDERFLOW AUTO Conditioning Regrind Cyclone
SAMPLER Tank
Regrind cyc
MILL FEED SAG Mill Floatation Cells circulating load: Flotation Concentrate Mill Process
Primary Thickener
Cyclone Pump Water Tank
Cell Cell
ORE Box 1 2 Cell
3 Cell
SAG DISCHARGE 4
WEIGHTOMETER
SCATS
Flotation Tailing
Thickener
Mass Pull:
PEBBLE CRUSHER
Flotation
Concentrate
Verti
Regrind Mill
Sump Cyclone
Pumpbox
Pump
HCL
Storage
Tank
Loaded
Carbon/CIL
Slurry Screen
Acid Carbon Pre- aeration
Wash Stripping Concentrate
Flotation
Tank Vessel Leach Tank
Concentrate
Flotation
Flotation
Concentrate Flotation
Leach Tank#1 Leach Tank#2 Concentrate Flotation
Leach Tank #3 Concentrate Flotation
Leach Tank#4 Combined Flotation Adsorption Adsorption Carbon
Leach Tank #5 Combined Combined Leach Tank #8 Leach Tank #9
Leach Tank #6 Safety
Pregnant Leach Tank#7 Screen Safety
Heat Exchanger Solution
Tank Stripped Cyanide Screen
Carbon Cyanide
Screen Destruction Destruction Fine Carbon
Hopper Tank A Tank B
Reactivated
Zone 1 Zone 2 Carbon
Sizing
Fine Screw Screen
Feeder Kiln
Carbon Quench
Barren Tank Tank To Paste Plant
Caustic Solution
Tank Tank Electrowinning Electrowinning Fine Reactivated
cell 1 cell 2 Carbon Sized Carbon Tailings Standpipe
Filter Tank
Cyanide Fine SO2 CuSO4
Carbon Storage Storage
Tank Smelting Doré Bag Tank Tank 35
FurnaceProven & Probable Mineral Reserves
PROVEN AND PROBABLE GOLD MINERAL RESERVES (as at December 31, 2020)
Proven Reserves Probable Reserves Total Proven and Probable
Tonnes Grade Ounces Tonnes Grade Ounces Tonnes Grade Ounces
(000's) (g/t Au) (000's) (000's) (g/t Au) (000's) (000's) (g/t Au) (000's)
Young-Davidson 20,614 2.50 1,657 20,577 2.38 1,574 41,191 2.44 3,232
Island Gold 894 10.95 315 3,303 9.37 995 4,197 9.71 1,310
Mulatos Main Pits 668 0.97 21 4,779 0.92 142 5,447 0.93 163
Stockpiles 8,854 1.30 369 0 0.00 0 8,854 1.30 369
La Yaqui Grande 0 0.00 0 18,203 1.25 732 18,203 1.25 732
Cerro Pelon 502 1.89 31 929 1.91 57 1,431 1.90 87
Total Mulatos 10,024 1.30 420 23,911 1.21 931 33,935 1.24 1,351
MacLellan 12,059 1.83 710 15,761 1.33 672 27,820 1.54 1,382
Gordon 2,311 1.83 210 6,412 2.27 468 8,723 2.42 678
Total Lynn Lake 14,370 1.99 920 22,172 1.60 1,140 36,542 1.75 2,060
Ağı Dağı 1,450 0.76 36 52,911 0.66 1,130 54,361 0.67 1,166
Kirazlı 670 1.15 25 33,191 0.68 727 33,861 0.69 752
Total Turkey 2,120 0.89 61 86,102 0.67 1,857 88,222 0.68 1,918
Alamos - Total 48,022 2.18 3,373 156,065 1.29 6,498 204,087 1.50 9,870
PROVEN AND PROBABLE SILVER MINERAL RESERVES (as at December 31, 2020)
Proven Reserves Probable Reserves Total Proven and Probable
Tonnes Grade Ounces Tonnes Grade Ounces Tonnes Grade Ounces
(000's) (g/t Ag) (000's) (000's) (g/t Ag) (000's) (000's) (g/t Ag) (000's)
La Yaqui Grande 0 0.00 0 18,203 19.55 11,442 18,203 19.55 11,442
Cerro Pelon 502 21.03 339 929 20.74 619 1,431 20.84 959
MacLellan 12,059 4.94 1,914 15,761 3.97 2,011 27,820 4.39 3,925
Ağı Dağı 1,450 6.22 290 52,911 5.39 9,169 54,361 5.41 9,459
Kirazlı 670 16.94 365 33,191 9.27 9,892 33,861 9.42 10,257
Alamos - Total 14,681 6.16 2,909 120,995 8.52 33,133 135,676 8.26 36,042
36Total Measured & Indicated Mineral Resources
MEASURED AND INDICATED GOLD MINERAL RESOURCES (as at December 31, 2020)
Measured Resources Indicated Resources Total Measured and Indicated
Tonnes Grade Ounces Tonnes Grade Ounces Tonnes Grade Ounces
(000's) (g/t Au) (000's) (000's) (g/t Au) (000's) (000's) (g/t Au) (000's)
Young-Davidson - Surface 496 1.13 18 1,242 1.28 51 1,739 1.24 69
Young-Davidson - Underground 6,019 3.44 665 3,253 3.88 406 9,272 3.59 1,071
Total Young-Davidson 6,515 3.26 683 4,495 3.16 457 11,011 3.22 1,140
Island Gold 14 4.61 2 704 7.23 164 718 7.18 166
Mulatos 8,207 1.25 329 63,112 1.08 2,189 71,319 1.10 2,518
La Yaqui Grande 0 0.00 0 1,237 0.81 32 1,237 0.80 32
Cerro Pelon 74 1.92 5 208 1.39 9 282 1.54 14
Carricito 58 0.82 2 1,297 0.82 34 1,355 0.83 36
Total Mulatos 8,339 1.25 336 65,854 1.07 2,264 74,193 1.09 2,600
MacLellan - Open Pit 902 2.07 60 3,532 1.71 194 4,434 1.78 254
MacLellan - Underground 0 0.00 0 123 3.54 14 123 3.54 14
Gordon 105 1.86 6 1,511 2.06 100 1,617 2.05 106
Burnt Timber 0 0.00 0 1,021 1.40 46 1,021 1.40 46
Linkwood 0 0.00 0 984 1.16 37 984 1.17 37
Total Lynn Lake 1,007 2.04 66 7,172 1.70 391 8,178 1.74 457
Esperanza 19,226 1.01 622 15,126 0.95 462 34,352 0.98 1,084
Ağı Dağı 553 0.44 8 34,334 0.46 510 34,887 0.46 518
Kirazlı 0 0.00 0 3,056 0.42 42 3,056 0.43 42
Çamyurt 513 1.00 16 17,208 0.89 492 17,721 0.89 508
Total Turkey 1,066 0.70 24 54,598 0.59 1,044 55,664 0.60 1,068
Quartz Mountain 214 0.95 7 11,942 0.87 333 12,156 0.87 339
Alamos - Total 36,381 1.49 1,740 159,891 1.00 5,115 196,272 1.09 6,855
MEASURED AND INDICATED SILVER MINERAL RESOURCES (as at December 31, 2020)
Measured Resources Indicated Resources Total Measured and Indicated
Tonnes Grade Ounces Tonnes Grade Ounces Tonnes Grade Ounces
(000's) (g/t Ag) (000's) (000's) (g/t Ag) (000's) (000's) (g/t Ag) (000's)
La Yaqui Grande 0 0.00 0 1,237 11 448 1,237 11 448
Cerro Pelon 74 16.80 40 208 17 114 282 17 154
MacLellan - Open Pit 902 8.55 248 3,532 4.64 527 4,434 5.44 775
MacLellan - Underground 0 0.00 0 123 6.05 24 123 6.05 24
Esperanza 19,226 7.25 4,482 15,126 9.16 4,455 34,352 8.09 8,936
Ağı Dağı 553 1.59 28 34,334 2.19 2,417 34,887 2.18 2,445
Kirazlı 0 0.00 0 3,056 2.71 266 3,056 2.71 266
Çamyurt 513 5.63 93 17,208 6.15 3,404 17,721 6.14 3,497
Alamos - Total 21,268 7.15 4,890 74,824 4.84 11,655 96,092 5.36 16,545 37Total Inferred Mineral Resources
INFERRED GOLD MINERAL RESOURCES (as at December 31, 2020)
Tonnes Grade Ounces
(000's) (g/t Au) (000's)
Young-Davidson – Surface 31 0.99 1
Young-Davidson – Underground 2,301 2.88 213
Total Young-Davidson 2,331 2.86 214
Island Gold 6,915 14.43 3,208
Mulatos 8,122 0.92 239
La Yaqui Grande 243 1.12 9
Cerro Pelon 26 0.71 1
Carricito 900 0.74 22
Total Mulatos 9,291 0.91 271
MacLellan - Open Pit 1,227 1.11 44
MacLellan - Underground 72 3.69 9
Gordon 132 1.36 6
Burnt Timber 23,438 1.04 781
Linkwood 21,004 1.16 783
Total Lynn Lake 45,873 1.10 1,622
Esperanza 718 0.80 18
Ağı Dağı 16,760 0.46 245
Kirazlı 7,694 0.61 152
Çamyurt 2,791 0.95 85
Total Turkey 27,245 0.55 482
Quartz Mountain 39,205 0.91 1,147
Alamos - Total 131,579 1.65 6,962
INFERRED SILVER MINERAL RESOURCES (as at December 31, 2020)
Tonnes Grade Ounces
(000's) (g/t Ag) (000's)
La Yaqui Grande 243 7.35 57
Cerro Pelon 26 4.99 4
MacLellan - Open Pit 1,227 1.98 78
MacLellan - Underground 72 3.26 8
Esperanza 718 15.04 347
Ağı Dağı 16,760 2.85 1,536
Kirazlı 7,694 8.71 2,155
Çamyurt 2,791 5.77 518
Alamos - Total 29,531 4.95 4,703 38Notes to Mineral Reserve and Resource estimates
Qualified Persons
Chris Bostwick, FAusIMM, Alamos Gold’s Vice President, Technical Services, has reviewed and approved the scientific and technical information contained in this presentation. Chris Bostwick is a Qualified Person within the meaning of
Canadian Securities Administrator’s National Instrument 43-101 (“NI 43-101”). The Qualified Persons for the National Instrument 43-101 compliant mineral reserve and resource estimates are detailed in the following table.
Resources
Jeffrey Volk, CPG, FAusIMM Director - Reserves and Resource, Alamos Gold Inc. Young-Davidson, Lynn Lake
Raynald Vincent, P.Eng., M.G.P. Chief Geologist - Island Gold Island Gold
Marc Jutras, P.Eng Principal, Ginto Consulting Inc. Mulatos Pits, Cerro Pelon, La Yaqui, Carricito, Esperanza, Ağı Dağı, Kirazlı, Çamyurt, Quartz Mountain
Reserves
Chris Bostwick, FAusIMM VP Technical Services, Alamos Gold Inc. Young-Davidson, Lynn Lake
Nathan Bourgeault, P.Eng Chief Engineer - Island Gold Island Gold
Herb Welhener, SME-QP VP, Independent Mining Consultants Inc. Mulatos Pits, Cerro Pelon, La Yaqui, Ağı Dağı, Kirazlı
Notes to Mineral Reserve and Resource Tables:
• The Company’s Mineral Reserves and Mineral Resources as at December 31, 2020 are classified in accordance with the Canadian Institute of Mining Metallurgy and Petroleum’s “CIM Standards on Mineral Resources and Reserves,
Definition and Guidelines” as per Canadian Securities Administrator’s NI 43-101 requirements.
• Mineral Resources are not Mineral Reserves and do not have demonstrated economic viability.
• Mineral Resources are exclusive of Mineral Reserves.
• Mineral Reserve cut-off grade for the Mulatos Mine, the Cerro Pelon Pit, the La Yaqui Pit, the Kirazlı Pit and the Ağı Dağı Pit are determined as a net of process value of $0.10 per tonne for each model block.
• All Measured, Indicated and Inferred open pit Mineral Resources are pit constrained with the exception of those outside the Mulatos Main Pits on the Mulatos property which have no economic restrictions and are tabulated by gold
cut-off grade.
• With the exception of the Mulatos main open pit, Mineral Reserve estimates assumed a gold price of $1,250 per ounce and Mineral Resource estimates assumed a gold price of $1,400 per ounce. As the Mulatos main open pit has a
Mineral Reserve life remaining of less than two years, a gold price of $1,400 was used.
• Metal prices, cut-off grades and metallurgical recoveries are set out in the table below.
Resources Reserves
Gold Price Cut-off Gold Price Cut-off Met Recovery
Mulatos:
Mulatos Main Open Pit $1,400 0.5 See notes see notes >50%
Cerro Pelon $1,400 0.3 $1,250 see notes 75%
La Yaqui $1,400 0.3 $1,250 see notes 75%
Carricito $1,400 0.3 n/a n/a n/a
Young-Davidson - Surface $1,400 0.5 $1,250 0.5 91%
Young-Davidson - Underground $1,400 1.3 $1,250 1.7 91%
Island Gold $1,400 3.5 $1,250 2.18-4.66 96.5%
Lynn Lake - MacLellan $1,400 0.42 $1,250 0.47 91-92%
Lynn Lake - MacLellan Underground $1,400 2.0 n/a n/a n/a
Lynn Lake - Gordon $1,400 0.62 $1,250 0.69 89-94%
Esperanza $1,400 0.4 n/a n/a 60-72%
Ağı Dağı $1,400 0.2 $1,250 see notes 80%
Kirazlı $1,400 0.2 $1,250 see notes 81%
Çamyurt $1,400 0.2 n/a n/a 78%
Quartz Mountain $1,400 0.21 Oxide, 0.6 Sulfide n/a n/a 65-80%
39Scott K. Parsons, CFA
VP, Investor Relations
416.368.9932 x 5439
sparsons@alamosgold.com
40You can also read


