Cincinnati, Ohio-Kentucky-Indiana - COMPREHENSIVE HOUSING MARKET ANALYSIS - HUD User
←
→
Page content transcription
If your browser does not render page correctly, please read the page content below

The analysis presented in this report was completed prior to the COVID-19 outbreak
in the United States and therefore the forecast estimates do not take into account
the economic and housing market impacts of the actions taken to limit contagion
of the virus. At this time, the duration and depth of the economic disruption are
unclear, as are the extent and effectiveness of government policies to counteract
the disruption. HUD will continue to monitor market conditions in the HMA and
provide an updated report/addendum in the future.

        COMPREHENSIVE HOUSING MARKET ANALYSIS

           Cincinnati, Ohio-
          Kentucky-Indiana
      U.S. Department of Housing and Urban Development,
      Office of Policy Development and Research
      As of October 1, 2019

      Share on: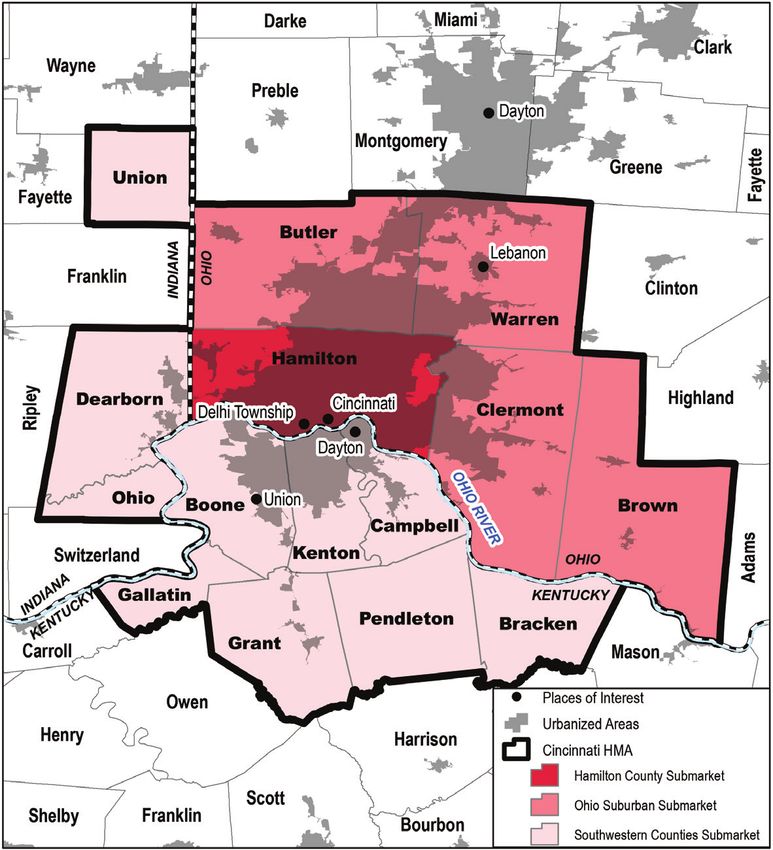
Cincinnati, Ohio-Kentucky-Indiana Comprehensive Housing Market Analysis as of October 1, 2019                                                                               Executive Summary 2

Executive Summary
Housing Market Area Description
The Cincinnati Housing Market Area (HMA), bisected by the Ohio
River, includes 15 counties in Ohio, Kentucky, and Indiana and is
coterminous with the Cincinnati, OH-KY-IN Metropolitan Statistical
Area. For the purposes of this analysis, the HMA is divided into
three submarkets. The Hamilton County submarket is coterminous
with Hamilton County in Ohio and includes the city of Cincinnati.
The Ohio Suburban submarket is coterminous with Brown, Butler,
Clermont, and Warren Counties in Ohio. The Southwestern
Counties submarket includes Boone, Bracken, Campbell, Gallatin,
Grant, Kenton, and Pendleton Counties in Kentucky and Dearborn,
Union, and Ohio Counties in Indiana.                                                                Tools and Resources

                                                                                                     Find interim updates for this metropolitan area, and select geographies nationally,
The current population of the HMA is estimated at 2.20 million.                                      at PD&R’s Market-at-a-Glance tool.
                                                                                                     Additional data for the HMA can be found in this report’s supplemental tables.
                                                                                                     For information on HUD-supported activity in this area, see the Community Assessment Reporting Tool.

                                                                                                  Comprehensive Housing Market Analysis Cincinnati, Ohio-Kentucky-Indiana
                                                                                                U.S. Department of Housing and Urban Development, Office of Policy Development and Research
Cincinnati, Ohio-Kentucky-Indiana Comprehensive Housing Market Analysis as of October 1, 2019 Executive Summary 3
Market Qualifiers
Economy Sales Market Rental Market
Strong: Job growth averaged Balanced: The average new and Balanced: Renter households
1.8-percent during the 12 months existing home sales price increased currently account for 35.5 percent
ending September 2019. 2 percent during the 12 months of all households in the HMA, up
ending September 2019. from 32.7 percent in 2010.
Total nonfarm payrolls in the Cincinnati HMA have Sales housing market conditions in the Cincinnati The overall rental market in the HMA is currently
increased each year since 2011 (Figure 1), and HMA are currently balanced, with a 1.5-percent balanced, with an estimated 7.0-percent vacancy
growth recently accelerated. During the 12 months vacancy rate, down from 2.5 percent in April 2010, rate, down from 11.8 percent in April 2010. Similar
ending September 2019, total nonfarm payrolls when conditions were soft. During the 12 months conditions exist in all three submarkets, with rental
grew 1.8 percent, or by 20,400 jobs, to 1.13 million ending September 2019, approximately 39,200 vacancy rates ranging from 6.3 to 7.6 percent.
jobs, compared with a 1.2-percent, or 13,100-job new and existing homes sold, representing a The apartment market in the HMA is slightly tight,
increase during the 12 months ending September decrease of 1,150 homes, or 3 percent, from a year with a 3.9-percent vacancy rate during the third
2018. Nonfarm payrolls increased in 7 of the 11 earlier (Metrostudy, A Hanley Wood Company, with quarter of 2019, down from 4.5 percent during the
payroll sectors during the most recent 12 months, adjustments by the analyst). Demand is expected third quarter of 2018 (Reis, Inc.). During the 3-year
with the professional and business services and the for 13,775 new homes during the forecast period. forecast period, demand is estimated for 8,050
education and health services sectors, combined, The estimated 1,530 homes currently under units; the 3,510 units currently under construction
adding the most jobs. The economy is expected construction will satisfy part of the demand. will satisfy a portion of that demand.
to continue expanding during the 3-year forecast
period, with nonfarm payrolls increasing by an
average of 19,300 jobs, or 1.7 percent, a year.
3-Year Housing Demand Forecast
TABLE OF CONTENTS Sales Units Rental Units
Total Demand 2,975 4,575
Economic Conditions 4 Hamilton County Submarket
Under Construction 300 2,250
Population and Households 9 Total Demand 7,275 2,050
Ohio Suburban Submarket
Home Sales Market Conditions 13 Under Construction 830 410
Total Demand 3,525 1,425
Rental Market Conditions 25 Southwestern Counties Submarket
Under Construction 400 850
Terminology Definitions and Notes 34 Total Demand 13,775 8,050
Cincinnati HMA
Under Construction 1,530 3,510
Notes: Total demand represents estimated production necessary to achieve a balanced market at the end of the forecast period. Units under construction
as of October 1, 2019. The forecast period is from the current date (October 1, 2019), to October 1, 2022.
Source: Estimates by the analyst
Comprehensive Housing Market Analysis Cincinnati, Ohio-Kentucky-Indiana
U.S. Department of Housing and Urban Development, Office of Policy Development and ResearchCincinnati, Ohio-Kentucky-Indiana Comprehensive Housing Market Analysis as of October 1, 2019 Economic Conditions 4
Figure 1. 12-Month Average Nonfarm Payrolls in the Cincinnati HMA Figure 2. Share of Nonfarm Payroll Jobs in the Cincinnati HMA, by Sector
National Recession Nonfarm Payrolls Local 7.5% Mining, Logging, & Construction 4.4%
State 2.6%
Federal 1.3% Manufacturing 10.7%
1,150
Other Services 3.7%
Nonfarm Payrolls (in Thousands)
Government
11.4% Wholesale 5.4%
1,100
Leisure & Hospitality 11.3%
Trade
Total 15.0%
1,050 1,125.0 Retail 9.6%
Education
& Health
Services
1,000 15.2%
Transportation & Utilities 4.7%
Health 13.6% Information 1.2%
950 Financial Activities 6.8%
Se 00
Se 06
Se 05
Se 08
Se 09
Se 04
Se 02
Se 03
Se 07
Se 01
Se 15
Se 16
Se 14
Se 10
Se 18
19
Se 12
Se 13
Se 17
Se 11 Education 1.6%
p-
p-
p-
p-
p-
p-
p-
p-
p-
p-
p-
p-
p-
p-
p-
p-
p-
p-
p-
p-
Professional & Business Services 15.6%
Se
Note: 12-month moving average. Notes: Total nonfarm payroll is in thousands. Percentages may not add to 100 percent due to rounding.
Sources: U.S. Bureau of Labor Statistics; National Bureau of Economic Research Based on 12-month averages through September 2019.
Source: U.S. Bureau of Labor Statistics
Economic Conditions Figure 3. Sector Growth in the Cincinnati HMA, 2010 to Current
Largest Sector: Professional and Business Services Total Nonfarm Payroll Jobs
Goods-Producing Sectors
Mining, Logging, & Construction
The professional and business services sector accounts for nearly Manufacturing
Service-Providing Sectors
16 percent of all nonfarm payroll jobs in the HMA and has added
Wholesale & Retail Trade
the most jobs of any sector since 2010 (Figures 2 and 3). Transportation & Utilities
Information
Financial Activities
Primary Local Economic Factors
Professional & Business Services
Education & Health Services
The HMA was established as a trade hub in the early 1800s, largely because Leisure & Hospitality
Other Services
of its location on the Ohio River, when the introduction of steamboats and the Government
construction of railroads provided more rapid access to goods, including pork. -20 0 20 40 60 80 100 120 140
During the 19th century, steamboat manufacturing and meat processing were Change in Jobs in Thousands
important to the local economy; the city of Cincinnati was the pork-packing Note: The current date is October 1, 2019.
center of the United States. During the end of the 20th and the beginning of Source: U.S. Bureau of Labor Statistics
Comprehensive Housing Market Analysis Cincinnati, Ohio-Kentucky-Indiana
U.S. Department of Housing and Urban Development, Office of Policy Development and ResearchCincinnati, Ohio-Kentucky-Indiana Comprehensive Housing Market Analysis as of October 1, 2019 Economic Conditions 5
the 21st century, the wholesale and retail trade and the manufacturing sectors Current Conditions—Nonfarm Payrolls
lost jobs because of increased foreign competition, but the sectors remain an Economic growth in the HMA accelerated during the 12 months ending September
important part of the local economy today. Currently, 3 of the top 10 employers 2019, surpassing job growth in the nation. Nonfarm payrolls in the HMA totaled
in the HMA, including Kroger Co., Procter & Gamble Co., and General Electric 1.13 million jobs, up 20,400 jobs, or 1.8 percent (Table 2), exceeding the national
(GE) Aviation, are in these two sectors (Table 1). growth rate of 1.6 percent. By comparison, payrolls increased by 13,100 jobs, or
1.2 percent, during the 12 months ending September 2018, at the same time the
Table 1. Major Employers in the Cincinnati HMA national growth rate was 1.6 percent. During the 12 months ending September
Name of Employer Nonfarm Payroll Sector Number of 2019, job gains in the HMA were led by the professional and business services
Employees and the education and health services sectors, which rose by 5,500 and 4,600
Kroger Co. Wholesale & Retail Trade 21,250 jobs, or 3.2 and 2.8 percent, respectively. Other notable job growth in the HMA
University of Cincinnati Government 16,000 occurred in the manufacturing and the leisure and hospitality sectors, which
Cincinnati Children’s Hospital Medical Center Education & Health Services 15,300 added a combined total of 5,600 jobs. Recent job growth in these sectors is
UCHealth Government 12,000 described in the Economic Sectors of Significance section below.
TriHealth Education & Health Services 12,000
Procter & Gamble Co. Wholesale & Retail Trade 10,700 Table 2. 12-Month Average Nonfarm Payroll Jobs (1,000s)
in the Cincinnati HMA, by Sector
Mercy Health Partners Education & Health Services 9,000
12 Months 12 Months
Fifth Third Bancorp Financial Activities 8,800 Ending Ending Absolute Percentage
St. Elizabeth Healthcare Education & Health Services 8,225 September September Change Change
2018 2019
GE Aviation Manufacturing 7,400
Total Nonfarm Payroll Jobs 1,104.6 1,125.0 20.4 1.8
Note: Excludes local school districts. Goods-Producing Sectors 165.5 170.1 4.6 2.8
Source: Moody’s Analytics
Mining, Logging, & Construction 47.6 49.3 1.7 3.6
Manufacturing 117.9 120.8 2.9 2.5
Since the 2000s, the education and health services and the professional and Service-Providing Sectors 939.0 954.9 15.9 1.7
business services sectors have added the most jobs and have become the two Wholesale & Retail Trade 168.9 168.9 0.0 0.0
Transportation & Utilities 49.4 52.4 3.0 6.1
largest sectors in the HMA. The HMA is home to Cincinnati Children’s Hospital
Information 13.9 13.8 -0.1 -0.7
Medical Center, which is ranked number three of the best children’s hospitals
Financial Activities 74.0 76.6 2.6 3.5
in the nation, behind Boston Children’s Hospital and Children’s Hospital of Professional & Business Services 169.9 175.4 5.5 3.2
Philadelphia, according to the annual U.S. News Best Children’s Hospitals Education & Health Services 166.0 170.6 4.6 2.8
Honor Roll (U.S. News and World Report 2019–20 Best Children’s Hospitals). Leisure & Hospitality 124.8 127.5 2.7 2.2
The HMA is also home to eight Fortune 500 companies headquartered in the Other Services 42.2 41.8 -0.4 -0.9
HMA, including Kroger Co., which is ranked 20th on the list. The concentration Government 130.0 128.1 -1.9 -1.5
Notes: Based on 12-month averages through September 2018 and September 2019. Numbers may not
of corporate headquarters affects the professional and business services add to totals due to rounding. Data are in thousands.
sector the most. Source: U.S. Bureau of Labor Statistics
Comprehensive Housing Market Analysis Cincinnati, Ohio-Kentucky-Indiana
U.S. Department of Housing and Urban Development, Office of Policy Development and ResearchCincinnati, Ohio-Kentucky-Indiana Comprehensive Housing Market Analysis as of October 1, 2019 Economic Conditions 6
Unemployment loss of 0.5 percent nationally. During the period, 6 of the 11 sectors in the HMA
During the past 12 months, the average unemployment rate decreased primarily lost jobs, including the manufacturing and the wholesale and retail trade sectors,
because resident employment growth outpaced labor force growth. The which declined by averages of 8,800 and 2,000, or 6.2 and 1.2 percent, annually,
unemployment rate was 3.8 percent during the 12 months ending September respectively. GE Aviation was among the companies that had layoffs during this
2019, down from 4.0 percent during the 12 months ending September 2018, period, reducing its workforce by 500 employees in 2001 because of restructuring.
and below the recent peak of 10.1 percent during the 12 months ending May Job growth resumed during the subsequent 5 years, increasing by an average
2010 when the local economy was contracting (Figure 4). Nationally, the of 7,600 jobs, or 0.7 percent, annually to reach 1.04 million jobs in 2007; during
unemployment rate was 3.7 percent during the 12 months ending September the 5-year period, jobs in the nation grew an average of 1.1 percent annually. The
2019, down from 4.0 percent a year earlier, and down from the peak of 9.7 professional and business services and the education and health services sectors
percent during the 12 months ending March 2010. led job growth in the HMA during the period, with average increases of 3,500 and
3,400 jobs, or 2.4 and 2.6 percent, annually, respectively. The employment services
Figure 4. 12-Month Average Unemployment Rate in the and the health care and social assistance industries added the most jobs in each
Cincinnati HMA and the Nation
sector, increasing by an average of 2,000 and 2,800 jobs, or 7.2 and 2.4 percent,
Cincinnati HMA Nation annually, respectively. Continued losses in the manufacturing and the wholesale
11.0 10.1%
and retail trade sectors averaged 1,800 and 100 jobs, or 1.4 percent and less than
10.0
1.0 percent, a year, respectively, which partially offset some of these job gains.
Unemployment Rate (%)
9.0
8.0
9.7% When jobs declined nationally by an average of 1.9 percent annually from 2008
through 2010, a result of the Great Recession, job losses in the HMA averaged
7.0
20,700 jobs, or 2.0 percent, a year. Job losses during the 3-year period were
6.0
widespread, but the manufacturing sector led declines with an average loss of
5.0
3.8% 5,800 jobs, or 5.1 percent, annually. The wholesale and retail trade and the mining,
4.0
3.7% logging, and construction sectors followed with average losses of 4,700 jobs
3.0 each, or 2.8 and 10.4 percent, annually, respectively. From 2008 through 2010, the
Se 00
Se 05
Se 06
Se 02
Se 08
Se 09
Se 03
Se 04
Se 07
Se 01
Se 10
Se 15
Se 12
Se 16
Se 18
19
Se 13
Se 14
Se 17
Se 11
education and health services sector was the only sector to add jobs, increasing
p-
p-
p-
p-
p-
p-
p-
p-
p-
p-
p-
p-
p-
p-
p-
p-
p-
p-
p-
p-
Se
by an average of 1,900, or 1.3 percent, annually.
Note: Based on the 12-month moving average.
Source: U.S. Bureau of Labor Statistics Economic conditions improved significantly from 2011 through 2017, but nonfarm
payroll growth in the HMA lagged behind the national average. During the 7-year
Nonfarm Payroll Trends—Overview period, nonfarm payrolls in the HMA increased by an average of 16,200 jobs, or
From 2001 through 2017, the economy of the Cincinnati HMA generally followed 1.6 percent, annually, compared with an average 1.7 percent annual growth rate
national economic trends, but periods of job growth were less pronounced in nationwide. Within the HMA, 9 of the 11 sectors added jobs, with the largest gains
the HMA. From 2001 through 2002, nonfarm payrolls in the HMA declined by an occurring in the leisure and hospitality, the professional and business services,
average of 4,400 jobs, or 0.4 percent, annually, compared with an average annual and the education and health services sectors, which grew by averages of 3,000,
Comprehensive Housing Market Analysis Cincinnati, Ohio-Kentucky-Indiana
U.S. Department of Housing and Urban Development, Office of Policy Development and ResearchCincinnati, Ohio-Kentucky-Indiana Comprehensive Housing Market Analysis as of October 1, 2019 Economic Conditions 7
2,900, and 2,500 jobs, or 2.7, 1.8, and 1.6 percent, annually, respectively. The percent, annually. Job losses from 2011 through 2017 in the government sector
manufacturing sector also added jobs during the period (job growth in the sector is included an average annual decrease of 400 jobs, or 2.2 percent, at the federal
described in the Economic Sectors of Significance section below). The information level; at the same time, the state government subsector added an average of 200
and the government sectors had no job growth during the period, each down 0.2 jobs, or 0.7 percent, and the local government subsector remained unchanged.
Economic Sectors of Significance
Professional and Business Services Wholesale and Retail Trade
The professional and business services sector began adding jobs in 2010 before During the 12 months ending September 2019, the wholesale and retail trade
overall nonfarm payroll growth in the HMA resumed in 2011 and has added more sector remained unchanged, compared with an increase of 900 jobs, or 0.5
jobs than any other sector since 2011. Since 2010, the sector increased by an percent, during the previous 12 months. This is the first time the sector has not
average of 2,900 jobs, or 1.8 percent, annually, to a current level of 175,400 added jobs since 2011, mainly because of a 1,000-job, or a 0.9 percent decline,
jobs. As a result, the sector surpassed the wholesale and retail trade sector in in the retail trade subsector; Charlotte Russe Holdings Corp., a women’s
2012 to become the largest payroll sector in the HMA. In July 2018, the Kroger clothing retailer, closed five stores in the HMA in the spring of 2019. Despite
Co. opened a second headquarters in downtown Cincinnati, moving 600 the recent stagnation, the wholesale and retail trade sector is the third-largest
existing jobs from other parts of the HMA, with the total number of jobs at the nonfarm payroll sector in the HMA, with 168,900 jobs, or 15 percent of total
new headquarters expected to exceed 1,000 by 2021. By comparison, the sector nonfarm payrolls. The Kroger Co. is the largest employer in the HMA with
grew by an average of 900 jobs, or 0.6 percent, a year from 2000 through 21,250 employees, and it is the largest supermarket chain by revenue and the
2009, partly because growth was offset by a 200- and an 11,400-job reduction, second largest private employer in the United States (after Walmart, Inc.). In
or 0.1 and 7.2 percent, in 2001 and 2009, respectively. September 2019, the Kroger Co. opened the first downtown Cincinnati store
in a half-century. The 50,000-square-foot store is on the bottom two floors
Education and Health Services of a $90 million, 18-story apartment tower, the 1010 On The Rhine, which
The education and health services sector, with 170,600 jobs, accounted for more
opens in November 2019.
than 15 percent of nonfarm payrolls during the 12 months ending September
2019. Nearly 90 percent of the jobs in the sector are in the healthcare and social Manufacturing
assistance industry. The sector has been the fastest-growing payroll sector in During the 12 months ending September 2019, manufacturing sector payrolls
the HMA since 2001, and it is the only sector with consecutive annual job gains rose by 2,900 jobs, or 2.5 percent, up from the 2,000 jobs added or 1.8
each year since 2001. Overall, the sector increased by an average of 2,700 percent annual growth from 2011 through 2018. The 120,800 jobs in the sector
jobs, or 1.9 percent, annually since 2001, surpassing the wholesale and retail accounted for nearly 11 percent of all nonfarm payroll jobs in the HMA. Since
trade sector in 2019 to become the second largest payroll sector in the HMA. 2004, GE Aviation has invested more than $500 million into its headquarters
Since 2001, the healthcare and social assistance industry increased an average facilities in the city of Evendale, Ohio (GE Aviation, 2019). In June 2019, IndiGo,
of 2,400 jobs, or 1.9 percent, annually. Eastgate Medical Center, a $21 million, an India-based airline, ordered more than $20 billion in LEAP-1A engines from
78,000-square-foot medical center that includes Mercy Health Partners, was CFM International Inc., a joint company between GE Aviation and Safran
completed in May 2019 in Union Township, adding 850 medical jobs. Aircraft Engines; this is the largest single order in aviation history.
Comprehensive Housing Market Analysis Cincinnati, Ohio-Kentucky-Indiana
U.S. Department of Housing and Urban Development, Office of Policy Development and ResearchCincinnati, Ohio-Kentucky-Indiana Comprehensive Housing Market Analysis as of October 1, 2019 Economic Conditions 8
Leisure and Hospitality
The leisure and hospitality sector has a noteworthy effect on the local economy and business services sector. Two-thirds of the growth in the sector occurred in
because Cincinnati is home to three professional sports teams, including the the accommodations and food services industry, and the remainder occurred
Major League Baseball team, the Cincinnati Reds; National Football League in the arts, entertainment, and recreation industry. Completion of the 26,000
team, the Cincinnati Bengals; and FC Cincinnati of Major League Soccer (MLS), seat, $250 million stadium for FC Cincinnati in March 2021 will contribute to job
which debuted in 2016. Since 2011, the sector has grown by an average of 2,900 growth in the leisure and hospitality sector.
jobs, or 2.6 percent, annually, to 127,500, just below gains in the professional
Employment Forecast
During the 3-year forecast period, nonfarm payroll growth is expected to House, which houses families of sick children, will double in size and in the
continue in the HMA, averaging 19,300 jobs, or 1.7 percent, annually. Job number of beds; it is expected to be complete in early 2020. Additional job
growth is expected to be highest in the first year of the forecast period and growth is also expected in the transportation and utilities sector because
moderate through the third year. Strong job growth is expected to continue in Amazon.com, Inc. broke ground on a new $1.5 billion Prime Air hub at Cincinnati/
the education and health services and the professional and business services Northern Kentucky International Airport (CVG). When the 3-million-square-foot
sectors, and growth is expected to also occur in the leisure and hospitality hub opens in 2021, more than 2,000 new jobs are expected; this project
sector. A $650 million, 600,000-square-foot expansion of Cincinnati Children’s will likely maintain CVG as the fastest-growing cargo airport in the nation,
Hospital Medical Center is scheduled to be completed during the first quarter a position established in 2016 (CVG Airport, 2019).
of 2022. Next door to the hospital, a $49 million expansion at a Ronald McDonald
Comprehensive Housing Market Analysis Cincinnati, Ohio-Kentucky-Indiana
U.S. Department of Housing and Urban Development, Office of Policy Development and ResearchCincinnati, Ohio-Kentucky-Indiana Comprehensive Housing Market Analysis as of October 1, 2019 Population and Households 9
Population and Households Figure 5. Components of Population Change in the Cincinnati HMA,
2000 Through the Forecast
Net Natural Change Net Migration Population Growth
Current Population: 2.20 million
14,000
12,000
HMA population growth has decelerated since 2010, despite strong 12,000 10,250 10,200
economic expansion, because net natural increase has slowed in 10,000
Population Change
the three submarkets and net in-migration to the Ohio Suburban 8,000 6,100
6,000
and Southwestern Counties submarkets slowed.
4,000
Population Trends 2,000
0
Cincinnati HMA -2,000
Population growth trends have generally countered economic conditions in the -4,000
2000-2010 2010-2012 2012-Current Current-Forecast
HMA since 2000. During the previous decade, the local economic downturn
from 2001 through 2002, and the deeper contraction from 2008 through 2010
Notes: Net natural change and net migration totals are average annual totals over the time period.
had relatively minor effects on population growth in the HMA. From 2000 The forecast period is from the current date (October 1, 2019), to October 1, 2022.
to 2010, the population increased by an average of 12,000, or 0.6 percent, Sources: U.S. Census Bureau; current to forecast—estimates by the analyst
annually (Table 3). During the period, net natural increase averaged 11,750
people annually and accounted for nearly 98 percent of the population growth combined with a reduced net natural increase averaging 9,100 people a year,
(Figure 5). Although economic conditions in the HMA began improving, greater caused population growth to slow to an average of 6,100 people, or 0.3 percent,
employment opportunities outside of the HMA contributed to average net out- annually from 2010 to 2012. The HMA population has risen by an average of
migration of 3,000 people annually from 2010 to 2012. This net out-migration, 10,250, or 0.5 percent, annually since 2012, to 2.20 million as of October 1, 2019,
due to net in-migration that has averaged 2,950 people annually. Since 2012,
Table 3. Cincinnati HMA Population and Household Quick Facts net natural increase averaged 7,300 people annually, accounting for 71 percent
2010 Current Forecast of population growth.
Population Population 2,114,580 2,203,000 2,233,000
Quick Facts Average Annual Change 12,000 9,275 10,200 Hamilton County Submarket
Percentage Change 0.6 0.4 0.5 The Hamilton County submarket is the most populated county in the HMA,
2010 Current Forecast accounting for 37 percent of the total HMA population (Figure 6), with an
Household Households 824,967 867,300 881,700 estimated 819,800 people as of October 1, 2019. Since 2012, the population
Quick Facts Average Annual Change 5,075 4,450 4,825
of the submarket increased by an average of 2,400 people, or 0.3 percent,
Percentage Change 0.6 0.5 0.6
Notes: Average annual changes and percentage changes are based on averages from 2000 to 2010, 2010
annually; changing migration patterns since 2012 contributed to the population
to current, and current to forecast. The forecast period is from the current date (October 1, 2019), growth. Since 2012, net out-migration slowed to an average of 450 people
to October 1, 2022.
Sources: 2000 and 2010—2000 Census and 2010 Census; current and forecast—estimates by the analyst annually; at the same time, net natural increase slowed to an average of 2,850
Comprehensive Housing Market Analysis Cincinnati, Ohio-Kentucky-Indiana
U.S. Department of Housing and Urban Development, Office of Policy Development and ResearchCincinnati, Ohio-Kentucky-Indiana Comprehensive Housing Market Analysis as of October 1, 2019 Population and Households 10
Figure 6. Current Population in the Cincinnati HMA, by Submarket 2018, the city of Cincinnati was the third-largest city in Ohio, behind Columbus
and Cleveland, with an estimated population of 302,600 (2018 American
Hamilton County Ohio Suburban Southwestern Counties
Community Survey [ACS] 1-year estimates).
Ohio Suburbs Submarket
The Ohio Suburban submarket is the most populated of the three submarkets
in the HMA, with an estimated population of 870,200 as of October 1, 2019,
23% reflecting an average gain of 4,975, or 0.6 percent, annually since 2010. During
37%
this time, net in-migration to the submarket averaged 2,325 people annually
40% and accounted for 47 percent of the growth. Recent growth trends reflect a
slowdown compared with the 2000 to 2010 period because of an increasing
preference to live in or near downtown Cincinnati. From 2000 through 2010,
the population of the submarket grew by an average of 11,150 people, or 1.5
percent, annually because of higher levels of in-migration from Hamilton County
Source: Estimates by the analyst and higher levels of net natural increase. During the decade, net in-migration to
the Ohio Suburban submarket averaged 6,100 people annually and accounted
people a year. Slower net-out migration from the submarket partly resulted for 55 percent of total population growth.
from the revitalization of downtown Cincinnati, boosted by economic growth Southwestern Counties Submarket
and the popularity of urban living. From 2000 to 2010, net out-migration from The Southwestern Counties submarket is the largest in terms of land area, but
the submarket averaged 7,975 people annually, exceeding the 3,675-person because much of the land is rural, the submarket accounts for less than one-
annual gain from net natural increase, which led to population loss averaging third of the total population of the HMA. As of October 1, 2019, the population
4,300 people, or 0.5 percent, annually. From 2010 to 2012, net out-migration of the submarket was estimated at 512,700, representing an average increase
from the submarket declined to an average of 3,400 people annually, and the of 2,475 people, or 0.5 percent, annually since 2010. Net in-migration to the
population remained nearly unchanged because net natural increase averaged submarket averaged 380 people annually during this period and accounted for
approximately the same amount. Population loss in the submarket from 2000 15 percent of population growth. By comparison, during the previous decade,
to 2012 was mostly because the city of Cincinnati was losing population. when the submarket benefited from higher net in-migration, the population in
Population growth in the Hamilton County submarket has been slower than the Southwestern Counties submarket grew by an average of 5,100 people,
in the Ohio Suburban and Southwestern Counties submarkets since people or 1.1 percent, annually, and net in-migration accounted for 40 percent of total
began leaving the city of Cincinnati during the onset of suburban growth in the population growth.
1950s. In 1950, the population of the city of Cincinnati peaked at 503,998 but
decreased an average of 0.9 percent annually to 296,000 in 2011. From 2012 Age Cohort Trends
to 2018, the population of the city of Cincinnati grew an average of 0.3 percent Overall population growth in the HMA from 2013 through 2018 occurred mostly
annually because of job growth and a rising demand for urban living. As of among people aged 18 to 39 years. This age cohort increased by an average
Comprehensive Housing Market Analysis Cincinnati, Ohio-Kentucky-Indiana
U.S. Department of Housing and Urban Development, Office of Policy Development and ResearchCincinnati, Ohio-Kentucky-Indiana Comprehensive Housing Market Analysis as of October 1, 2019 Population and Households 11
of 7,475 people, or 1.2 percent, a year (ACS 1-year estimates). During the same percent in 2010 (Figure 8). The homeownership rate declined since 2010 largely
period, the portion of the population aged 18 years and younger decreased by because renter households accounted for 92 percent of household growth
an average of 1,300 people, or 0.2 percent, annually. The cohort aged 40 to since 2010. By comparison, renter households accounted for only 30 percent of
64 years decreased by an average of 4,250 people, or 0.6 percent, a year. The additional households in the 2000s. The current estimated number of households
retirement age portion of the population, generally defined as residents aged in the Hamilton County submarket is 344,900, up an average of 1,150 households,
65 and older, was the fastest-growing age cohort in percentage terms, up 2.5 or 0.3 percent, annually since 2010, which is in contrast with the average
percent or by an average of 7,375 people annually during the period. Access to decrease of 1,275 households, or 0.4 percent, annually from 2000 through
healthcare services attracted retirees from outside the HMA and incentivized 2010. Slower population growth since 2010 in the other submarkets resulted
current residents to retire in place. The slowing of net natural increase in the in a noticeably lower rate of household creation in the Ohio Suburban and the
HMA is tied, in part, to an increasing number of people at or above retirement Southwestern Counties submarkets. In the Ohio Suburban submarket, household
age. During 2018, the population aged 65 years and older accounted for 15 growth declined from an average annual increase of 1.6-percent from 2000
percent of the population, up from 13 percent in 2013 (Figure 7). to 2010, to 0.7-percent average annual growth since 2010. The annual rate of
household growth in the Southwestern Counties submarket fell from an average
Figure 7. Population by Age Range in the Cincinnati HMA 1.1 percent during the 2000 to 2010 period, to an average of 0.5 percent a year
2013 2018 since 2010. Currently, an estimated 326,500 and 195,800 households are in the
Ohio Suburban and the Southwestern Counties submarkets, respectively.
35
30 Figure 8. Households by Tenure and Homeownership Rate
in the Cincinnati HMA
25
Population (%)
Owner Renter Homeownership Rate
20
1,000,000 68
15
67.2% 67.3%
800,000 67
Homeownership Rate (%)
10
5
Households
600,000 66
0
Under 18 18-39 Years 40-64 Years 65 Years and Over 400,000 65
Source: U.S. Census Bureau
200,000 64.5% 64
Household Trends 0 63
An estimated 867,300 households resided in the Cincinnati HMA as of October 1, 2000 2010 Current
2019, up by an average of 4,450 households, or 0.5 percent, annually since 2010. Note: The current date is October 1, 2019.
The current homeownership rate is estimated at 64.5 percent, down from 67.3 Sources: 2000 and 2010—2000 Census and 2010 Census; current—estimates by the analyst
Comprehensive Housing Market Analysis Cincinnati, Ohio-Kentucky-Indiana
U.S. Department of Housing and Urban Development, Office of Policy Development and ResearchCincinnati, Ohio-Kentucky-Indiana Comprehensive Housing Market Analysis as of October 1, 2019 Population and Households 12
Population and Household Growth Forecast
During the 3-year forecast period, the population of the Cincinnati HMA is During the next 3 years, continued economic growth will contribute to a small rise
expected to increase by an average of 10,200 people, or 0.5 percent, annually, in household growth in the HMA, which is expected to average 4,825 households,
reaching 2.23 million by October 1, 2022. Net in-migration is expected to or 0.6 percent, annually, reaching 881,700 households by October 1, 2022. This
account for 42 percent of the growth during the forecast period, as people growth is estimated to average approximately 0.4 percent annually in the Hamilton
continue to move to the HMA for work opportunities. Population growth in the County submarket, to approximately 349,000 households; 0.7 percent annually in
Hamilton County submarket is expected to continue at the average annual the Ohio Suburban submarket, to 333,900 households; and 0.5 percent annually in
rate of 0.3 percent a year from 2012 to current, because net out-migration the Southwestern Counties submarket, to 198,800 households.
is expected to shift to net in-migration at the same time that net natural
increase continues to slow. Population growth in the Ohio Suburban and the
Southwestern Counties submarkets is expected to remain relatively unchanged,
compared with the 2010 to current period, with estimated increases of 0.6 and
0.5 percent annually, respectively. The Ohio Suburban submarket is expected
to make up the largest share of population growth of the three submarkets
during the forecast period because of continued tendency to live in “New Urban”
planned areas, which are generally built with walkable blocks and streets,
housing and shopping in close proximity, and accessible public spaces (Figure 9).
Figure 9. Share of Forecast Population Growth
in the Cincinnati HMA, by Submarket
Hamilton County Ohio Suburban Southwestern Counties
23% 25%
53%
Source: Estimates by the analyst
Comprehensive Housing Market Analysis Cincinnati, Ohio-Kentucky-Indiana
U.S. Department of Housing and Urban Development, Office of Policy Development and ResearchCincinnati, Ohio-Kentucky-Indiana Comprehensive Housing Market Analysis as of October 1, 2019 Home Sales Market Conditions 13
Home Sales Market Conditions growth, and a decline in new homebuilding activity helped strengthen the
market. Since 2012, conditions have remained balanced, and average home
Sales Market—Cincinnati HMA sales and sales prices have increased.
Market Conditions: Balanced REO Sales and Delinquent Mortgages
The national housing market downturn had a less significant effect on the HMA
Since 2012, average home sales increased an average of 8 percent sales market than the nation in terms of the percentage of seriously delinquent
annually, and home sales prices increased an average of 3 percent mortgage loans and real estate owned (REO) properties in 2010, but the rate is
annually. currently slightly elevated compared with the national rate. The rate of seriously
delinquent mortgage loans and REO properties peaked at 6.5 percent in the
Current Conditions HMA in January and February 2010, compared with the 8.6-percent peak rate
The home sales market in the Cincinnati HMA is currently balanced, with an in the nation during the same months (CoreLogic, Inc.). As of September 2019,
estimated 1.5 percent vacancy rate, down from 2.5 percent in April 2010 when the rate in the HMA was 1.6 percent, down from 1.8 percent a year ago; that
the market was soft (Table 4). During September 2019, the HMA had 2.0 months proportion is above the 1.4 percent rate for the nation. The rate is currently
of available for-sale inventory, down from 2.5 months a year earlier and below a slightly elevated in the HMA because the Hamilton County submarket sales
recent peak of 8.8 months of available inventory in 2010 (CoreLogic, Inc.). Sales market has improved at a slower pace than the other submarkets. Figure 10
market conditions were generally balanced in the early 2000s, but they began shows the rates of seriously delinquent mortgage loans and REO properties in
to soften in 2006 and softened further with the onset of the Great Recession each of the three submarkets.
and the subsequent housing market downturn. Conditions remained soft
Figure 10. Rate of Seriously Delinquent Loans and REO Properties
through 2011, but economic growth, a modest improvement in population in the Cincinnati HMA Submarkets and the Nation
Hamilton County Submarket Southwestern Counties Submarket
Table 4. Home Sales Quick Facts in the Cincinnati HMA Ohio Suburban Submarket Nation
Cincinnati HMA Nation 9.0
Vacancy Rate 1.5% NA 8.0
Seriously Delinquent Loans
and REO Properties (%)
Months of Inventory 2.0 3.2 7.0
Total Home Sales 39,200 6,114,000 6.0
Home Sales 1-Year Change -3% -5% 5.0
Quick Facts New Home Sales Price $355,300 $384,600 4.0
3.0
1-Year Change 4% 2%
2.0
Existing Home Sales Price $196,800 $294,500
1.0
1-Year Change 5% 3%
0.0
Mortgage Delinquency Rate 1.6% 1.4%
Se 0
06
Se 8
Se 5
Se 9
04
Se 2
Se 3
Se 7
Se 1
Se 0
Se 5
Se 6
Se 8
19
12
Se 3
14
Se 7
Se 1
0
0
0
0
0
0
0
0
1
1
1
1
1
1
1
p-
p-
p-
p-
p-
p-
p-
p-
p-
p-
NA = data not available.
p-
p-
p-
p-
p-
p-
p-
p-
p-
p-
Se
Se
Se
Se
Se
Notes: The vacancy rate is as of the current date (October 1, 2019). Home sales and prices are for the 12 months
ending September 2019. Months of inventory and mortgage delinquency data are as of September 2019. Note: REO = real estate owned.
Sources: CoreLogic, Inc.; Metrostudy, A Hanley Wood Company Source: CoreLogic, Inc.
Comprehensive Housing Market Analysis Cincinnati, Ohio-Kentucky-Indiana
U.S. Department of Housing and Urban Development, Office of Policy Development and ResearchCincinnati, Ohio-Kentucky-Indiana Comprehensive Housing Market Analysis as of October 1, 2019 Sales Market—Cincinnati HMA 14
Home Sales
Although sales market conditions have improved in the Cincinnati HMA, home past 12 months, approximately 61 percent of all home sales in the HMA were in the
sales (which includes new and existing homes) have been constrained compared $100,000 to $299,999 price range, and 20 percent were below $100,000 (Figure 13).
with the previous decade. The recent constraint is partly because population
Figure 12. 12-Month Average Home Sales Price by
growth has not returned to previous levels, existing inventory is generally low, and
Type of Sale in the Cincinnati HMA
a shortage of skilled workers has limited the construction of new homes. Home
sales in the HMA totaled 39,200 sales during the 12 months ending September Existing Home Sales New Home Sales
2019, which was a decline of less than 3 percent from a year ago, compared 400,000
with the 1 percent decrease during the same period a year earlier (Figure 11; 350,000
Average Sales Price ($)
Metrostudy, A Hanley Wood Company). From 2012 through 2017, a period that
300,000
also included economic expansion in the HMA, home sales increased an average
11 percent a year, to 40,650 sales. Despite this increase, home sales are below 250,000
the peak of 44,850 homes sold during the 12 months ending September 2006. 200,000
150,000
Figure 11. 12-Month Total Home Sales by Type in the Cincinnati HMA
100,000
Existing Home Sales New Home Sales
06
08
09
07
0
5
6
8
9
2
3
4
7
1
p-1
p-1
p-1
p-1
p-1
p-1
p-1
p-1
p-1
p-1
45,000
p-
p-
p-
p-
Se
Se
Se
Se
Se
Se
Se
Se
Se
Se
Se
Se
Se
Se
40,000
Note: New and existing home sales include single-family homes, townhomes, and condominiums.
35,000 Source: Metrostudy, A Hanley Wood Company
30,000
Total Sales
25,000
Figure 13. Share of Home Sales by Price Range During the
20,000
12 Months Ending September 2019 in the Cincinnati HMA
15,000
10,000 Existing Home Sales New Home Sales
5,000
60
0
50
06
08
09
07
0
5
6
8
9
2
3
4
7
1
p-1
p-1
p-1
p-1
p-1
p-1
p-1
p-1
p-1
p-1
Share of Sales (%)
p-
p-
p-
p-
Se
Se
Se
Se
Se
Se
Se
Se
Se
Se
Se
Se
Se
Se
40
Note: New and existing home sales include single-family homes, townhomes, and condominiums. 30
Source: Metrostudy, A Hanley Wood Company
20
Home Sales Prices 10
Home sales prices in the HMA have generally increased since 2012 (Figure 12).
0
From 2012 through 2017, the average home sales price increased an average of $0 to $100k to $200k to $300k to $400k to $500k to $600k and
3 percent annually (Metrostudy, A Hanley Wood Company). During the 12 months $99k $199k $299k $399k $499k $599k Higher
ending September 2019, the average sales price of a home in the Cincinnati HMA Note: New and existing home sales include single-family homes, townhomes, and condominiums.
was $203,300, an increase of more than 2 percent from a year ago. During the Source: Metrostudy, A Hanley Wood Company
Comprehensive Housing Market Analysis Cincinnati, Ohio-Kentucky-Indiana
U.S. Department of Housing and Urban Development, Office of Policy Development and ResearchCincinnati, Ohio-Kentucky-Indiana Comprehensive Housing Market Analysis as of October 1, 2019 Sales Market—Hamilton County Submarket 15
Housing Affordability During the third quarter of 2019, according to the HOI, the Cincinnati HMA was
Homeownership in the Cincinnati HMA is generally affordable, although the more affordable than 191, or 81 percent, of the 237 ranked metropolitan areas
affordability of buying a home in the HMA has trended downwards since the in the nation. Despite the recent increase in affordability, the HOI is below the
early 2010s, when more distressed homes were on the market during the high of 90.6 reached during the fourth quarter of 2012, when a relatively large
foreclosure crisis. Many of those homes have since been sold, putting upward number of distressed homes for sale placed downward pressure on home
prices. During the fourth quarter of 2012, for-sale housing in the HMA was more
pressure on sales prices despite only moderate income growth in the HMA.
affordable than 197, or 83 percent, of the ranked metropolitan areas in the
The National Association of Home Builders’ (NAHB) and Wells Fargo Housing
nation. The absorption of distressed properties has contributed to the decline
Opportunity Index (HOI) for the HMA was 83.3 during the third quarter of 2019,
in affordability as home prices in the HMA have increased at a faster rate than
up from 80.2 during the third quarter of 2018 (Figure 14). The recent increase
income since the early 2010s.
was likely because the gap between median income growth and median home
price growth contracted. During the third quarter of 2019, median income and Forecast
median home price increased 4 and 7 percent, respectively, compared with During the next 3 years, demand is expected for an estimated 13,775 new homes
5 and 13 percent, respectively, during the third quarter of 2018. By comparison, in the HMA (Table 5). The 1,530 homes currently under construction will satisfy
the median home price in the HMA increased 33 percent from the fourth a portion of the demand. Most of the demand will be for new homes priced
quarter of 2012 through the fourth quarter of 2017, as compared to a cumulative from $200,000 and $299,999, and this demand will occur mostly in the Ohio
increase of only 5 percent for the median income during the same period. Suburban submarket because of ongoing construction of “New Urban”-style
planned communities. Demand is anticipated to decrease each year of the
Figure 14. Cincinnati HMA Housing Opportunity Index forecast as job gains and population growth stabilize.
92 Table 5. Demand for New Home Sales Units in the Cincinnati HMA
During the Forecast Period
NAHB Housing Opportunity Index
90 Sales Units
Demand 13,775 Units
88 Under Construction 1,530 Units
Note: The forecast period is from the current date (October 1, 2019), to October 1, 2022.
86 Source: Estimates by the analyst
84
82
Sales Market—Hamilton
80
County Submarket
Current Conditions
15
12
16
18
19
13
14
17
20
20
20
20
20
20
20
20
The sales housing market in the Hamilton County submarket is currently slightly
3Q
3Q
3Q
3Q
3Q
3Q
3Q
3Q
3Q = third quarter. NAHB = National Association of Home Builders.
tight, with an estimated 1.6-percent vacancy rate, down from 3.0 percent
Sources: NAHB; Wells Fargo in 2010 when the market was soft (Table 6). During September 2019, the
Comprehensive Housing Market Analysis Cincinnati, Ohio-Kentucky-Indiana
U.S. Department of Housing and Urban Development, Office of Policy Development and ResearchCincinnati, Ohio-Kentucky-Indiana Comprehensive Housing Market Analysis as of October 1, 2019 Sales Market—Hamilton County Submarket 16
Table 6. Home Sales Quick Facts in the Hamilton County Submarket Figure 15. 12-Month Total Home Sales by Type
in the Hamilton County Submarket
Hamilton County Cincinnati
Submarket HMA Existing Home Sales New Home Sales
Vacancy Rate 1.6% 1.5%
16,000
Months of Inventory 2.1 2.0
14,000
Total Home Sales 15,350 39,200
12,000
Home Sales
Total Home Sales
1-Year Change -3% -3%
Quick Facts 10,000
New Home Sales Price $461,100 $355,300
8,000
1-Year Change 23% 4%
6,000
Existing Home Sales Price $199,000 $196,800 4,000
1-Year Change 5% 5% 2,000
Mortgage Delinquency Rate 1.9% 1.6% 0
Notes: The vacancy rate is as of the current date (October 1, 2019). Home sales and prices are for the 12 months
06
08
09
07
0
5
6
8
9
2
4
3
7
1
p-1
p-1
p-1
p-1
p-1
p-1
p-1
p-1
p-1
p-1
ending September 2019. Months of inventory and mortgage delinquency data are as of September 2019.
p-
p-
p-
p-
Se
Se
Se
Se
Se
Se
Se
Se
Se
Se
Se
Se
Se
Se
Sources: CoreLogic, Inc.; Metrostudy, A Hanley Wood Company
Note: New and existing home sales include single-family homes, townhomes, and condominiums.
submarket had 2.1 months of available for-sale inventory, down from 2.6 months Source: Metrostudy, A Hanley Wood Company
a year earlier, and down from the 8.5-month peak in 2010. Despite improved
of 13 percent annually, to 6,875 homes sold in 2011. The sales market in the
sales market conditions, the homeownership rate in the submarket declined
Hamilton County submarket began improving in 2012, and sales increased at
2.8 percentage points to 56.7 percent since 2010; homeownership in the
an average annual rate of 12 percent, from 2012 through 2018 to 15,450 sales.
submarket has historically been the lowest in the HMA because of a stronger
During the 12 months ending September 2019, 15,200 existing homes were
preference to rent. Large-scale, single-family residential construction in the
sold, down 2 percent from the same period 1 year ago but comprising 99 percent
Hamilton County submarket is more limited than the other submarkets because
of total sales in the submarket.
it is almost completely built out. New construction primarily occurs as a result of
redevelopment and infill, particularly in the city of Cincinnati. From the 12 months ending September 2006, when the average existing home
sales price was $169,900 through 2018, existing home sales prices generally
Existing Home Sales and Prices increased an average of 1 percent annually (Figure 16). During the 12 months
Existing home sales in the Hamilton County submarket have increased from ending September 2019, the average existing home sales price grew 5 percent
the number of homes sold during the local housing market downturn and to $199,000. Approximately 11 percent of existing sales were priced above
are above the 14,050 homes sold during the 12 months ending September $400,000 during the 12 months ending September 2019 (Figure 17), making
2006, when home lending standards were more lenient and new home sales this submarket the most expensive for existing home sales, despite an elevated
were higher (Figure 15). In response to tighter mortgage lending standards proportion of seriously delinquent mortgage loans and REO properties, which
and the local economic downturn, existing home sales declined an average put downward pressure on the average sale price.
Comprehensive Housing Market Analysis Cincinnati, Ohio-Kentucky-Indiana
U.S. Department of Housing and Urban Development, Office of Policy Development and ResearchCincinnati, Ohio-Kentucky-Indiana Comprehensive Housing Market Analysis as of October 1, 2019 Sales Market—Hamilton County Submarket 17
Figure 16. 12-Month Average Home Sales Price by Type of Sale
in the Hamilton County Submarket
New Home Sales and Prices
Unlike existing home sales, new home sales in the Hamilton County submarket
Existing Home Sales New Home Sales peaked during the 12 months ending September 2006, at 1,675 homes sold,
500,000
and comprised 11 percent of home sales. New home sales declined each of the
450,000
400,000 6 subsequent years, by an average of 26 percent annually, to 260 homes sold
Average Sales Price ($)
350,000 in 2012. New home sales rose to an average of 400 sales annually from 2013
300,000 through 2018, when net out-migration slowed, but during the 12 months ending
250,000 September 2019, approximately 150 new homes sold, down 59 percent from
200,000 the same 12-month period 1 year ago.
150,000
100,000 The average new home sales price has generally trended upward since 2011, with
50,000 a decline in 2018. During the 12 months ending September 2019, the average
0 sales price of a new home increased 23 percent to $461,100, offsetting an average
decrease of 9 percent during the 12 months ending September 2018. At 35
06
08
09
07
0
5
6
8
9
2
3
4
7
1
p-1
p-1
p-1
p-1
p-1
p-1
p-1
p-1
p-1
p-1
p-
p-
p-
p-
percent, the submarket had the highest proportion of new homes priced at or
Se
Se
Se
Se
Se
Se
Se
Se
Se
Se
Se
Se
Se
Se
Note: New and existing home sales include single-family homes, townhomes, and condominiums. above $400,000 during the 12 months ending September 2019. Before that, the
Source: Metrostudy, A Hanley Wood Company
average new home sales price remained relatively unchanged from 2007 through
Figure 17. Share of Home Sales by Price Range During the 12 Months 2010, partly because of decreased home sales demand, and then increased by an
Ending September 2019 in the Hamilton County Submarket average of 7 percent a year from 2011 through 2017 to $404,700.
Existing Home Sales New Home Sales Sales Permit Activity
Homebuilding activity, as measured by the number of single-family homes,
60
townhomes, and condominiums (hereafter, homes) permitted, has increased
50 since 2010, but fewer new homes have been permitted compared with the
Share of Sales (%)
40 early-to-mid 2000s (Figure 18). From 2000 through 2005, before the Great
30 Recession and national housing crisis, an average of 1,525 homes were
permitted annually. In response to the local economic contraction and housing
20
market downturn, the number of homes permitted decreased to an average of
10 810 homes annually from 2006 through 2008, before declining further to 330
0 homes permitted during 2009. By 2010, production began to increase again,
$0 to $150k to $250k to $400k and and from 2010 through 2017, a period when net out-migration was slowing, an
$149k $249k $399k Higher average of 630 homes were permitted annually. During the 12 months ending
Note: New and existing home sales include single-family homes, townhomes, and condominiums.
September 2019, 710 homes were permitted, down from 790 homes permitted
Source: Metrostudy, A Hanley Wood Company during the previous year (preliminary data, with adjustments by the analyst).
Comprehensive Housing Market Analysis Cincinnati, Ohio-Kentucky-Indiana
U.S. Department of Housing and Urban Development, Office of Policy Development and ResearchCincinnati, Ohio-Kentucky-Indiana Comprehensive Housing Market Analysis as of October 1, 2019 Sales Market—Ohio Suburban Submarket 18
Figure 18. Average Annual Home Sales Permitting Activity former golf course, the first phase of Greenside Estates began construction in
in the Hamilton County Submarket March 2019. Approximately 31 single-family homes are expected at buildout in
Single-Family Homes/Townhomes Condominiums 2021, and prices will start at $399,000 for a two-bedroom home.
1,600
1,400 Forecast
1,200 During the next 3 years, demand is estimated for 2,975 new homes in the
1,000 Hamilton County submarket (Table 7). Demand is likely to be strongest in the
800 first year and is likely to decline slightly each subsequent year. The 300 units
600 currently under construction will satisfy a portion of this demand. Condominium
400 construction is likely to occur in the city of Cincinnati, and homebuilding is
200 expected to occur outside the city limits.
0
09 Table 7. Demand for New Home Sales Units in the Hamilton County
9
5
8
7
Submarket During the Forecast Period
01
00
00
01
20
-2
-2
-2
-2
18
10
00
06
20
Sales Units
20
20
20
Demand 2,975 Units
Note: Data for 2019 are through September 2019.
Sources: U.S. Census Bureau, Building Permits Survey; 2000 through 2017—final data and estimates by the Under Construction 300 Units
analyst; 2018 and 2019—preliminary data and estimates by the analyst Note: The forecast period is from the current date (October 1, 2019), to October 1, 2022.
Source: Estimates by the analyst
From 2000 through 2009, approximately 17 percent of all homes permitted in
the submarket were condominiums, but since 2010, that proportion has dropped Sales Market—Ohio
to 6 percent. The submarket still has the highest proportion of condominium
construction in the HMA, partly because of more limited developable land and
Suburban Submarket
a desire to live in urban centers. Current Conditions
The sales housing market in the Ohio Suburban submarket is currently balanced,
New Construction with an estimated vacancy rate of 1.5 percent, down from 2.0 percent in April
Most new home construction in the Hamilton County submarket has occurred 2010 (Table 8). The homeownership rate in the submarket declined from 73.5
in the city of Cincinnati and in nearby suburban areas. In the downtown and percent in 2010 to a current estimate of 69.6 percent, the same rate as in the
Over-the-Rhine (OTR) neighborhoods of Cincinnati, over $1 billion has been Southwestern Counties submarket. The submarket has generally had the highest
invested in redevelopment and new construction since 2004, including the $7.2 homeownership rate in the HMA because of its central location between the cities
million Rennen & Beecher Flats, an 18-unit mixed-use condominium property of Cincinnati and Dayton, both in Ohio, and the availability of developable land.
in OTR completed in January 2019. Prices start in the mid-$200,000s for a 750 Although new home sales in the submarket have been subdued since the end
square-foot, one-bedroom condominium. There are several single-family home of the housing market crisis, existing home sales surpassed prerecession levels
subdivisions underway in areas near, but outside of, the city of Cincinnati. To during the 12 months ending August 2017 but have since declined; average home
the west of the city of Cincinnati, in Delhi Township along the Ohio River on a sales prices have surpassed prerecession levels.
Comprehensive Housing Market Analysis Cincinnati, Ohio-Kentucky-Indiana
U.S. Department of Housing and Urban Development, Office of Policy Development and ResearchYou can also read