BEST-PERFORMING CITIES 2020 - WHERE AMERICA'S JOBS ARE CREATED AND SUSTAINED - MICHAEL C.Y. LIN, PHD, JOE LEE, AND PERRY WONG - MILKEN INSTITUTE
←
→
Page content transcription
If your browser does not render page correctly, please read the page content below

BEST-PERFORMING
CITIES 2020
Where America’s Jobs Are
Created and Sustained

      Michael C.Y. Lin, PhD, Joe Lee, and Perry Wong

BEST-PERFORMING
CITIES 2020
Where America’s Jobs Are
Created and Sustained

      Michael C.Y. Lin, PhD, Joe Lee, and Perry Wong
ON THE WEB
                                                                                    Visit best-cities.org

ABOUT THE MILKEN INSTITUTE
The Milken Institute is a nonprofit, nonpartisan think tank.

For the past three decades, the Milken Institute has served as a
catalyst for practical, scalable solutions to global challenges by
connecting human, financial, and educational resources to those
who need them. Guided by a conviction that the best ideas, under-
resourced, cannot succeed, we conduct research and analysis and
convene top experts, innovators, and influencers from different
backgrounds and competing viewpoints. We leverage this expertise
and insight to construct programs and policy initiatives.

These activities are designed to help people build meaningful lives
in which they can experience health and well-being, pursue effective
education and gainful employment, and access the resources
required to create ever-expanding opportunities for themselves and
their broader communities.

ABOUT THE CENTER FOR REGIONAL ECONOMICS
The Center for Regional Economics produces research, programs,
and events designed to inform and activate innovative economic and
policy solutions to drive job creation and industry expansion.

©2020 Milken Institute
This work is made available under the terms of the Creative Commons Attribution-
NonCommercial-NoDerivs 3.0 Unported License, available at http://creativecommons.
org/licenses/by-nc-nd/3.0/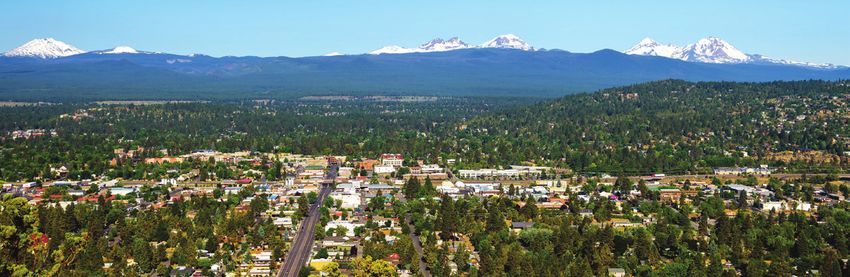
Table of Contents
  EXECUTIVE SUMMARY............................................................................................1
       Best-Performing Large City............................................................................................. 2
       Biggest Gains......................................................................................................................3
       Best-Performing Small City.............................................................................................3

  INTRODUCTION........................................................................................................4
       An Emphasis on Outcomes............................................................................................ 5
       National Economic Conditions..................................................................................... 6
       Biggest Gains.................................................................................................................... 7
       Biggest Drops................................................................................................................... 8

  TOP 25 BEST-PERFORMING LARGE CITIES.......................................................9

  COMPLETE RESULTS: 2020 BEST-PERFORMING LARGE CITIES.............. 24

  TOP 10 BEST-PERFORMING SMALL CITIES.................................................... 29

  COMPLETE RESULTS: 2020 BEST-PERFORMING SMALL CITIES.............. 37

  ENDNOTES............................................................................................................... 42

  ACKNOWLEDGMENTS......................................................................................... 49

  ABOUT THE AUTHORS......................................................................................... 49
Executive Summary
How did US regional economies                                   Here are the highlights of the 2020 rankings:
perform recently? What are the key                                ▪▪San Francisco-Redwood City-South San Francisco,
factors driving their growth and                                    CA, regains the crown as the best-performing
                                                                    large metro after 2014. The skilled workforce,
decline? The Milken Institute’s                                     abundant venture capital (VC), and innovation
Best-Performing Cities series has                                   and entrepreneurial culture support regional high
tracked the economic performance of                                 value-added industries, including the expanding
                                                                    tech and biotech industries. The metro’s excellent
US metros for two decades using job,                                performance in our five-year high-tech GDP
wage and salary, and high-tech                                      growth (ranked first) illustrates this point.
gross domestic product (GDP)                                      ▪▪Twenty-one top-performing large metros return
indicators. Metros are ranked on                                    from our 2018 Best-Performing Large Cities Index.
                                                                    A substantial number of them are metros with
their performance, while indicators                                 dynamic tech sectors, including San Francisco-
help identify the drivers behind their                              Redwood City-South San Francisco, CA; Provo-
success or failure. With this publication,                          Orem, UT; Austin-Round Rock, TX; and San Jose-
                                                                    Sunnyvale-Santa Clara, CA. Others, like Reno,
we hope metros will learn from others’                              NV, continue to develop a diverse industrial base
experiences and enhance urban                                       while experiencing rapid growth in the advanced
economies in the long run.                                          manufacturing and technology sectors.

                                                                  ▪▪California secured four (San Francisco-
                                                                    Redwood City-South San Francisco, CA; San Jose-
                                                                    Sunnyvale-Santa Clara, CA; Oakland-Hayward-
                                                                    Berkeley, CA; and Riverside-San Bernardino-
                                                                    Ontario, CA) of the Top 25 spots among large
                                                                    metros. The Bay Area in Northern California
                                                                    consistently shows economic excellence powered
                                                                    by high value-added industries.

                                                                  ▪▪For the fourth straight year, Bend, OR, ranks
                                                                    first in our Best-Performing Small Cities list.
                                                                    Compared with other small metros, the region
                                                                    has a rather diverse industrial composition with a
                                                                    well-developed, niche tech scene in e-commerce
                                                                    and vehicle technology. Bend’s entrepreneurial
                                                                    community has also helped grow its tech sector.

                              BEST-PERFORMING CITIES 2020            EXECUTIVE SUMMARY
                                                            1
       WHERE AMERICA’S JOBS ARE CREATED AND SUSTAINED
Overall, metros with strong tech industries remain                 TABLE 1. TOP 25 BEST-PERFORMING LARGE CITIES
the superstars of regional economies. One key factor               Rank according to 2020 index
in the success of these tech powerhouses is their
                                                                   Metropolitan Statistical Area /      2020   2018
ability to engage in new technologies. For instance,               Metropolitan Division                Rank   Rank
                                                                                                                    Change
metros in the Bay Area/Silicon Valley area of California
                                                                   San Francisco-Redwood City-South
(San Francisco-Redwood City-South San Francisco,                   San Francisco, CA
                                                                                                          1      4     3
CA, and San Jose-Sunnyvale-Santa Clara, CA) lead
                                                                   Provo-Orem, UT                         2      1    -1
tech innovation.
                                                                   Austin-Round Rock, TX                  3      3   Steady
In contrast, other top-ranked metros like Reno, NV,                Reno, NV                               4     11     7
take part in the new wave of the tech-driven economy,
                                                                   San Jose-Sunnyvale-Santa Clara, CA    5T      2    -3
albeit with different approaches. The arrival of Tesla’s
                                                                   Orlando-Kissimmee-Sanford, FL         5T      7     2
Gigafactory 1 transformed that metro’s economic
landscape. And while the metro is far from becoming                Boise, ID                              7     12     5
a hub for developing new technologies, it hosts an                 Seattle-Bellevue-Everett, WA           8      8   Steady
emerging cluster of data centers. Still others, like               Dallas-Plano-Irving, TX                9      5    -4
Charleston-North Charleston, SC, and Spartanburg,                  Palm Bay-Melbourne-Titusville, FL     10     57    47
SC, prosper through advanced manufacturing and a
                                                                   Raleigh, NC                           11      6    -5
heavy reliance on international trade. However, the
                                                                   Phoenix-Mesa-Scottsdale, AZ           12     20     8
ongoing trade tensions between the US and China and
other countries may soon present challenges for those              Charleston-North Charleston, SC       13     16     3

export-oriented metros.                                            Nashville-Davidson-Murfreesboro-
                                                                                                         14     25    11
                                                                   Franklin, TN
                                                                   Spartanburg, SC                       15     28    13

Best-Performing Large City: San                                    Charlotte-Concord-Gastonia,
                                                                   NC-SC
                                                                                                         16     13    -3

Francisco-Redwood City-South                                       Oakland-Hayward-Berkeley, CA          17     14    -3

San Francisco, CA                                                  Denver-Aurora-Lakewood, CO            18     24     6
                                                                   Olympia-Tumwater, WA                  19     19   Steady
San Francisco-Redwood City-South San Francisco, CA,                Greeley, CO                           20     42    22
is the US tech powerhouse, consistently appearing
                                                                   Fort Collins, CO                      21      9   -12
in our top-performing list. The region performs
                                                                   Ogden-Clearfield, UT                  22     21    -1
particularly well in the one- and five-year wage growth
and high-tech GDP concentration, all ranking second.               Cape Coral-Fort Myers, FL             23     46    23

Its five-year high-tech GDP growth tops all large                  Portland-Vancouver-Hillsboro,
                                                                                                         24     33     9
                                                                   OR-WA
metropolitan statistical areas (MSAs) in our index.
The information industry continues to add jobs to the              Riverside-San Bernardino-Ontario,
                                                                                                        25T     15   -10
                                                                   CA
metro, while the region’s biotech industry also has
                                                                   Salt Lake City, UT                   25T     10   -15
expanded due to strong research and development
                                                                   Source: Milken Institute (2020)
(R&D) capacity from the University of California, San
Francisco, and Genentech, Inc.

                                     BEST-PERFORMING CITIES 2020                 EXECUTIVE SUMMARY
                                                                   2
              WHERE AMERICA’S JOBS ARE CREATED AND SUSTAINED
ON THE WEB
                                                                                       Visit best-cities.org
Biggest Gains
Recent rising demand in energy and natural resources,
such as coal and natural gas, uplifts several resource-
dependent metros in our index, including Tuscaloosa,
AL; Grand Junction, CO; Odessa, TX; and Wheeling,
WV-OH. The Wheeling, WV-OH, metro is the biggest
gainer among all metro areas in our index, jumping
111 spots to 70th place. Other big gainers include
California-Lexington Park, MD, and Clarksville, TN-KY,
two regional economies anchored by the defense
industry. Still, other big gainers, including Sebring, FL;
Carson City, NV; and Kingston, NY, have health care,
retirement communities, and tourism driving their
economic growth.

Best-Performing Small City:
Bend-Redmond, OR
The Bend-Redmond, OR, metro is the best-performing
small city for the fourth year running. Its one- and five-
year job and wage growth are all strong in our index,
and the five-year (2012-2017) wage growth tops all
small metros. The region performs impressively in
five-year high-tech GDP growth (2013-2018) and
high-tech GDP concentration (2018), both ranking
fifth. The metro’s collaborative environment facilitates
entrepreneurial activities, particularly for high-tech
startups. Meanwhile, Oregon State University-
Cascades and Central Oregon Community College
provide a skilled workforce to the local labor markets.

                                 BEST-PERFORMING CITIES 2020       EXECUTIVE SUMMARY
                                                               3
          WHERE AMERICA’S JOBS ARE CREATED AND SUSTAINED
Introduction
America’s metropolitan areas are the                               and public-policy groups monitor and evaluate how
                                                                   well their metro promotes economic vitality relative
nation’s economic growth engines.
                                                                   to the rest of the country. The index also provides
They drive US economic growth by                                   benchmarking data that can inform approaches to
upgrading industries and creating jobs                             improving a region’s performance over time. The index
                                                                   can serve as a tool for understanding real estate,
through policy choices and industrial,
                                                                   consumer, and business opportunities by indicating
workforce, and innovation assets.                                  where employment is stable and expanding, wages
However, not all metro areas grow                                  and salaries are increasing, and economies and
                                                                   businesses are thriving.1
equally. Some parts of the country
are thriving while others are failing                              A shared understanding of regional competitiveness
                                                                   will help communities create a strategic economic
to keep up. The Milken Institute’s                                 vision focused on industries with the capacity to
Best-Performing Cities Index provides                              stimulate sustained growth and prosperity. By targeting
                                                                   local sectors with a robust competitive advantage,
an objective benchmark to examine
                                                                   communities can seek to reduce the impact that
the factors underlying growth in these                             future dips in the business cycle may have on local
metros while identifying their unique                              employment and economic activity. Regions that better
                                                                   link education and training programs to the workforce
economic characteristics.
                                                                   needs of employers will attract businesses and
                                                                   create more opportunities for residents. Developing
Our Best-Performing Cities Index uses an outcomes-                 new industries and companies will require fostering
based set of metrics—including job creation, wage                  entrepreneurship and innovation through research
gains, and technological developments—to evaluate                  institutions, incubators, and funding programs.
the relative growth of metropolitan areas. While
national and international political and economic                  Knowledge-based economies—those with innovation
forces beyond a region’s control can affect near-                  industries and skilled labor at their core—have done
term performance, the top-performing metros                        well on the Best-Performing Cities Index by adapting
have cohesive strategies allowing them to weather                  to economic and political changes. They take different
economic storms and leverage their assets more                     forms, with some innovation hubs excelling despite
effectively. These metros offer important lessons                  high housing costs and a heavy regulatory burden, while
that are helpful to peer regions.                                  others have attracted workers and firms away from
                                                                   the coasts with lower costs of living and doing business.
The Best-Performing Cities Index’s goal is to help
academics, businesses, development agencies,                       This 2020 edition of the Best-Performing Cities Index
government officials, industry associations, investors,            applies the same methodology used in prior years.

                                     BEST-PERFORMING CITIES 2020             INTRODUCTION
                                                                   4
              WHERE AMERICA’S JOBS ARE CREATED AND SUSTAINED
We employ the geographic terms and definitions TABLE 2. COMPONENTS OF THE
used by the Office of Management and Budget BEST-PERFORMING CITIES INDEX
(OMB), most recently updated after the 2010 US
Component Weight
census. The OMB defines a metropolitan statistical
Job growth (I=2013) 0.143
area (MSA) as a region generally comprising a large
population nucleus and adjacent territory with a high Job growth (I=2017) 0.143
degree of economic and social integration, as measured Wage and salary growth (I=2012) 0.143
by community ties. With these parameters, the agency Wage and salary growth (I=2016) 0.143
identifies 381 MSAs. Short-term job growth (Aug 18-Aug 19) 0.143
County population growth accounts for the creation of High-tech GDP growth (I=2013) 0.071
new MSAs. If specific criteria are met, an MSA with a High-tech GDP growth (I=2017) 0.071
single nucleus and a population of 2.5 million or more is High-tech GDP location quotient (2018) 0.071
further divided into geographic areas called metropolitan
Number of high-tech industries with GDP LQ>1 (2018) 0.071
divisions (MDs), of which there are currently 31 in
Note: I refers to the beginning year of the index. Weights do not add up to 1,
the country. For example, the MSA of Philadelphia- due to rounding.
Source: Milken Institute (2020)
Camden-Wilmington, DE-MD-NJ, comprises three MDs
(Camden, NJ; Philadelphia, PA; and Wilmington, DE).
We include the smaller MDs in the index to reflect more Employment and wage and salary growth are heavily
detailed geographic growth patterns. weighted because of their critical importance to
community vitality. These metrics signal the quality of
the jobs being created and retained. Other measures
reflect the concentration and diversity of technology
An Emphasis on Outcomes industries within the MSAs and MDs. High-tech
location quotients (LQs), which measure the industry’s
Table 2 shows the components used to calculate
concentration in a metro relative to the national
the Best-Performing Cities rankings. The index
average, are included to gauge an area’s participation
measures growth in jobs, wages, salaries, and
in the knowledge-based economy. We also measure
technology output over five years for jobs and
the number of specific high-tech fields (out of a
technology output (2013-2018) and for wages and
possible 19) whose concentrations in an MSA or MD
salaries (2012-2017) to adjust for extreme variations
are higher than the national average. Best-Performing
in business cycles. It also incorporates the latest
Cities is solely an outcomes-based index. It does not
available year’s performance in these areas.
incorporate input measures (business costs, cost-of-
In addition, the rankings include a measure of
living components, and quality-of-life conditions like
12-month job growth (August 2018-August 2019)
commute times and crime rates). These measures,
to capture recent momentum among metropolitan
although important, are prone to wide variations and
economies.2
can be highly subjective.
BEST-PERFORMING CITIES 2020 INTRODUCTION
5
WHERE AMERICA’S JOBS ARE CREATED AND SUSTAINEDNational Economic Conditions in 12 months—an average of 34,000 jobs per month.
Other major indicators, such as the Consumer Price
Long-term regional economic development and the Index and Producer Price Index, point to a subdued
temporary rise and fall of a metropolitan economy’s inflationary environment, though the national average
performance are often shaped by the fundamentals of hourly earnings has moved very little in the last
of regional economic structures and policies and 18 months.
the conditions of US and global macroeconomics. Considering recent US macro and international
2018 and 2019 were turbulent years for economies settings, regional economic growth in the US could
globally. While the US economy continues to be the be affected differently and disproportionally due
leading growth center among developed nations, trade to its industrial mix and orientation to the global
disputes and supply-chains disruptions presented market. The trade disputes between the United States
challenges in 2018 and 2019. As the International and China since 2018 have curbed US agricultural
Monetary Fund (IMF)’s World Economic Outlook products and automobile parts exports. From January
2019 describes, the world economy is at a stage to September 2019, US exports to China declined
of “subdued momentum, weak trade and industrial from $93 billion to $78 billion.9
production.”3 Global growth shrank to 3.6 percent in
2018 and is expected to slide further to 3 percent in The trade disputes could affect metro areas in
2019. On the domestic front, the US economy grew at states that export agricultural products, fish, and
2.9 percent in 2018 and a slower 2.1 percent increase hogs, such as Alaska, Arkansas, California, Iowa, and
in the third quarter of 2019. The pace of economic Massachusetts, as well as automobile-producing
expansion in the US has trailed downward since the states, such as Michigan and Ohio. The selection of
fourth quarter of 2018.4 categories of products and production for retaliation
by the Chinese government could also produce
Despite weaker growth in the last 12 months, US negative externalities on economic performance in
macroeconomic fundamentals are solid and job gains some US regional economies, though the impact on
stable. The September 2019 unemployment rate the latest 12-month employment would likely be small.
is 3.5 percent, reflecting a low level not seen since
May 1969.5 The US labor market also is tight. Many
economists considered that the US economy was at
nearly full employment at that time. However, demand
for skilled professionals remains high—a trend since
early 2012. US nonfarm payroll jobs grew by 266,000
in the latest reporting in November.6 It is, however,
worth noting that labor force growth in 2019 is at its
lowest level since 2009.7 Despite a robust job market
at this late stage of economic expansion, pressure on
raising wage levels is subdued. Personal income only
recently increased. In the last few months, disposable
personal income grew at 0.3 percent and declined in
October by 0.3 percent.8
In this mixed economic picture, technologies and
innovations are clear leaders in terms of growth and
job creation. Demand for skilled labor in information
and professional/technical services remains strong,
showing a healthy pace of job increase by 277,000
BEST-PERFORMING CITIES 2020 INTRODUCTION
6
WHERE AMERICA’S JOBS ARE CREATED AND SUSTAINEDBiggest Gains TABLE 3. BIGGEST GAINS AMONG ALL CITIES
(Based on change in rankings)
The biggest gainers this year (as shown in Table 3) Metropolitan Statistical Area / 2020 2018
Change
can be categorized into three major groups. The first Metropolitan Division Rank Rank
group contains resource-dependent metros, including Wheeling, WV-OH 70 181 111
Tuscaloosa, AL; Grand Junction, CO; Odessa, TX;
Midland, MI 43 148 105
and Wheeling, WV-OH. Among them, the Wheeling,
Odessa, TX 47 138 91
WV-OH, metro is the biggest gainer among all
metro areas in our index, jumping 111 spots to 70th Florence, SC 26 111 85
place. Although each of these four metros has other Winston-Salem, NC 82 160 78
industrial sectors, the rising demand for natural gas Hot Springs, AR 85 160 75
domestically and coal internationally played a key role Las Cruces, NM 102 173 71
in driving these economies.
Clarksville, TN-KY 110 178 68
The second camp features cities with a large defense Tuscaloosa, AL 41 107 66
industry presence, fueled by increased spending in the State College, PA 28 83 55
sector. Palm Bay-Melbourne-Titusville, FL; Savannah,
Kingston, NY 54 108 54
GA; California-Lexington Park, MD; Ocean City, NJ;
Sebring, FL 78 130 52
Las Cruces, NM; and Clarksville, TN-KY, fall into this
camp. The third category comprises metros with a Grand Junction, CO 81 131 50
large presence of health care, retirees, and tourism. Palm Bay-Melbourne-Titusville, FL 10 57 47
Representatives of this group include Hot Springs, AR; Salinas, CA 41 88 47
Sebring, FL; Carson City, NV; and Kingston, NY. The Lebanon, PA 40 86 46
remaining metros in the biggest gain list have other Bloomington, IN 69 115 46
industrial mixes.
California-Lexington Park, MD 112 158 46
Dubuque, IA 120 164 44
Savannah, GA 66 108 42
Carson City, NV 21 63 42
Vineland-Bridgeton, NJ 110 152 42
Brunswick, GA 31 72 41
Ocean City, NJ 95 136 41
Rockford, IL 144 184 40
Source: Milken Institute (2020)
BEST-PERFORMING CITIES 2020 INTRODUCTION
7
WHERE AMERICA’S JOBS ARE CREATED AND SUSTAINEDBiggest Drops TABLE 4. BIGGEST DECLINES AMONG ALL CITIES
(Based on change in rankings)
The metros falling the furthest in this edition of the Metropolitan Statistical Area / 2020 2018
Change
index have public-sector money playing an outsized Metropolitan Division Rank Rank
role in their economies relative to other industries. Iowa City, IA 150 57 -93
The other feature common to the group is that 14 of
Manhattan, KS 156 76 -80
the 25 experienced population loss.
Kokomo, IN 126 51 -75
Agriculture, logistics, and manufacturing are all sectors Hammond, LA 132 61 -71
represented in the metro areas seeing the most
Lawrence, KS 116 46 -70
significant declines. The trade war has apparently
Appleton, WI 139 69 -70
hurt these sectors, since they are interconnected not
only to each other but also to the ups and downs Bowling Green, KY 108 39 -69
of international markets. Metros experiencing large Dover, DE 118 49 -69
declines are, for the most part, small cities—only five Lansing-East Lansing, MI 154 89 -65
large metros made this list. In many of these small Albany, GA 160 98 -62
cities, local universities or state governments are the
Battle Creek, MI 181 120 -61
largest employer. Dover, DE; Iowa City, IA; Lansing-
Jacksonville, NC 183 122 -61
East Lansing, MI; Manhattan, KS; and Montgomery,
AL, are all prime examples. Metros reliant on public Pittsfield, MA 142 86 -56
spending from both the state and federal levels are Kahului-Wailuku-Lahaina, HI 88 34 -54
also represented on this list, including Dover, DE; Monroe, MI 152 99 -53
Albany, GA; and Jacksonville, NC. Grand Forks, ND-MN 192 140 -52
Hagerstown-Martinsburg, MD-WV 169 119 -50
Montgomery, AL 174 127 -47
Kankakee, IL 72 26 -46
St. Cloud, MN 104 58 -46
Panama City, FL 117 71 -46
Lubbock, TX 131 86 -45
Grand Rapids-Wyoming, MI 73 29 -44
Indianapolis-Carmel-Anderson, IN 106 63 -43
Columbia, MO 93 50 -43
Source: Milken Institute (2020)
BEST-PERFORMING CITIES 2020 INTRODUCTION
8
WHERE AMERICA’S JOBS ARE CREATED AND SUSTAINEDTOP 25
BEST-PERFORMING
LARGE CITIES#
1 SAN FRANCISCO-REDWOOD CITY-SOUTH SAN FRANCISCO,
CA MSA
GAINED 3 Job growth (2013-18) 13th The region’s wage income growth in the five-year benchmark
RANKS Job growth (2017-18) 22nd and the recent period exhibit exceptional strength (ranked
Wage growth (2012-17) 2nd second among large MSAs). Besides the region’s robust growth
Wage growth (2016-17) 2nd in job creation and income, it also commands the highest rank of
Short-term job growth (8/2018-8/2019) 11th five-year high-tech GDP growth among large metropolitan areas
High-tech GDP growth (2013-18) 1st in the nation. More importantly, the high-tech content as a share
High-tech GDP growth (2017-18) 8th of the regional economy is increasing.
High-tech GDP concentration (2018) 2nd The San Francisco-Redwood City-South San Francisco, CA,
Number of high-tech industries (LQ>=1) (2018) 17th MSA is already home to many global household names. Those
technology-driven service firms, such as Airbnb, Amazon,
ASSETS:
Salesforce, and Uber, are not only trophies but also the anchors
▪▪ Innovative capacity, unparalleled creative ecosystem, and
of the regional technology cluster.11 However, tech services
entrepreneurial spirit propel the region’s economic growth.
startups are shaping the current and future growth of the region.
▪▪ The region’s universities, R&D infrastructure, and workforce help
They are the dynamic force that elevate San Francisco-Redwood
advance its hold on the development of technology-driven services
City-South San Francisco to the top rank this year. These startups
in the world.
cover areas in data analytics, financing/banking, gaming, logistics,
▪▪ The region’s legacy in innovation remains a strong draw for global
markets, and sales.12
talents and startups from across the nation, if not globally.
LIABILITIES: The San Francisco Bay Area is also an emerging financing and
▪▪ Low housing affordability and scarcity in new commercial property logistics center for global commerce. The region’s innovative
development can hamper business expansion in the region. capacity blends well with the heightened demand in blockchain,
This shortcoming will limit regional development as talent and financial technology, and other data analytic technologies that
business retention becomes a never-ending issue. are reshaping global commerce. The phenomenon is by no
means unique in this period to San Francisco but illustrates the
richness of the region and its ability to attract and retain talent,
San Francisco-Redwood City-South San Francisco, CA, advances despite lackluster commercial space development and low
three spots this year to take the top position, after holding steady housing affordability.
in fourth place for three years (2016-2018). Like Silicon Valley to
Residential development is consistently a weaker spot in the
its south, the San Francisco-Redwood City-South San Francisco
regional economy. Housing shortages and a lack of affordability
metro consistently ranks among the top performers in our
continue to cast a shadow over long-term growth prospects of the
rankings. The region’s ongoing strong performance is backed by
region. The Bay Area’s median home price is $1,355,200,13 while
the creation of high-paying jobs and phenomenal income growth.
median household income is only $110,000.14 Recent news stories
Similar to the national trend, the labor market in the region is
illustrate the dilemma of high-tech growth and housing needs, as
tight, with a low unemployment rate at below 2.5 percent in
the average tech worker pays $2,000 for a room for boarding.15
the last three months, while its core high-value-added sectors
Reasons for the severe housing shortage include strict zoning
(information technology and professional/design services) posted
laws, cumbersome regulations, and high construction costs.
strong gains at 4.5 percent and 3.9 percent over the 12-month
Homeownership in the San Francisco Bay Area also continues to
period ending in October 2019, respectively.10
be a development challenge. It would take a concerted effort by
the public and private sectors to address this challenge.
BEST-PERFORMING CITIES 2020 TOP 25 BEST-PERFORMING LARGE CITIES
10
WHERE AMERICA’S JOBS ARE CREATED AND SUSTAINED#
2 PROVO-OREM, UT MSA #
3 AUSTIN-ROUND ROCK,
TX MSA
LOST 1 Job growth (2013-18) 1st HELD Job growth (2013-18) 9th
RANK Job growth (2017-18) 2nd STEADY Job growth (2017-18) 13th
Wage growth (2012-17) 3rd Wage growth (2012-17) 4th
Wage growth (2016-17) 9th Wage growth (2016-17) 8th
Short-term job growth (8/2018-8/2019) 29th Short-term job growth (8/2018-8/2019) 43rd
High-tech GDP growth (2013-18) 5th High-tech GDP growth (2013-18) 17th
High-tech GDP growth (2017-18) 10th High-tech GDP growth (2017-18) 12th
High-tech GDP concentration (2018) 14th High-tech GDP concentration (2018) 9th
Number of high-tech industries (LQ>=1) (2018) 25th Number of high-tech industries (LQ>=1) (2018) 25th
ASSETS: ASSETS:
▪▪ The region has gained a solid reputation for hosting young ▪▪ Ample space for business and commercial property development
startups due to strong support from local educational institutions and low cost of living still richly reward this high-tech city. Its low tax
and an accommodating lifestyle. and cost of living can attract technology firms and others from the
▪▪ Logistics and transportation services efficiently facilitate the East and West coastal regions.
region’s access to the West Coast technology centers. ▪▪ Strong academic and industry R&D are the fixtures and traditions of
▪▪ As the receiving end of the tech out-migration from the the region, where engineering and ideas fuse to create a platform
expensive coastal regions to the West, the region continues to for the expansion of a diverse regional economy.
expand its tech sector and build up the local skilled workforce. LIABILITIES:
LIABILITIES: ▪▪ The region is strong in hardware making but relatively weak in
▪▪ Challenges include a tight job market and a shortage of skilled labor. information-content generation compared to technology clusters
in the West Coast and Northeast regions.
Provo-Orem, UT, falls one spot from the top place in 2018 to
second in 2020. Despite the drop, the regional economy has Austin-Round Rock, TX, holds steady at third place, continuing
been one of the best in the nation in the last several years, a stretch of strong performances in the Best-Performing Cities
reflected in its rapid pace of job creation and rising incomes ranking. Economic development in Austin-Round Rock is like
(ranking first in job growth). The self-proclaimed “Silicon Slopes” that of the state’s, offering a low tax rate and abundant space for
has a high concentration of high-tech industries relative to the further expansion and development. And, while Austin’s high-
size of the economy. Indeed, the region’s economic growth is tech sector has taken off, the region still maintains a lower cost
driven by a rapid increase in the information sector employment, of living compared to coastal technology centers, although wage
with 5.3 percent job growth from 2018 to 2019, leading to rates in key occupation categories are lower than the national
an overall total employment growth of 3.3 percent. This pace average.18 So far, the region’s consistently strong economic
of high-tech output growth has solidified the region’s efforts performance in the last decade and a half of rankings support
to build up the technology contents of the economy. As such, the “Austin Model” for which the area is known.
Provo-Orem has consistently outperformed other large tech The Austin-Round Rock area is a diverse economy with
centers in the Best-Performing Cities report. many globally renowned corporations such as Dell, Resideo
However, as the regional job market expands, its growth Technologies Inc., Apple Inc., IBM, AMD, and Applied Materials.19
momentum has slowed in the last 12 months (ranked 29th). In True to the nickname “Silicon Hills,” the region ranks ninth
the same period, Provo-Orem’s unemployment rate dropped to overall for high-tech GDP concentration because of these tech
1.7 percent.16 The topline employment figures strongly suggest heavyweights. Information and professional/engineering service
that the tight labor pool constrains the region’s strong economic sectors are the two high-growth areas, commanding one-year
growth. A key advantage of the technology economy in Provo growth rates of 3.3 percent and 3.8 percent, respectively.
is the comparatively lower wage rate for similar occupations Further, as the state capital of Texas and home of the University
versus key competitors such as the Bay Area and Seattle. Had of Texas at Austin, the region offers ample support for academic
wages grown due to the persistently tight labor market, Provo’s and industry R&D. The sizable public sector is a strong stabilizer
competitive advantage might be softened.17 during economic and technological cycles and helps to explain
the remarkable consistency of the regional economy.
Compared with other famed innovation centers like the Bay
Area, Silicon Valley, Boston, and Los Angeles, Provo-Orem, UT, Austin-Round Rock MSA, like the state of Texas, successfully
is relatively new and has a limited breadth. However, the region continues to brand itself as a friendly place for business. In the
offers an unparalleled lifestyle and amenities in the mountain last few years, domestic firms such as Oracle have expanded
region, where it is still close to major venture capital and their footprint in Austin. In addition, Samsung and others often
angel fund networks on the West Coast. A quicker build-up in consider the region when expanding their operations.
promoting, nurturing, and training talent will lead to more robust
technology-driven growth.
BEST-PERFORMING CITIES 2020 TOP 25 BEST-PERFORMING LARGE CITIES
11
WHERE AMERICA’S JOBS ARE CREATED AND SUSTAINED#
4 RENO, NV MSA #
5 TIED ORLANDO-KISSIMMEE-
SANFORD, FL MSA
GAINED 7 Job growth (2013-18) 2nd GAINED 2 Job growth (2013-18) 6th
RANKS Job growth (2017-18) 1st RANKS Job growth (2017-18) 7th
Wage growth (2012-17) 14th Wage growth (2012-17) 11th
Wage growth (2016-17) 4th Wage growth (2016-17) 18th
Short-term job growth (8/2018-8/2019) 1st Short-term job growth (8/2018-8/2019) 5th
High-tech GDP growth (2013-18) 3rd High-tech GDP growth (2013-18) 29th
High-tech GDP growth (2017-18) 2nd High-tech GDP growth (2017-18) 30th
High-tech GDP concentration (2018) 101st High-tech GDP concentration (2018) 72nd
Number of high-tech industries (LQ>=1) (2018) 102nd Number of high-tech industries (LQ>=1) (2018) 49th
ASSETS: ASSETS:
▪▪ Strong job growth fuels the region’s economic growth. ▪▪ The expansion of the leisure/hospitality and high-tech sectors
▪▪ A diverse industrial mix sets the foundation for a healthier regional creates more jobs.
economy. ▪▪ The growth of the high-tech sector creates more high-paying jobs.
LIABILITIES: LIABILITIES:
▪▪ Declining housing affordability challenges further economic ▪▪ Heavy reliance on tourism makes the metro vulnerable to the impact
development. of recessions and economic downturns.
Reno, NV, moves up seven spots to secure fourth place. Its job Orlando-Kissimmee-Sanford, FL, inches up two spots to tie for
growth, wage growth, and high-tech GDP growth are among the fifth place. The region performed particularly well in five-year job
best of the large metros. Even more impressive, Reno’s one-year growth (sixth), one-year job growth (seventh), and short-term job
job growth and short-term job growth top all large metros in our growth (fifth). The metro added 41,800 jobs in 2018, signifying
rankings. Although traditionally known for its gaming industry, a 3.3 percent annual growth in employment and topping all US
the trade, transportation, and utilities (11,400 jobs); professional metros with more than 1 million total jobs.26 The professional
and business services (9,000 jobs); manufacturing (8,400 jobs); and business services, construction, and leisure and hospitality
construction (7,900 jobs); and education sectors (3,700 jobs) fields experienced the largest sector growth in 2018.27
drove the majority of employment added in the past five years.20
Orlando is particularly well known for its leisure and hospitality
This recent job growth is illustrative of the region’s changing sector, which accounts for 21 percent of the metro’s 2018 total
economic landscape. Most notably, Tesla’s Gigafactory 1 recently employment. In 2017, Disney and Universal Orlando employment
arrived in Reno and is the largest factory in the world. Reno is alone includes approximately 95,000 people.28 The region’s
also a transportation and logistics sub-center with a thriving amusement parks also are expanding: Universal opened a new
logistics and drone sector, including an Amazon fulfillment Harry Potter ride, Hagrid’s Magical Creatures Motorbike, in June
center, the first commercial drone delivery company in the US 2019, Walt Disney World’s Hollywood Studios opened Star Wars:
(Flirtey), and National Aeronautics and Space Administration Galaxy’s Edge in August 2019, and Universal Orlando will expand
(NASA) and the University of Nevada Reno’s NUANCE Lab, its territory by building an Epic Universe theme park. The project
which collaborate on drone traffic management. is expected to create 14,000 new jobs in the region.29
The area is also an emerging data center hub. Apple, for instance, The high-tech sector is another industrial pillar of the region.
has a data center in Reno with plans for expansion in the Reno- Lockheed Martin and Siemens, two leading tech employers, are
Sparks region. Another tech giant, Google, is building a 1,210-acre expanding their facilities in Orlando. In early 2019, Lockheed
data center.21 In addition, Switch’s Tahoe Reno 1 in the Citadel Martin opened a new R&D facility in Orlando to provide
Campus is the world’s largest data center campus.22 Affordable engineering, program management, and business operations
renewable energy in the region is recognized as one of the support for its Missiles and Fire Control’s Orlando site.30 In
major reasons behind Apple and Google’s site selection for data October 2019, Siemens opened an innovation center to support
centers in the area.23 Siemens Gas and Power customers in Orlando.31 University of
Central Florida (UCF) provides a highly educated workforce and
One side effect of the region’s rapid economic growth is
R&D support to local companies. In October 2018, UCF and
deteriorating housing affordability. Reno has been identified as
Siemens announced a new collaboration applying big data to
one of the least affordable places in the US relative to median
smart infrastructure to improve the performance and efficiency
income.24 In June 2019, median home prices in Reno reached
of buildings and the energy grid.32
an all-time high record of $420,000.25 The issue of housing
affordability poses challenges to workforce retention and
further economic growth.
BEST-PERFORMING CITIES 2020 TOP 25 BEST-PERFORMING LARGE CITIES
12
WHERE AMERICA’S JOBS ARE CREATED AND SUSTAINED#
5 TIED SAN JOSE-SUNNYVALE-
SANTA CLARA, CA MSA
#
7 BOISE, ID MSA
LOST 3 Job growth (2013-18) 29th GAINED 5 Job growth (2013-18) 7th
RANKS Job growth (2017-18) 76th RANKS Job growth (2017-18) 3rd
Wage growth (2012-17) 1st Wage growth (2012-17) 9th
Wage growth (2016-17) 3rd Wage growth (2016-17) 5th
Short-term job growth (8/2018-8/2019) 18th Short-term job growth (8/2018-8/2019) 23rd
High-tech GDP growth (2013-18) 4th High-tech GDP growth (2013-18) 23rd
High-tech GDP growth (2017-18) 14th High-tech GDP growth (2017-18) 22nd
High-tech GDP concentration (2018) 1st High-tech GDP concentration (2018) 43rd
Number of high-tech industries (LQ>=1) (2018) 1st Number of high-tech industries (LQ>=1) (2018) 123rd
ASSETS: ASSETS:
▪▪ Legacy resources like the abundance of venture capital, ▪▪ Less congestion, low cost of living and of doing business, and
entrepreneurial milieu, and a deep talent pool help maintain the natural amenities attract people and businesses.
economic strength of the region. ▪▪ Industries, including health care, food and beverage, and high-tech
▪▪ Companies in the metro lead the world in technological manufacturing and services, form a diversified economy.
innovation.
LIABILITIES:
LIABILITIES: ▪▪ Semiconductor chip manufacturing and export are vulnerable to
▪▪ Low housing affordability presents challenges for talent attraction global electronics market conditions and geopolitics, putting risk
and retention. on major local employer Micron.
San Jose-Sunnyvale-Santa Clara, CA, while remaining one of Boise, ID, performs well in job, wage, and high-tech GDP growth,
the top performers in the Best-Performing Cities rankings, earning seventh place in this year’s rankings. In particular, Boise’s
slips three spots this year to tie for fifth place. The Silicon one-year job growth and wage growth rank third and fifth in
Valley is home to many of the world’s most famous tech the nation, while the metro’s 2.7 percent unemployment rate in
companies, including Adobe, Apple, Alphabet/Google, Cisco, 2018 was its lowest point since 2007.37 The city in the Treasure
eBay, Facebook, HP, Intel, LinkedIn, Oracle, and Tesla. With Valley also topped Forbes’ “America’s Fastest Growing Cities”
these firms in residence, not surprisingly, the region ranks high list, which recognizes the metro’s recent strong performance in
in all high-tech sector-related metrics, including high-tech economic growth.38
GDP concentration and the number of high-tech industries LQ,
The Boise metro area is recognized as one of the hottest
topping all large MSAs.
destinations for domestic migrants. Most recent in-movers
Many of the aforementioned companies, like Apple and Google, hailed from the West Coast states of California, Oregon, and
are at the forefront of technological innovation in the high-tech Washington.39 Affordable housing prices, low living costs, short
and information services industries. Moreover, the metro is commute times, and proximity to nature are among the main factors
also strong in semiconductor product and equipment design enticing movers to the metro. However, the recent population
and manufacturing, which are essential to next-generation growth has also driven up median house prices in the metro from
technologies like artificial intelligence chips. As of 2018, $209,990 in October 2014 to $324,950 in December 2018.40
four out of the world’s top-10 integrated circuit design firms
The health-care sector, where St. Luke’s Medical Center is a
(i.e., Broadcom, NVIDIA, AMD, and Xilinx) are based in the
leading employer, is one of the major pillars of the local economy.
region.33 GlobalFoundries, a major pure-play foundry around the
In 2018, the center began its facilities expansion in downtown
globe, has its headquarters in Santa Clara. In addition, the region
Boise, which will bring more jobs to the region.41 And with
is home to three of the world’s major semiconductor equipment
the presence of Albertsons, J.R. Simplot, and microbreweries,
manufacturers, totaling 42 percent of global market share.34
the food and beverage and retail sectors also form important
The abundance of venture capital, an entrepreneurial milieu, elements of the metro’s economic landscape. However, the
and a deep talent pool have been widely recognized as major high-tech sector is the main driver of regional economic growth.
factors for the thriving high-tech ecosystem. Although other The low costs of business operation attract many tech startups,
emerging tech hubs in the US have been recipients of venture including Clearwater Analytics, Cradlepoint, and MetaGeek, to
capital, Silicon Valley received 18.1 percent of total VC dollars in the metro. Boise is also home to Micron, a major global player in
2018, second only to San Francisco.35 And with San Jose State the semiconductor industry, the second-largest employer in the
University, Stanford University, and the University of California, metro with approximately 6,000 people.42
Berkeley in residence, the region boasts a highly educated
However, the US government’s ban on exporting memory chips to
workforce. Over half of the population 25 years and older have a
Huawei, Micron’s major customer, has hurt the firm.43 In addition,
bachelor’s degree or higher.36
overreliance on service-based sectors such as health care means
relatively lower salary levels compared with other US tech
metropolises, and its undersupplied, highly educated pool poses
obstacles for the metro’s future economic growth.44
BEST-PERFORMING CITIES 2020 TOP 25 BEST-PERFORMING LARGE CITIES
13
WHERE AMERICA’S JOBS ARE CREATED AND SUSTAINED#
8 SEATTLE-BELLEVUE-
EVERETT, WA MD
#
9 DALLAS-PLANO-IRVING,
TX MD
HELD Job growth (2013-18) 40th LOST 4 Job growth (2013-18) 16th
STEADY Job growth (2017-18) 49th RANKS Job growth (2017-18) 43rd
Wage growth (2012-17) 8th Wage growth (2012-17) 23rd
Wage growth (2016-17) 6th Wage growth (2016-17) 46th
Short-term job growth (8/2018-8/2019) 13rd Short-term job growth (8/2018-8/2019) 8th
High-tech GDP growth (2013-18) 62nd High-tech GDP growth (2013-18) 28th
High-tech GDP growth (2017-18) 18th High-tech GDP growth (2017-18) 46th
High-tech GDP concentration (2018) 3rd High-tech GDP concentration (2018) 23rd
Number of high-tech industries (LQ>=1) (2018) 25th Number of high-tech industries (LQ>=1) (2018) 9th
ASSETS: ASSETS:
▪▪ Strong high-tech, high value-added industries provide high-paying ▪▪ The concentration and new additions of corporate headquarters
jobs. provide job opportunities in professional services.
▪▪ Amazon and Microsoft’s dominance in cloud computing fuels a ▪▪ The region has diverse industries, low taxes and housing costs,
new growth engine for the region’s economy. and a high-quality talent pool compared with other major US
metros.
LIABILITIES:
▪▪ The recent incidents involving the grounding of the Boeing LIABILITIES:
737 Max fleet and the US-China trade war may erode the ▪▪ Rising housing prices erode the metro’s long-standing
longstanding aerospace sector of the metro. competitive advantages.
Seattle-Bellevue-Everett, WA, remains in eighth place this Although the Dallas-Plano-Irving, TX, metro falls from fifth to
year, matching its 2018 performance. The overall wage in the ninth place in our 2020 rankings, the region enjoyed strong
metro has increased, which is reflected in its one-year and five- employment growth in recent years. In the 12 months before
year wage growth rankings. As in the San Francisco Bay Area, August 2019, the region owned the eighth-highest job growth
the high-tech sector has been fueling the region’s economy; rate among large metro economies in the nation. The metro’s
the presence of tech giants, including Amazon, Boeing, and unemployment rate also trended down in the recent decade,
Microsoft, explains the region’s solid performance (third) in our reaching 2.7 percent in May 2019, the lowest point in the past
high-tech GDP concentration metric. decade.50
Boeing, the largest employer in the metro with approximately The region is headquarters for a variety of companies, including
64,300 workers,45 is facing severe challenges. Recent incidents AT&T, Baylor Scott & White Health, Boeing’s Global Services
involving Boeing 737 Max aircraft have eroded the aviation division, Southwest Airlines, Texas Instruments, and Toyota
giant’s reputation and revenues. As of October 23, 2019, Motor North America. The Dallas metro is also a regional hub
the incidents have cost Boeing $9.2 billion.46 Moreover, it is for the financial, health-care, high-tech, and logistics sectors.
estimated that China will become the world’s largest aviation For instance, in late 2017, Liberty Mutual opened a new regional
market with approximately $3 trillion in aircraft business over hub in Plano, which is expected to employ 5,000 people in
the next two decades.47 The escalating trade war between the the next few years.51 Around the same time, JPMorgan Chase
US and China also threatens the company’s sales in commercial also opened a new campus, which will eventually house
airplanes to the Chinese market. approximately 10,500 employees.52
Seattle, known as “Cloud City,” boasts the presence of many In addition to Baylor Scott & White Health, the region is home to
cloud computing and storage companies, for instance, Amazon, several large medical facilities such as UT Southwestern Medical
Igneous, Microsoft, and Qumulo. Two of the most valuable US Center and Cook Children’s Health Care System. Tech companies
companies, Amazon and Microsoft, dominated the lucrative like Boeing, Raytheon, and Uber form a vital part of a high-tech
cloud computing markets in 2018. By the fourth quarter, cluster, while the metro’s pivotal location and the Dallas/Fort
Amazon and Microsoft owned 32 and 17 percent of world Worth International Airport constitute the backbone of the
market share in cloud computing, respectively.48 This expanding metro’s logistics hub.
of the cloud computing sector has helped the metro to maintain Among its attractive offerings, the metro can boast about lower
its growth momentum. In addition to a high-quality workforce, tax rates, cheaper living costs, and a high-quality talent pool
46 percent of the population 25 and older possess a bachelor’s when compared with other major US metros.53 Several major
degree or higher.49
universities are also key to attracting businesses, for instance,
the University of Dallas and the University of North Texas
at Dallas, which supply a skilled workforce to the local labor
markets. Among the total population aged 25 years or older,
37 percent possess a bachelor’s degree or higher, greater than
both the state (29 percent) and US (32 percent) averages.54
BEST-PERFORMING CITIES 2020 TOP 25 BEST-PERFORMING LARGE CITIES
14
WHERE AMERICA’S JOBS ARE CREATED AND SUSTAINED#
10 PALM BAY-MELBOURNE-
TITUSVILLE, FL MSA
#
11 RALEIGH, NC
GAINED 47 Job growth (2013-18) 33rd GAINED 5 Job growth (2013-18) 22nd
RANKS Job growth (2017-18) 5th RANKS Job growth (2017-18) 35th
Wage growth (2012-17) 98th Wage growth (2012-17) 12th
Wage growth (2016-17) 16th Wage growth (2016-17) 31st
Short-term job growth (8/2018-8/2019) 15th Short-term job growth (8/2018-8/2019) 84th
High-tech GDP growth (2013-18) 18th High-tech GDP growth (2013-18) 22nd
High-tech GDP growth (2017-18) 17th High-tech GDP growth (2017-18) 38th
High-tech GDP concentration (2018) 10th High-tech GDP concentration (2018) 8th
Number of high-tech industries (LQ>=1) (2018) 9th Number of high-tech industries (LQ>=1) (2018) 9th
ASSETS: ASSETS:
▪▪ Strong aerospace and national defense sectors grow the metro’s ▪▪ The metro has diverse industrial sectors feeding high-paying jobs.
high-tech industries. ▪▪ Talented and young demographics help build up a strong workforce.
▪▪ Nice weather and aerospace and port infrastructure attract
LIABILITIES:
people to the region.
▪▪ The ongoing US-China trade war may have an impact on the tech
LIABILITIES: sector.
▪▪ Many industries in the region are cyclical and may be vulnerable
to economic downturns. Raleigh, NC, known as a strong regional tech hub, falls five
spots in this year’s rankings to 11th place. Its high-tech GDP
Palm Bay-Melbourne-Titusville, FL, leaps 47 spots to secure concentration and number of high-tech industries LQ rank
10th place in our Best-Performing Cities 2020 rankings. The eighth and ninth, respectively, and its growing high value-added
metro has strong performances in several of our indicators, industries supply high-paying jobs to the region. This has helped
including one-year job growth (fifth), one-year wage growth the metro’s wage growth in recent years, which is reflected in its
(16th), short-term job growth (fifth), one- and five-year high- five-year wage growth indicator ranking (12th).
tech GDP growth (17th and 18th, respectively), high-tech GDP
Research Triangle Park, originating from the three universities
concentration (10th), and high-tech industries LQ (ninth).
in the area—Duke University in Durham, University of North
The region’s strong performance in the high-tech sector is Carolina at Chapel Hill, and North Carolina State University
attributed to the thriving aerospace and national defense in Raleigh—hosts a large concentration of tech companies,
industries, including several important US Air Force and Navy including Cisco, IBM, Lenovo, and SAS. Xerox also recently chose
bases and the Kennedy Space Center (KSC) Visitor Complex. the metro as the new site for its Center of Excellence, which is
The KSC, a major launch site for most NASA missions, expected to add 600 jobs over the next five years.61
draws other players in the aerospace industry such as Blue
As the name Research Triangle Park might suggest, clean
Origin, Boeing, and SpaceX. Additionally, the recent merger
technology, life sciences, and advanced manufacturing are pillar
of Harris Technologies and L3 creates the largest aerospace
industries in the region. The Research Triangle region boasts
and defense company, L3Harris. With a headquarters in
more than 350 clean-tech companies related to smart grid,
Melbourne, FL, L3Harris employs approximately 7,000 people.55
smart water, and smart transportation.62 Nearly 600 life science
Lockheed Martin also recently moved its Fleet Ballistic Missile
companies operate in the region, and the industry employs
Headquarters from Sunnyvale, CA, to Titusville, FL.56
2.5 percent of the area’s workforce, with an average annual wage
The region has also been a destination for tourists because of its of $142,900.63 Roughly 200 advanced manufacturing firms, such
warm climate, aerospace facilities, and modern port infrastructure. as 3M, Caterpillar, and GE Aviation, employ more than 12,500
Port Canaveral is the world’s second-busiest cruise port by people with an average annual wage of $86,000.64
number of passengers. In 2018, the port saw nearly 2.1 million
The concentration of higher education institutions also equips
cruise line embarkations, accounting for roughly 16 percent of
the region with a large talent pool. In 2017, 46 percent of
total US embarkations.57 In recent years, KSC has hosted roughly
residents aged 25 and older had an undergraduate degree or
1.5 million visitors per year.58 The region is also a retiree haven;
more, which is greater than the state (31 percent) and national
the large concentration of the elderly provides economic activity
levels (32 percent).65 In addition to its deep talent pool, the metro
for the health-care sector.
is young: The population aged 18 to 64 accounted for 64 percent
The education sector, health services, and leisure and hospitality of the total population in 2018, while the median age was
services together accounted for 28.7 percent of the region’s 36.9 years.66 The state also recently lowered its corporate tax
total employment.59 The major industries of health services, rate from 3 percent to 2.5 percent in early 2019, which is the
hospitality, and defense tend to be more vulnerable to business lowest in the nation.67 Access to a talented and young workforce
cycles. Further diversifying the region’s economy and deepening and a business-friendly environment give the region competitive
the local talent pool would help the region to be more resilient to advantages over many of its counterparts.
future economic downturns (only 30 percent of the population
aged 25 or older had at least a bachelor’s degree in 2017).60
BEST-PERFORMING CITIES 2020 TOP 25 BEST-PERFORMING LARGE CITIES
15
WHERE AMERICA’S JOBS ARE CREATED AND SUSTAINED#
12 PHOENIX-MESA-
SCOTTSDALE, AZ MSA
#
13 CHARLESTON-NORTH
CHARLESTON, SC MSA
GAINED 8 Job growth (2013-18) 28th GAINED 3 Job growth (2013-18) 21st
RANKS Job growth (2017-18) 12th RANKS Job growth (2017-18) 15th
Wage growth (2012-17) 51st Wage growth (2012-17) 26th
Wage growth (2016-17) 27th Wage growth (2016-17) 28th
Short-term job growth (8/2018-8/2019) 22nd Short-term job growth (8/2018-8/2019) 57th
High-tech GDP growth (2013-18) 41st High-tech GDP growth (2013-18) 15th
High-tech GDP growth (2017-18) 26th High-tech GDP growth (2017-18) 19th
High-tech GDP concentration (2018) 52nd High-tech GDP concentration (2018) 58th
Number of high-tech industries (LQ>=1) (2018) 49th Number of high-tech industries (LQ>=1) (2018) 81st
ASSETS: ASSETS:
▪▪ Favorable demographics help the metro to grow. ▪▪ Modern port facilities provide aerospace and automotive
▪▪ A diverse industrial mix fosters long-term economic health. industries strong support in importing and exporting products.
LIABILITIES: LIABILITIES:
▪▪ Average wage in the region is relatively low compared with other ▪▪ The US-China trade war and the import tariffs on Mexican parts
metros in the western US. may impact the growth of the transportation manufacturing sector.
Phoenix-Mesa-Scottsdale, AZ, climbs eight spots to 12th place. Charleston-North Charleston, SC, ascends three spots to 13th
The Valley of the Sun is a hotbed for employment growth; from place in this year’s rankings. It is 15th in one-year job growth
2015 to 2018, annual employment growth ranged from 3 to and performed well in one- and five-year high-tech GDP growth,
3.4 percent.68 One-year job growth (2017-2018) in the region ranked 19th and 15th, respectively. Firms like Blackbaud, Blue
ranks 12th among all large MSAs in this year’s report. Acorn, iQor, and Science Applications International Corp. (SAIC)
comprise the region’s high-tech cluster, earning Charleston the
In addition to its employment growth, the region remains a
nickname “Silicon Harbor.” Indeed, high-tech firms continue to
popular destination for retirees and is one of the fastest-growing
flock to the region: In 2018, SAIC started building its Platform
US metros. From 2017 to 2018, the metro enjoyed a 2.5 percent
Innovation Center and expects to add roughly 200 jobs to the
population growth, putting it ninth among all US metros.69 Since
region.74
2010, more than 200,000 people have moved to the city of
Phoenix.70 Both employment and population growth have driven The national defense sector, another pillar industry in the region,
up housing prices. Despite this, new home construction and includes Joint Base Charleston and the Naval Information
vacant units helped meet new demand71 and kept the Valley’s Warfare Center. Boeing’s second 787 Dreamliner final assembly
housing relatively affordable compared to other big metros. and delivery plant is also located in the metro. Charleston is
New housing growth also generates significant construction known as a hub for automotive component manufacturing,
demand—the number of construction jobs grew from 81,163 in vehicle assembly, and remanufacture/maintenance parts,
August 2010 to 136,545 in August 2019.72 including factories for Bosch, Mercedes-Benz, and Volvo, while
the port provides these manufacturers a convenient conduit
The metro also has a diverse industrial composition: Professional
to import and export products. However, the US-China trade
and business services and education and health services are the
war and the tariffs on Mexican parts may impose barriers to
two leading sectors in the region, accounting for 16.8 percent
the continued growth of the automotive original equipment
and 15.4 percent of all employment in 2018.73 Major financial
manufacturer and component companies in the metro.
institutions (e.g., Bank of America, JPMorgan Chase, and Wells
Fargo), insurance companies (e.g., Progressive, State Farm, and In addition to Charleston’s prime location as a historically
USAA), and airlines (e.g., American Airlines and US Airways) also important port, the metro’s charming waterfront and warm
have their back offices in the region. Phoenix is also home to weather attract retirees. The retiree population helps sustain
aerospace and high-tech manufacturing companies like Apollo a strong health-care cluster, where three major medical
Education Group, Honeywell Aerospace, Raytheon Missile providers—Ralph H. Johnson VA Medical Center, Roper St.
Systems, and Intel. This industrial diversity helps the region to Francis, and Trident Health—employ over 10,000 people as of
maintain a healthy economy. 2018.75 Tourism is another important economic sector for the
metro. The region has boutique hotels, fabulous restaurants, and
a charming urban landscape. Travel + Leisure Magazine named
Charleston the number one city for tourists to visit in the US
seven years in a row (2013-2019).76
BEST-PERFORMING CITIES 2020 TOP 25 BEST-PERFORMING LARGE CITIES
16
WHERE AMERICA’S JOBS ARE CREATED AND SUSTAINEDYou can also read