Citizenship Question Nonresponse - A Demographic Profile of People Who Do Not Answer the American Community Survey Citizenship Question ...
←
→
Page content transcription
If your browser does not render page correctly, please read the page content below

Citizenship Question Nonresponse
 A Demographic Profile of People Who Do Not Answer
the American Community Survey Citizenship Question

                                        WILLIAM P. O’HARE

                                           September 2018
Georgetown Center on Poverty and Inequality
The Georgetown Center on Poverty and Inequality works with
policymakers, researchers, practitioners, and advocates to develop
effective policies and practices that alleviate poverty and inequality in
the United States.

The center’s areas of work include national, state, and local policy and
program recommendations that help marginalized girls, promote
effective workforce and education policies and programs for
disconnected youth, and develop policies to combat deep poverty.

Our strategies are to partner with federal agencies and non-profit
organizations to host national conferences, produce and widely
disseminate in-depth reports, engage in public speaking, and
participate in national coalitions and working groups.

Economic Security and Opportunity Initiative
The mission of the Georgetown Center on Poverty and Inequality’s
(GCPI) Economic Security and Opportunity Initiative (ESOI) is to expand
economic inclusion in the United States through rigorous research,
analysis, and ambitious ideas to improve programs and policies. Further
information about GCPI’s ESOI is available at
www.georgetownpoverty.org.

Copyright
Creative Commons (cc) 2018 by William P. O’Hare.

Notice of rights: This report has been published under a Creative Commons
license. This work may be copied, redistributed, or displayed by anyone,
provided that proper attribution is given and that the adaptation also carries
a Creative Commons license. Commercial use of this work is disallowed.

                                                       Citizenship Question Nonresponse |   2
Citizenship Question Nonresponse
A Demographic Profile of People Who Do Not Answer the
     American Community Survey Citizenship Question

                                               WILLIAM P. O’HARE

                                                 SEPTEMBER 2018

                                    Citizenship Question Nonresponse |   3
Acknowledgements & Disclosures
This report was authored solely by William P. O’Hare and published by the
Georgetown Center on Poverty and Inequality as part of its 2020 Census
work.

William P. O’Hare is an independent research professional with more than
35 years of experience in statistical analysis of social and demographic
data in various applied settings.

The author would like to acknowledge Cara Brumfield and Indivar Dutta-
Gupta of the Georgetown Center for Poverty and Inequality, who edited
the report.

The author would like to thank several reviewers including Arturo Vargas,
Terri Ann Lowenthal, Rob Santos, and Terry Ao Minnis for helpful
comments. The author would also like to thank the staff at the Population
Reference Bureau for comments on an earlier version of this paper.

In addition, the author is grateful to The Leadership Conference Education
Fund for its support of this work.

Further information about GCPI’s ESOI is available at
www.georgetownpoverty.org.

                                                    Citizenship Question Nonresponse |   4
Contents
Executive Summary ........................................................................................................................ 6
Introduction ....................................................................................................................................... 8

Data Sources...................................................................................................................................... 9

Findings ...............................................................................................................................................11
      Trends Over Time .............................................................................................................................................................................................................11
      Geographic Variation ...................................................................................................................................................................................................13
      Variation by Race/Hispanic Origin, Place of Birth, and Data Collection Mode ............................................................ 16

Summary and Conclusions ......................................................................................................... 21

                                                                                                                                                             Citizenship Question Nonresponse |                                          5
Executive Summary

                       hen Secretary of Commerce Wilbur L. Ross Jr. issued a statement on March 26,

        W              2018, requiring the Census Bureau to add a question on citizenship to the 2020
                       Census questionnaire, it stirred up a storm of controversy. Much of the discussion
              was about the impact the decision would have on response rates in the 2020 Census.
              The citizenship question planned for the 2020 Census is the same as the one currently
              asked in the American Community Survey (ACS). The context of the ACS and the
                                 decennial census are quite different, but analysis of the ACS citizenship
                                 question can shed light on potential responses to the citizenship
In 2016, the nonresponse
                                 question in the 2020 Census. Completing the decennial questionnaire
    rate for the citizenship     is mandatory for everyone in the United States and participating in the
question on the ACS was          ACS is mandatory for everyone who is randomly selected to receive it

 6 PERCENT.                      each year. This paper provides a descriptive analysis of the nonresponse
                                 rates to the citizenship question in the U.S. Census Bureau’s ACS.

                            This analysis shows that the nonresponse rate for the citizenship
           question on the ACS is much higher than the nonresponse rates for any of the other
           questions that will be on the 2020 Census questionnaire. In the 2016 ACS, the
           nonresponse rate for the citizenship question was 6.0 percent and no other question
           that will be on the 2020 Census questionnaire had a nonresponse rate higher than 1.8
           percent.

           In addition, the nonresponse rates for the citizenship question have increased since
           2010 while the nonresponse rates for other questions that will be on the 2020 Census
           have remained stable. The biggest increase in the nonresponse rates for the citizenship

                                                                          Citizenship Question Nonresponse |   6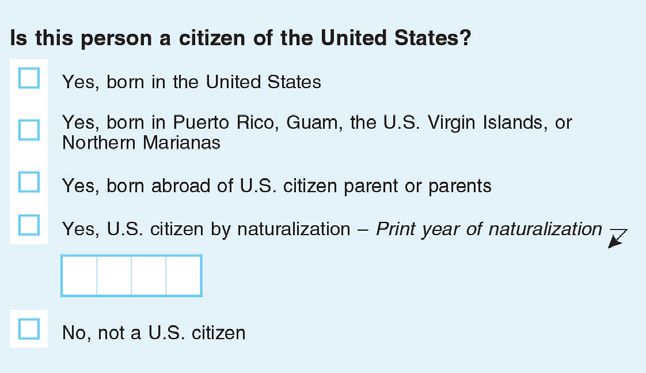
question occurred between 2012 and 2013 and can be tied to changes in methodology.
However, those methodological changes did not increase the nonresponse rates of
other questions planned for the 2020 Census. This suggests that methodology may
have a greater impact on responses to the citizenship question than on other questions
that will be asked in the 2020 Census.

There are large differences in nonresponse rates to the citizenship question across
states and cities. For example, the nonresponse rate in Arizona (9.0 percent) is almost
four times that of Vermont (2.6 percent). There are 11 cities that have nonresponse rates
to the ACS citizenship question of 3 percent or less and 43 cities where the nonresponse
rates are 10 percent of more.

Nonresponse rates also differ by demographic group. The higher nonresponse rates for
some groups may indicate that the ACS question on citizenship is more sensitive to
those groups. Demographic groups with the highest nonresponse rates include:

   •   Racial and ethnic minorities,
   •   Foreign-born people, and
   •   Residents of central cities of metropolitan areas.

There are also large differences in nonresponse rates to the citizenship question by
mode of data collection. The nonresponse rates are higher on self-response
questionnaires (mail and internet) than in personal interviews. The nonresponse rate is
8.0 percent for the internet mode of data collection, 6.7 percent for the mail mode, and
3.8 percent for personal interviews. This is important because the Census Bureau is
promoting internet self-response as they primary method of response in the 2020
Census.

The data presented in this report support the conclusions of other researchers who
warn that inclusion of a question on citizenship on the 2020 Census is likely to increase
the costs and compromise the accuracy of the 2020 Census by increasing nonresponse.

                                                            Citizenship Question Nonresponse |   7
Introduction
n March 26, 2018, Secretary of Commerce Wilbur L. Ross, Jr. issued a memorandum
O explaining and summarizing his decision to add a question on citizenship to the
2020 Census questionnaire. 1 In his memorandum, Secretary Ross also requested
the use of administrative records from other federal agencies for capturing data on
citizenship in the 2020 Census. 2
Our constitution requires that the decennial census count every person in the United
States. Secretary Ross’ decision raises concerns about the extent to which the addition
of the citizenship question would depress response rates in the 2020 Census and how it
might differentially affect some groups’ willingness to respond to the question—or
participate in the census at all. Typically, the Census Bureau would
The citizenship question is thoroughly test a question before adding it to the census. That was not
done for the question on citizenship. The proposal to add the
untested in citizenship question is currently moving through the regulatory
the census. process. The addition of the question is being challenged in the courts.
This paper focuses on the differential nonresponse rates to the
citizenship question on the Census Bureau’s American Community
Survey (ACS), the same question that will be used on the 2020 Census questionnaire.
Like the decennial questionnaire, response to the ACS is mandatory, though only a
random sample of households are surveyed each year for the ACS. Analysis of
nonresponse rates to the citizenship question, along with similar analysis of
nonresponse rates to other questions that will be on the 2020 Census, provides an
understanding of how the sensitivity to the citizenship question compares to the
sensitivity to other planned questions. Differential nonresponse rates across
demographic groups are also examined.
Citizenship Question Nonresponse | 8Data Sources
here are two closely related sources of data used here. First, Figures 1 and 2 use
T ACS and 2010 Census nonresponse rates taken from the Census Bureau’s
website. 3, 4 Second, the Census Bureau makes available a sample of ACS
respondents’ records through a Public-Use Microdata Sample (PUMS) file which can be
used to estimate nonresponse rates for geographic areas and demographic groups. All
personal identifying information is removed from the records in the PUMS file. The
PUMS file is the data source for all the figures in this report other than Figures 1 and 2.
The 2016 ACS PUMS file from the Census Bureau contains records for almost 3.2 million
people. For this study, the PUMS files were processed using the IPUMS (Integrated
Public-Use Microdata Sample) system at the University of Minnesota. 5
The data source for this study is the same one used by Dr. John Abowd (Chief Scientist
and Associate Director for Research and Methodology at the Census Bureau) 6, 7 and Dr.
Steven Camarota (Director of Research for the Center for Immigration Studies) 8 in their
analyses of the impact of the citizenship question. Abowd and Camarota also use the
metric this analysis relies on the most (nonresponse rates). The current analysis builds
on the results of both authors cited above by providing more details about
nonresponse to the ACS citizenship question. The data reported here are consistent
with the data reported in their studies.
Citizenship Question Nonresponse | 9The American Community Survey Asks about If someone does not respond to an ACS
Citizenship question, the Census Bureau imputes or
allocates a value for that person. For
example, if someone did not check a
response for the question on race, the
Census Bureau would make an
educated guess about the person’s race
based on information about the person,
household, and neighborhood. 9 The
Census Bureau provides allocation rates
or nonresponse rates for all the
questions in the ACS that will be used in
the 2020 Census. 10
In this paper, the percent of a group
that does not respond to a question is
called a nonresponse rate. Abowd also refers to the allocation rates as nonresponse
rates. 11 According to Abowd, “When item nonresponse occurs, the ACS edit, and
imputation modules are used to allocate an answer to replace the missing data item.” 12
Sampling errors are errors in statistical estimates that result from looking at a subset of
a population rather than the entire population. Since the ACS estimates are based on a
sample (subset) of the population, there are sampling errors associated with the
estimates. Standard errors are measures of the accuracy of the estimates. Standard
errors for the estimates shown in the body of the report are provided in Appendix A.
However, given the very large size of the ACS sample, standard errors for most
estimates shown in this paper are quite small and consequently most differences in
response rates are meaningful (i.e. statistically significant).
Appendix B shows that national estimates from PUMS files are virtually identical to
those from the full ACS sample. This suggests that the results of the analysis of the
PUMS data is very close to what one would get if one could use the entire ACS sample
for an analysis.
The tabulations shown here focus on several kinds of differentials. First, the
nonresponse rate for the question on citizenship is compared to the nonresponse rates
for other questions that will be on the 2020 Census. This analysis includes an
examination of the changes in nonresponse rates from 2010 to 2016. Second,
nonresponse rates across different geographic areas are examined. Third, the
nonresponse rates for key demographic groups and response modes are compared.
Citizenship Question Nonresponse | 10Findings
Trends Over Time
The nonresponse rates for the citizenship question are much higher than for any
other question in every year from 2010 to 2016. In 2016, the nonresponse rate for
citizenship is 6.0 percent and no other question had a nonresponse rate higher than
1.8 percent. This finding in consistent with the research reported by Abowd, who
concluded, “Whether the response is by mail-in questionnaire or ISR [Internet Self-
Response] instrument, item nonresponse rates for the citizenship question are much
greater than the comparable rates for other demographic variables like sex,
birthdate/age, and race/ethnicity … .” 13
Second, the nonresponse rates for the citizenship question have increased since 2010
while the nonresponse rates for the other questions have remained relatively stable.
The nonresponse rate for the citizenship question was 2.7 percent in 2010 but it had
increased to 6.0 percent in 2016 (see Figure 1.) The only other question for which there
was an increase in the nonresponse rate from 2010 to 2016 was the age question—the
nonresponse rate went from 1.3 percent in 2010 to 1.7 percent in 2016.
Most of the increase in the nonresponse rates for the citizenship question since 2010
occurred between 2012 and 2013 and the increase can be tied to methodological
changes that took place then. For budgetary reasons, the Census Bureau reduced its
use of the Failed Edit Follow-Up (FEFU) operation in the 2013 and subsequent ACS
surveys. 14 The FEFU operation involves a follow-up phone interview with internet and
mail respondents whose responses indicate a discrepancy and those who indicated a
household size of more than six people. (The mail form allows data for only five
people.) Addresses identified as vacant are also sent to FEFU. 15 This change resulted in
Citizenship Question Nonresponse | 11less follow-up and increased blank responses. In 2013, the Census Bureau also
implemented an internet response option for the ACS.
Figure 1. Nonresponse Rates for the Citizenship Question Have Increased Since 2010 while
the Nonresponse Rates for Other Questions Have Remained Relatively Stable
Nonresponse Rates in American Community Survey for
Questions Planned for the 2020 Census, 2010-2016
7
Race
5.9% 6.0%
Hispanic Origin
6
Sex 5.5%
Age 5.2%
5 Relationship to HH
Percent Not Responding
Housing Tenure
Citizenship
4
3.0%
3 2.7% 2.7%
2
1
0
2010 2011 2012 2013 2014 2015 2016
Source: American Community Survey Item Allocation Rates. Available at
https://www.census.gov/acs/www/methodology/sample-size-and-data-quality/item-allocation-rates.
It is noteworthy that the methodological changes in the ACS between 2012 and 2013
had an impact on the nonresponse rates for the citizenship question but had very
little impact on other questions. Between 2012 and 2013, the nonresponse rate for the
citizenship question increased by 2.2 percentage points (from 3.0 to 5.2 percent). No
other measure changed by more than 0.3 percentage points (age changed from a 1.3
percent to a 1.6 percent nonresponse rate). This suggests that the citizenship question
may be more sensitive to methodological changes (such as level of follow up) or
changes to data collection methods (such as the addition of an internet response
option) than other questions.
There was a slight increase in nonresponse rates to the citizenship question from 2013
to 2016 (from 5.2 percent to 6 percent), which suggests that sensitivity to the topic
may have grown in recent years.
Citizenship Question Nonresponse | 12Third, note that Table 1 (see Appendix A) contains the item nonresponse rates from
the 2010 Census for all the questions except the citizenship question, which was not
included in the 2010 Census. In every case, the item nonresponse rates in the 2010
Census are higher than the item nonresponse rates for the same question in the 2010
to 2016 ACS. Consequently, the nonresponse rates reported here from the ACS are
likely to underestimate of the nonresponse rates one would expect for the same
questions in the 2020 decennial Census.
The self-response modes of data collection in the ACS (i.e. sending back a completed
paper questionnaire or completing an internet response) will be similar to data
collection in the 2020 Census, but personal interviews for people who fail to self-
respond are different in the ACS and the Decennial Census. The lower nonresponse
rates in the ACS compared to the 2010 Census may reflect the use of highly trained
interviewers in the ACS compared to the temporary workforce with limited training
used for personal interviews in the decennial census. Information on differences by
data collection mode are provided later in this paper. A focus on self-response rates
may provide a better indication of how the nonresponse rates from the ACS are likely
to reflect the nonresponse rates one can expect in the 2020 Census.
The overall nonresponse rate for the citizenship question on the 2016 ACS is 6 percent
but this figure masks important differences across demographic groups and
geographic areas. Those differences are explored below. Given the consistency of the
ACS nonresponse data over the past several years, the remainder of this paper focuses
on 2016 data.
Geographic Variation
One of the most important attributes of the decennial census is the comparable
subnational data it provides. Differences in nonresponse rates across geographic
areas are particularly important because census data are used to determine political
representation and allocation of federal funding to states and localities. The data
provided in this section indicate that there are large differences in the nonresponse
rates for the ACS citizenship question in different parts of the nation.
Figure 2 shows that Arizona has the highest nonresponse rate at 9 percent. That is
nearly four times the nonresponse rate for Vermont, which has the lowest
nonresponse rate at 2.6 percent. Most of the states with high nonresponse rates have
relatively large immigrant populations whiles states with low nonresponse rates have
relatively small immigrant populations.
Citizenship Question Nonresponse | 13Figure 2. Arizona’s Citizenship Question Nonresponse Rate is
Nearly Four Times That of Vermont
States Ranked by Nonresponse Rate for the Citizenship Question in
the 2016 American Community Survey
Rank State Rate Rank State Rate
1 Vermont 2.6 27 South Carolina 5.6
2 West Virginia 3.7 28 Montana 5.6
3 Maine 3.8 29 Texas 5.6
4 Wyoming 4.0 30 Rhode Island 5.7
5 South Dakota 4.3 31 Washington 5.7
6 Arkansas 4.5 32 Nebraska 5.7
7 Ohio 4.6 33 North Carolina 5.8
8 Delaware 4.6 34 Pennsylvania 5.8
9 Mississippi 4.7 35 Oklahoma 5.8
10 New Mexico 4.7 36 Connecticut 5.9
11 Wisconsin 4.8 37 North Dakota 5.9
12 Michigan 4.9 38 New Jersey 6.0
13 Tennessee 4.9 39 Alabama 6.0
14 Minnesota 5.0 40 Virginia 6.2
15 Kentucky 5.0 41 Nevada 6.3
16 Missouri 5.0 42 Massachusetts 6.3
17 New Hampshire 5.0 43 Alaska 6.6
18 Utah 5.1 44 Florida 6.7
19 Iowa 5.2 45 Maryland 6.8
20 Georgia 5.3 46 District of Columbia 6.9
21 Oregon 5.3 47 Hawaii 6.9
22 Kansas 5.4 48 Colorado 7.3
23 Indiana 5.4 49 New York 7.3
24 Illinois 5.4 50 California 7.7
25 Louisiana 5.5 51 Arizona 9.0
26 Idaho 5.5 U.S. 6.0
Source: American Community Survey Item Allocation Rates. Available at
https://www.census.gov/acs/www/methodology/sample-size-and-data-quality/item-allocation-rates.
Ranking based on unrounded data.
Citizenship Question Nonresponse | 14Another geographic distinction used by the Census Bureau is related to areas inside
and outside official Metropolitan Statistical Areas. The area within Metropolitan
Statistical Areas is divided between the major city or cities at the core of the
metropolitan area (called central or principal cities) and the balance of the
metropolitan area (outside of the central or principal cities—often referred to as
suburbs). Areas outside of Metropolitan Statistical Areas are often referred to as
nonmetro or “rural.” 16 These distinctions collectively are often referred to as
metropolitan (metro) status.
Figure 3 shows the nonresponse rates to the citizenship status question on the 2016
ACS by metro status. Nonresponse rates are highest in the central city or principal
cities of metro areas (7.2 percent) and lowest outside metro areas (5.0 percent).
The Census Bureau makes nonresponse rates to the 2016 ACS citizenship question
available through the American Factfinder program for places with a total population
of 65,000 or more. Most of these places are large cities, but a few are Census
Designated Places (settled concentrations of population that are identifiable by name
but are not legally incorporated defined by the Census Bureau for statistical
purposes), or other types of official areas. Of the 599 places reported by U.S. Census
Bureau, there are 11 places where the nonresponse rates are 3 percent or less, and 43
places where the nonresponse rates are 10 percent or more. 17 Sixteen of these 43
places with high nonresponse rates to the citizenship question are in California.
Figure 3. Citizenship Question Nonresponse Rates are Highest in the
Central City or Principal Cities of Metro Areas
Nonresponse Rates to Citizenship Question in the 2016 ACS by
Metro Status
7.2%
6.1% 6.0%
Nonresponse Rate
5.0%
Inside the central or Inside metropolitan Not in metro area U.S.
principal city of a area but outside (rural)
metropolitan area central or principal city
(suburban)
Source: Author’s analysis of U.S. Census Bureau's 2016 American Community Survey PUMS file on IPUMS system
at the University of Minnesota.
A large number of respondents were not included in this table because revealing their geographic location might
compromise their confidentiality.
Citizenship Question Nonresponse | 15Variation by Race/Hispanic Origin, Place of Birth, and Data
Collection Mode
In this section, nonresponse rate differences based on race/Hispanic origin, place of
birth, and data collection mode are provided. First, each variable is shown separately,
then the results are shown for all three factors at once.
RACE AND HISPANIC ORIGIN
Starting in the 2000 Census, people have been given the option to select more than
one race in the census questionnaire and race is often reported two different ways in
Census Bureau reports. 18 See the image below, which shows the race question on the
2010 Census form. One category is the number of people who only select one race
(referred to as race alone) and a second category is all the people in the first category
plus those who select more than one race (referred to as race alone or in
combination).
The Census Form Allows Respondents to
The race categories used in Figure 4 are “race
Select Multiple Races
alone or in combination.” In other words, the
Black group includes anyone who marked Black,
including those who marked another race as well.
In federal data collections, race and Hispanic
origin are treated as separate concepts. In the
racial categories used in this study, those who
identify as Hispanic are included in a race
category if they marked that category. Anyone
who marked Hispanic is also included in the
Hispanic category no matter what race(s) they
may have selected.
This categorization scheme means many people
are included in more than one category, but this
is the most inclusive categorization scheme, and
the one recommended by the U.S. Office of Management and Budget. 19 Data for
Native Hawaiians and Pacific Islanders are not shown in Figure 4 because the sample
size for this group is too small to produce reliable estimates.
The nonresponse rates for White alone or in combination (5.6 percent) is lower than
any other group in Figure 4. Asians alone or in combination have the highest
nonresponse rate (8.1 percent) followed by Hispanics (7.4 percent). The high
nonresponse rates for Asians alone or in combination and Hispanics is not too
surprising since about two-thirds of Asian Americans are immigrants and 35 percent
of Hispanics living in the U.S. are immigrants according to the 2016 ACS. The high
Citizenship Question Nonresponse | 16nonresponse rate for Asians may also be related to the fact that the ACS material is
not available in all the various Asian languages spoken in the U.S.
Figure 4. Asian Americans and Latinos Have the Highest Nonresponse
Rates to the Citizenship Question in the ACS
Nonresponse Rates to the Citizenship Question on the 2016 ACS by
Race and Hispanic Origin
8.1%
7.4%
6.8%
5.6% 6.0%
White Alone or in Black Alone or in American Indian or Asian Alone or in Hispanic
Combination Combination Alaska Native Alone Combination
or in Combination
Source: Author’s analysis of Census Bureau's 2016 ACS PUMS file on the IPUMS system at the University of
Minnesota.
The results in Figure 4 are consistent with the ACS analysis by Abowd who also found
that nonresponse rates for the citizenship question were higher for racial and ethnic
minorities than for non-Hispanic Whites. 20,21 Specifically, Abowd found that non-
Hispanic Non-Whites and Hispanics had higher nonresponse rates to the ACS
citizenship question than non-Hispanic Whites in self-response modes. Abowd did
not look at non-Hispanic Asian alone or non-Hispanic American Indians or Alaskan
Natives alone.
Nonresponse rates are one measure of how respondents view a topic. Another
measure is break off rates. Break off rates reflect the percent of respondents who
stopped responding to the survey when they came to a specific question. Abowd
showed that Hispanics have a higher breakoff rates than non-Hispanic racial and
ethnic minorities and non-Hispanic Whites for questions related to citizenship. 22, 23 The
questions on the ACS that Abowd indicates are related to the question on citizenship
are place of birth and year of entry into the United States. Considering all three
questions (citizenship, place of birth, and year of entry into the United States),
Hispanics had a break off rate of 1.6 percent compared to 1.2 percent for non-Hispanic
people of color and 0.5 percent for non-Hispanic Whites. 24, 25
Citizenship Question Nonresponse | 17PLACE OF BIRTH
Nonresponse rates to the citizenship question on the 2016 ACS vary by whether
someone was born in the U.S. or born outside the U.S. The nonresponse rate for the
foreign-born population (8.3 percent) is much higher than the rate for the population
born in the U.S. (5.7 percent). This is unsurprising considering that people born in the
U.S. are automatically citizens.
It is important to note that about 95 percent of the people who did not respond to the
citizenship question also did not respond to the question on place of birth. Thus, the
data on place of birth for those who did not respond to the citizenship question is
based largely on the Census Bureau’s imputation of place of birth. The imputation
process could have led to some errors in place of birth, so analysis involving values
from this variable should be viewed cautiously.
Figure 5. The Citizenship Question Nonresponse Rate for the
Foreign-Born Population is Much Higher than the Rate for the U.S.-
Born Population
Nonresponse Rates to the 2016 ACS
Citizenship Question by Place of Birth
8.3%
5.7% 6.0%
Born in U.S. Foreign-born Total
Source: Authors analysis of U.S. Census Bureau's 2016 American Community Survey PUMS file on
IPUMS system at the University of Minnesota.
MODE OF DATA COLLECTION
There are three modes of data collection used in the ACS. One is mail response, where
a respondent mails back a completed ACS questionnaire. Another is internet self-
response, where the respondent completes the ACS questionnaire online. The third
mode of data collection used in the ACS is a personal interview referred to as either a
Computer-Assisted Telephone Interview (CATI) or Computer Assisted Personal
Interview (CAPI). The Census Bureau stopped using CATI in the fall of 2017.
Current plans call for four modes of data collection for the 2020 Census. 26 One mode is
a mail response very similar to the ACS. The second mode is an internet response very
similar to the ACS. The third mode is a personal interview for households that fail to
self-respond. However, as stated earlier, personal interviews in the 2020 Census will be
conducted by one of about 500,000 temporary census enumerators with limited
training rather than the highly trained professional ACS interviewers. The fourth mode
Citizenship Question Nonresponse | 18of data collection planned for the 2020 Census is a telephone response. 27 This mode is
not used in the ACS.
The data show that the nonresponse rates for self-response modes (mail and internet)
are much higher than the nonresponse rates for respondents who responded to a
Census Bureau interviewer. The nonresponse rate is 8 percent for internet response,
6.7 percent for mail responses, and only 3.8 percent for personal interview response.
Figure 6. Personal Interviews Result in Lower Nonresponse Rates
Nonresponse Rates to the Citizenship Question on the 2016 ACS
by Data Collection Mode
8.0%
6.7%
6.0%
3.8%
Internet Mail Personal Interview Total
(Computer Assistance
Telephone
Interview/Computer
Assisted Personal
Interview)
Source: Author’s analysis of U.S. Census Bureau's 2016 American Community Survey PUMS file on IPUMS
system at the University of Minnesota
INTERACTION OF RACE/HISPANIC ORIGIN, PLACE OF BIRTH, AND
RESPONSE MODE
There is a powerful interaction between race/ethnicity, birthplace, and data collection
mode. The differences between race/ethnicity groups and foreign-born/U.S.-born are
much more pronounced in each response mode, especially the self-response modes
(mail and internet). Figure 7 shows the nonresponse rates to the citizenship question
by race/Hispanic Origin, mode of response, and place of birth.
Data for American Indians and Alaskan Natives are not shown in Figure 7 for two
reasons. First, the sample of individuals who are foreign-born American Indians or
Alaskan Natives is so small the estimates are not reliable. Second, at the Census
Bureau’s Spring 2018 National Advisory Committee meeting, it was revealed that
some American Indians would not respond that they were a U.S citizen because they
identify as citizens of their tribes.
The nonresponse rates for groups in Figure 7 vary a lot. U.S.-born Blacks and Whites
have a personal interview nonresponse rate of just 3.5 percent. In comparison, the
internet response mode nonresponse rate for foreign-born Blacks is 15.4 percent.
Citizenship Question Nonresponse | 19Three patterns are clear in Figure 7. First, the nonresponse rates for the foreign-born
population are almost always higher than for the U.S. born population in the same
race/origin and mode group. Second, the nonresponse rates for the self-response
modes (mail and internet) are always higher than for personal interview mode. Mode
effects are important because the Census Bureau is trying to maximize self-response
in the 2020 Census. Data in this paper indicate that if self-response modes are
maximized in the 2020 Census, it could result in higher nonresponse rates, particularly
for racial and ethnic minorities.
Third, the nonresponse rates for all groups other than the White alone or in
combination are usually higher than the rates for White alone or in combination. The
differences between White alone or in combination and all other groups are larger in
self-response modes than in personal interviews. Only two groups have lower
nonresponse rates in self-response modes (mail and internet) than White alone or in
combination: Asian alone or in combination and Hispanic.
It is also worth noting that the nonresponse follow-up in the ACS only involves a
sample of nonresponders. In the 2020 Census, census enumerators will follow up with
all nonresponders. Recall that unlike the decennial census, the ACS does not need to
get responses for 100 percent of the households.
Figure 7. Respondents Who Are Interviewed Have Lower Nonresponse Rates
Nonresponse Rates to the Citizenship Question in the 2016 ACS by Race/Hispanic Origin, Place of Birth, and
Data Collection Mode
15.4%
14.8%
12.5%
11.2% 11.6% 11.6% 11.6%
9.8% 9.9% 10.0%
9.0%
8.4%
7.5%
6.2% 6.7%
5.4% 5.4% 5.5% 5.0%
4.3% 4.7%
3.5% 3.5% 3.6%
Mail Internet Personal Interview Mail Internet Personal Interview
Born in the U.S. Foreign-Born
White Alone or in Combination Black Alone or in Combination Asian Alone or in Combination Hispanic
Source: Author’s analysis of U.S. Census Bureau's 2016 American Community Survey PUMS file on IPUMS system at the University of Minnesota.
Citizenship Question Nonresponse | 20Summary and Conclusions
here are several key points that are supported by the data presented in this paper.
T Respondents treat the question about citizenship differently than the other
questions that will be on the 2020 Census. Nonresponse rates for the citizenship
question in the ACS are much higher than the nonresponse rates for other questions
that will be included in the 2020 Census.
The nonresponse rates in the 2010 Census for six demographic and housing measures
are higher than the nonresponse rates for those measures in the 2010 to 2016 ACS.
Consequently, most of the nonresponse rates shown in this paper (from the ACS)
probably underestimate the nonresponse rates that will be experienced in the 2020
decennial census.
The methodological changes in the ACS between 2012 and 2013 had a substantial
impact on nonresponse rates for the citizenship question, but not for other key
demographic measures such as age, sex, or race. This suggests that the citizenship
question may be more sensitive to methodological changes than the other questions
that will be on the 2020 Census.
The nonresponse rates for the citizenship question vary widely across states and cities.
There are substantial differences in nonresponse rates to the citizenship question
across demographic group. Nonresponse rates are much higher for:
• Racial and ethnic minorities
• Foreign-born people, and
• Those using the self-response modes of data collection.
The data in this paper support Abowd’s conclusion with respect to the implications of
adding a question on citizenship status to the 2020 Census questionnaire: “Not only
will this likely lead to more incorrect enumerations, but it is also expected to increase
Citizenship Question Nonresponse | 21the number of persons who cannot be linked to administrative data ... .” 28 In a different
memo, Dr. Abowd goes on to say, “Those refusing to self-respond due to the
citizenship question are particularly likely to refuse to respond in NRFU as well,
resulting in a proxy response.” 29
The data presented in this study also support the conclusions of six former directors of
the Census Bureau who stated, “In summary, we believe that adding a citizenship
question to the 2020 census will considerably increase the risks to the 2020
enumeration.” 30 The data presented here also support the conclusions of the
American Statistical Association, 31 the American Sociological Association, 32 the
Population Association of America, 33 the American Association of Public Opinion
Research, 34 and the Consortium of Social Science Associations, 35 all of which are on
record as opposing the addition of the citizenship question to the 2020 Census. The
prestigious National Academy of Sciences Committee on National Statistics Task
Force on the 2020 Census warns, “According to the Census Bureau’s own analysis,
addition of the citizenship question could adversely affect the quality and the cost of
the 2020 Census.” 36
After intensive research on citizenship data, a recent paper issued by the Census
Bureau concludes, “The evidence in this paper also suggests that adding a citizenship
question to the 2020 Census would lead to lower self-response rates in households
potentially containing noncitizens, resulting in higher field work costs and a lower-
quality population count. 37
Citizenship Question Nonresponse | 22Appendix A1.
Table 1. Differential Nonresponse Rates on Questions Planned for the 2020 Census: 2010 Census and 2010 to
2016 American Community Survey
Percent Nonresponse
American Community Survey
2010
Item 2010 2011 2012 2013 2014 2015 2016
Census
Race 3.3 1.5 1.5 1.7 1.6 1.5 1.5 1.5
Hispanic origin 3.9 1.8 1.8 2.1 2.1 1.9 1.8 1.8
Sex 1.5 0.1 0.1 0.2 0.1 0.1 0.1 0.1
Age 3.5 1.3 1.3 1.3 1.6 1.6 1.7 1.7
Relationship to
1.5 1.2 1.1 1.2 1.1 1.1 1.2 1.2
Householder
Housing Tenure 4.5 1.2 1.0 1.1 1.3 1.3 1.2 1.2
Not
Citizenship 2.7 2.7 3.0 5.2 5.5 5.9 6.0
Available
Source: American Community Survey Item Allocation Rates. Available at https://www.census.gov/acs/www/methodology/sample-size-and-data-quality/item-allocation-
rates.
Source: 2010 Census rates are from U.S. Census Bureau, 2010 Census Item Nonresponse and Imputation Assessment Report. Available at
https://www.census.gov/content/dam/Census/library/publications/2012/dec/2010_cpex_173.pdf.
Citizenship Question Nonresponse | 23Table 2. States Ranked by Nonresponse Rate for the Citizenship Status Question in the 2016
American Community Survey
Rank State Nonresponse Rates Rank State Nonresponse Rates
1 Vermont 2.6 27 South Carolina 5.6
2 West Virginia 3.7 28 Montana 5.6
3 Maine 3.8 29 Texas 5.6
4 Wyoming 4.0 30 Rhode Island 5.7
5 South Dakota 4.3 31 Washington 5.7
6 Arkansas 4.5 32 Nebraska 5.7
7 Ohio 4.6 33 North Carolina 5.8
8 Delaware 4.6 34 Pennsylvania 5.8
9 Mississippi 4.7 35 Oklahoma 5.8
10 New Mexico 4.7 36 Connecticut 5.9
11 Wisconsin 4.8 37 North Dakota 5.9
12 Michigan 4.9 38 New Jersey 6.0
13 Tennessee 4.9 39 Alabama 6.0
14 Minnesota 5.0 40 Virginia 6.2
15 Kentucky 5.0 41 Nevada 6.3
16 Missouri 5.0 42 Massachusetts 6.3
17 New Hampshire 5.0 43 Alaska 6.6
18 Utah 5.1 44 Florida 6.7
19 Iowa 5.2 45 Maryland 6.8
20 Georgia 5.3 46 District of Columbia 6.9
21 Oregon 5.3 47 Hawaii 6.9
22 Kansas 5.4 48 Colorado 7.3
23 Indiana 5.4 49 New York 7.3
24 Illinois 5.4 50 California 7.7
25 Louisiana 5.5 51 Arizona 9.0
26 Idaho 5.5 U.S. 6.0
Source: American Community Survey Item Allocation Rates. Available at https://www.census.gov/acs/www/methodology/sample-size-
and-data-quality/item-allocation-rates.
Ranking based on unrounded data.
Citizenship Question Nonresponse | 24Table 3. Nonresponse Rates to Citizenship Status Question in the 2016 ACS by Metropolitan
Status
Nonresponse Rate
Inside the central or principal city of a metropolitan area 7.2
Inside metropolitan area but outside central or principal city (suburbs) 6.1
Not in metro area (Rural Areas) 5.0
U.S. 6.0
Source: Authors analysis of U.S. Census Bureau's 2016 American Community Survey PUMS file on IPUMS system at the University of
Minnesota
A large number of respondents were not included in this table because revealing their geographic location might compromise their
confidentiality
Table 4. Nonresponse Rates to the Citizenship Question on the 2016 ACS by Race
and Hispanic Origin
Non-Response
Rate
White Alone or in Combination 5.6
Black Alone or in Combination 6.8
American Indian or Alaska Native Alone or in Combination 6.0
Asian Alone or in Combination 8.1
Hispanic 7.4
Source: Author's analysis of Census Bureau's 2016 ACS PUMS file on the IPUMS system at the University of Minnesota
Table 5. Nonresponse Rates to the 2016 ACS Citizenship
Status Question by Place of Birth
Place of Birth Nonresponse Rate
Born in U.S. 5.7
Foreign born 8.3
Total 6.0
Source: Author's analysis of U.S. Census Bureau's 2016 American Community Survey
PUMS file on IPUMS system at the University of Minnesota.
Citizenship Question Nonresponse | 25Table 6. Nonresponse Rates to the Citizenship Status Question on the 2016 ACS by Data
Collection Mode
Nonreponse
Data Collection Mode Rate
Internet 8.0
Mail 6.7
Personal Interview (Computer Assistance Telephone Interview/Computer Assisted
Personal Interview) 3.8
Total 6.0
Source: Author's analysis of U.S. Census Bureau's 2016 American Community Survey PUMS file on IPUMS system at the
University of Minnesota.
Table 7. Nonresponse Rates to the Citizenship Question in the 2016 ACS by Race/Hispanic Origin, Place
of Birth, and Data Collection Mode
Born in the U.S. Foreign-Born
Personal Personal
Mail Internet Interview Mail Internet Interview
White Alone or in
Combination 5.4 6.7 3.5 11.2 11.6 4.7
Black Alone or in Combination 9.8 12.5 3.5 15.4 14.8 5.4
Asian Alone or in Combination 8.4 9.9 4.3 10.0 9.0 5.5
Hispanic 6.2 7.5 3.6 11.6 11.6 5.0
Source: Author’s analysis of U.S. Census Bureau's 2016 American Community Survey PUMS file on IPUMS system at the University of Minnesota.
Citizenship Question Nonresponse | 26Appendix A2. Standard Errors
There are no standard errors provided for the data in Table 1, which are from the
Census Bureau website. There are no standard errors provided for the data in Table 2
which are from the Census Bureau website, but Table A2 below shows estimates and
standard errors for states from the ACS PUMS file.
Table A2. Standard Errors for State Estimates of Nonresponse Rate for the Citizenship Status Question in
the 2016 American Community Survey
Nonresponse Standard Nonresponse Standard
Rank State Rates Error Rank State Rates Error
1 Arizona 9.0 0.11 27 Louisiana 5.5 0.11
2 California 7.7 0.04 28 Illinois 5.4 0.06
3 New York 7.3 0.06 29 Indiana 5.4 0.09
4 Colorado 7.3 0.11 30 Kansas 5.4 0.13
5 Hawaii 6.9 0.21 31 Oregon 5.3 0.11
6 District of Columbia 6.9 0.31 32 Georgia 5.3 0.07
7 Maryland 6.8 0.1 33 Iowa 5.2 0.12
8 Florida 6.7 0.06 34 Utah 5.1 0.13
9 Alaska 6.6 0.3 35 New Hampshire 5.0 0.19
10 Massachusetts 6.3 0.09 36 Missouri 5.0 0.09
11 Nevada 6.3 0.15 37 Kentucky 5.0 0.1
12 Virginia 6.2 0.08 38 Minnesota 5.0 0.09
13 Alabama 6.0 0.11 39 Tennessee 4.9 0.08
14 New Jersey 6.0 0.08 40 Michigan 4.9 0.07
15 North Dakota 5.9 0.27 41 Wisconsin 4.8 0.09
16 Pennsylvania 5.9 0.07 42 New Mexico 4.7 0.15
17 Connecticut 5.9 0.12 43 Mississippi 4.7 0.12
18 Oklahoma 5.8 0.12 44 Delaware 4.6 0.22
19 North Carolina 5.8 0.07 45 Ohio 4.6 0.06
20 Nebraska 5.7 0.17 46 Arkansas 4.5 0.12
21 Washington 5.7 0.09 47 South Dakota 4.3 0.22
22 Rhode Island 5.7 0.23 48 Wyoming 4.0 0.26
23 Texas 5.6 0.05 49 Maine 3.8 0.17
24 Montana 5.6 0.23 50 West Virginia 3.7 0.14
25 South Carolina 5.6 0.1 51 Vermont 2.6 0.2
26 Idaho 5.5 0.18 Total 6.0 0.01
Citizenship Question Nonresponse | 27Table A3. Standard Errors for Nonresponse Rates to Citizenship Question in 2016 ACS by
Metropolitan Status
Standard Errors
Inside the central or principal city of a metropolitan area 0.05
0.03
Inside metropolitan area but outside central or principal city (suburbs)
Not in metro area (Rural) 0.04
Total 0.00
Source: Author’s analysis of U.S. Census Bureau's 2016 American Community Survey PUMS file on IPUMS system at the University of
Minnesota.
A large number of respondents were not included in this table because revealing their geographic location might compromise their
confidentiality.
Table A4. Nonresponse Rates to the Citizenship Question on the 2016 ACS by
Race and Hispanic Origin
Standard Error of
Nonresponse Rates
Non-Hispanic White Alone 0.02
Non-Hispanic Black Alone 0.04
Non-Hispanic Asian Alone 0.07
Hispanic 0.04
Source: Analysis of Census Bureau's 2016 ACS PUMS file on the IPUMS system at the University of Minnesota.
Table A5. Standard Errors for Nonresponse Rates to the
2016 ACS Citizenship Status Question by Place of Birth
Place of Birth Standard Errors
Born in U.S. 0.01
Foreign born 0.04
Total 0.0
Source: Author's analysis of U.S. Census Bureau's 2016 American Community Survey
PUMS file on IPUMS system at the University of Minnesota.
Citizenship Question Nonresponse | 28Table A6. Nonresponse Rates to the Citizenship Status Question on
the 2016 ACS by Data Collection Mode
Standard Errors
Internet 0.02
Mail 0.03
Personal Interview (Computer Assistance
Telephone Interview/Computer Assisted
Personal Interview) 0.02
Total 0.01
Source: Author's analysis of U.S. Census Bureau's 2016 American Community Survey PUMS file on
IPUMS system at the University of Minnesota.
Table A7. Standard Errors for Estimates of Nonresponse Rates to the Citizenship Question in the
2016 ACS by Race/Hispanic Origin, Place of Birth, and Data Collection Mode in the 2016 ACS
Born in the U.S. Foreign-Born
Personal Personal
Mail Internet Interview Mail Internet Interview
White Alone or in Combination 0.03 0.02 0.03 0.20 0.11 0.17
Black Alone or in Combination 0.12 0.12 0.06 0.48 0.34 0.21
Asian Alone or in Combination 0.32 0.17 0.21 0.02 0.11 0.16
Hispanic 0.12 0.1 0.05 0.22 0.18 0.08
Source: Author's analysis of U.S. Census Bureau's 2016 American Community Survey PUMS file on IPUMS system at the University of
Minnesota.
Citizenship Question Nonresponse | 29Table A8. Comparison of Nonresponse Rates from PUMS Versus Census Bureau Website
Percent Nonresponse
American Community Survey PUMS
Item 2016 2015 2014 2013 2012 2011 2010
Race 1.5 1.5 1.5 1.6 1.7 1.5 1.5
Hispanic Origin 1.8 1.8 2 2.1 2.1 1.8 1.8
Sex 0.1 0.1 0.1 0.1 0.2 0.1 0.1
Age 1.7 1.6 1.6 1.6 1.3 1.3 1.3
Relationship 1.2 1.1 1.1 1.1 1.1 1.1 1.1
Tenure
Citizenship 6.0 6 5.5 5.2 3 2.6 2.7
Percent Nonresponse
American Community Survey from Census Bureau website
Item 2016 2015 2014 2013 2012 2011 2010
Race 1.5 1.5 1.5 1.6 1.7 1.5 1.5
Hispanic origin 1.8 1.8 1.9 2.1 2.1 1.8 1.8
Sex 0.1 0.1 0.1 0.1 0.2 0.1 0.1
Age 1.7 1.7 1.6 1.6 1.3 1.3 1.3
Relationship 1.2 1.2 1.1 1.1 1.2 1.1 1.2
Tenure 1.2 1.2 1.3 1.3 1.1 1 1.2
Citizenship 6.0 5.9 5.5 5.2 3 2.7 2.7
Source: American Community Survey Item Allocation Rates. Available at https://www.census.gov/acs/www/methodology/sample-size-and-data-
quality/item-allocation-rates.
Source: 2010 Census rates from U.S. Census Bureau, 2010 Census Item Nonreponse and Imputation Assessment Report. Available at
https://www.census.gov/content/dam/Census/library/publications/2012/dec/2010_cpex_173.pdf.
Differences 2016 2015 2014 2013 2012 2011 2010
Race 0 0 0 0 0 0 0
Hispanic origin 0 0 0.1 0 0 0 0
Sex 0 0 0 0 0 0 0
Age 0 -0.1 0 0 0 0 0
Relationship 0 -0.1 0 0 -0.1 0 -0.1
Tenure
Citizenship 0 0.1 0 0 0 -0.1 0
Citizenship Question Nonresponse | 30Appendix B.
Comparison of Nonresponse Rates from PUMS versus Census Bureau website
Percent Nonresponse
American Community Survey PUMS
Item 2016 2015 2014 2013 2012 2011 2010
Race 1.5 1.5 1.5 1.6 1.7 1.5 1.5
Hispanic Origin 1.8 1.8 2 2.1 2.1 1.8 1.8
Sex 0.1 0.1 0.1 0.1 0.2 0.1 0.1
Age 1.7 1.6 1.6 1.6 1.3 1.3 1.3
Relationship 1.2 1.1 1.1 1.1 1.1 1.1 1.1
Tenure NA NA NA NA NA NA NA
Citizenship 6 6 5.5 5.2 3 2.6 2.7
Percent Nonresponse
American Community Survey from Census Bureau website
Item 2016 2015 2014 2013 2012 2011 2010
Race 1.5 1.5 1.5 1.6 1.7 1.5 1.5
Hispanic origin 1.8 1.8 1.9 2.1 2.1 1.8 1.8
Sex 0.1 0.1 0.1 0.1 0.2 0.1 0.1
Age 1.7 1.7 1.6 1.6 1.3 1.3 1.3
Relationship 1.2 1.2 1.1 1.1 1.2 1.1 1.2
Tenure 1.2 1.2 1.3 1.3 1.1 1 1.2
Citizenship 6 5.9 5.5 5.2 3 2.7 2.7
Source: American Community Survey Item Allocation Rates. Available at https://www.census.gov/acs/www/methodology/sample-
size-and-data-quality/item-allocation-rates.
Source: 2010 Census rates from U.S. Census Bureau, 2010 Census Item Nonresponse and Imputation Assessment Report at
https://www.census.gov/content/dam/Census/library/publications/2012/dec/2010_cpex_173.pdf.
Differences 2016 2015 2014 2013 2012 2011 2010
Race 0 0 0 0 0 0 0
Hispanic origin 0 0 0.1 0 0 0 0
Sex 0 0 0 0 0 0 0
Age 0 -0.1 0 0 0 0 0
Relationship 0 -0.1 0 0 -0.1 0 -0.1
Tenure
Citizenship 0 0.1 0 0 0 -0.1 0
Citizenship Question Nonresponse | 31Endnotes
1
Ross, Wilbur. “Reinstatement of a Citizenship status Question on the 2020 Decennial Census Questionnaire.”
Memorandum from Secretary of Commerce Wilber Ross to Undersecretary of Commerce Karen Dunn Kelley,
May 26, 2018.
2
Ross, Wilbur. “Reinstatement of a Citizenship status Question on the 2020 Decennial Census Questionnaire.”
Memorandum from Secretary of Commerce Wilber Ross to Undersecretary of Commerce Karen Dunn Kelley,
May 26, 2018.
3
“Item Allocation Rates 2012 through 2016 for United States.” Census Bureau. Available at
https://www.census.gov/acs/www/methodology/sample-size-and-data-quality/item-allocation-rates/.
4
“2010 Decennial Census: Item Nonresponse and Imputation Assessment Report.” Census Bureau, 24 January
2012. Available at
https://www.census.gov/content/dam/Census/library/publications/2012/dec/2010_cpex_173.pdf.
5
IPUMS. Available at https://www.ipums.org.
6
Abowd, John. “Technical Review of the Department of Justice Request to Add Citizenship Status Question to
the 2020 Census,” Memorandum for Wilbur L. Ross Jr., 19 January 2018.
7
Abowd, John. ”Preliminary analysis of Alternative D (Combined Alternatives B and C). Memorandum for
Wilbur L. Ross, Jr., 1 March 2018.
8
Camarota, Steven. “Would a Citizenship Question on the 2020 Census Reduce Response Rates?” Testimony
Prepared for the House Judiciary Committee Subcommittee on the Constitution and Civil Justice, 8 June 2018.
9
“American Community Survey Design and Methodology.” U.S. Census Bureau, 30 January 2014. Available at
https://www2.census.gov/programs-
surveys/acs/methodology/design_and_methodology/acs_design_methodology_ch15_2014.pdf.
10
“American Community Survey: Item Allocation Rates Definitions.” U.S. Census Bureau. Available at
https://www.census.gov/programs-surveys/acs/methodology/sample-size-and-data-quality/item-allocation-
rates-definitions.html.
11
Abowd, John. “Technical Review of the Department of Justice Request to Add Citizenship Status Question to
the 2020 Census,” Memorandum for Wilbur L. Ross Jr., 19 January 2018.
12
Abowd, John. “Technical Review of the Department of Justice Request to Add Citizenship Status Question to
the 2020 Census,” Memorandum for Wilbur L. Ross Jr., 19 January 2018.
13
Abowd, John. “Technical Review of the Department of Justice Request to Add Citizenship Status Question to
the 2020 Census,” Memorandum for Wilbur L. Ross Jr., 19 January 2018.
14
Clark, Sandra. “Evaluation of the Effect on Item Nonresponse of Changes to the Failed Edit Follow-Up
Operation, 2014 American Community Survey Research and Evaluation Report Memorandum Series #ACS14-
RER-26.” U.S. Census Bureau, 9 September 2014.
15
“American Community Survey Design and Methodology.” U.S. Census Bureau, 30 January 2014. Available at
https://www2.census.gov/programs-
surveys/acs/methodology/design_and_methodology/acs_design_methodology_ch15_2014.pdf.
16
To be sure, over half of people living in areas classified by the Census Bureau as rural also live in a county that
is part of one of the nation’s 383 metropolitan areas. See: Alan Berube. “Political rhetoric exaggerates economic
divisions between rural and urban America.” Brookings, 3 August 2016. Available at
https://www.brookings.edu/blog/the-avenue/2016/08/03/political-rhetoric-exaggerates-economic-divisions-
between-rural-and-urban-america.
17
U.S. Census Bureau American Factfinder, Table B99051, downloaded on August 17, 2018 at
https://factfinder.census.gov/faces/tableservices/jsf/pages/productview.xhtml?fpt=table.
18
“Revisions to the Standards for the Classification of Federal Data on Race and Ethnicity, Statistical Policy
Directive 15, Federal Register Notice.” U.S. Office of Management and Budget, 30 October 1997. Available at
http://www.Whitehouse.gov/omb/fedreg_1997standards.
19
“Guidance on Aggregation and Allocation of Data on Race for Use in Civil Rights Monitoring and
Enforcement” U.S. Office of Management and Budget, 2001.
20
Abowd, John. “Technical Review of the Department of Justice Request to Add Citizenship Status Question to
the 2020 Census,” Memorandum for Wilbur L. Ross Jr., 19 January 2018.
Citizenship Question Nonresponse | 3221
Abowd, John. ”Preliminary analysis of Alternative D (Combined Alternatives B and C).” Memorandum for Wilbur L. Ross, Jr., 1
March 2018.
22
Abowd, John. “Technical Review of the Department of Justice Request to Add Citizenship Status Question to the 2020
Census,” Memorandum for Wilbur L. Ross Jr., 19 January 2018.
23
Abowd, John. ”Preliminary analysis of Alternative D (Combined Alternatives B and C). Memorandum for Wilbur L. Ross, Jr., 1
March 2018.
24
Abowd, John. “Technical Review of the Department of Justice Request to Add Citizenship Status Question to the 2020
Census,” Memorandum for Wilbur L. Ross Jr., 19 January 2018.
25
Abowd, John. ”Preliminary analysis of Alternative D (Combined Alternatives B and C).” Memorandum for Wilbur L. Ross, Jr., 1
March 2018.
26
“2020 Census Operational Plan: A New Design for the 21st Century, Version 3.0.” U.S. Census Bureau. Available at
https://www2.census.gov/programs-surveys/decennial/2020/program-management/planning-docs/2020-oper-plan3.pdf.
27
“2020 Census Operational Plan: A New Design for the 21st Century, Version 3.0.” U.S. Census Bureau. Available at
https://www2.census.gov/programs-surveys/decennial/2020/program-management/planning-docs/2020-oper-plan3.pdf.
28
Abowd, John. ”Preliminary analysis of Alternative D (Combined Alternatives B and C). Memorandum for Wilbur L. Ross, Jr., 1
March 2018
29
Abowd, John. “Technical Review of the Department of Justice Request to Add Citizenship Status Question to the 2020
Census,” Memorandum for Wilbur L. Ross Jr., 19 January 2018.
30
Barabba, Vincent. Letter from Vincent P. Barabba and Six Former Directors of the U.S. Census Bureau to Wilbur Ross, Jr.,
Secretary of Commerce. 26 January 2018. Available at https://goo.gI/L3694b.
31
“ASA Statement Regarding Decision to Add Citizenship Question to Decennial Census.” American Statistical Association,
2018. Available at
https://www.amstat.org/asa/files/pdfs/POL-CitizenshipQuestion.pdf.
32
“ASA Fights Against Adding Citizenship Question to Census.” American Sociological Association, 2018. Available at
HTTP://WWW.ASANET.ORG/CENSUS-CITIZENSHIP-QUESTION.
33
“PAA Statement on Citizenship Question Added to 2020 Census.” Population Association of America, 2018. Available at
http://www.populationassociation.org/2018/03/27/paa-statement-on-citizenship-question-for-2020-census/.
34
.” AAPOR Statement Regarding 2020 Census.” American Association of Public Opinion Researchers, 2018. Available at
https://www.aapor.org/Publications-Media/Public-Statements/AAPOR-Statement-Regarding-2020-Census.aspx
35
“COSSA Statement on the Impact of a Citizenship Question in the 2020 Decennial Census.” Consortium of Social Science
Associations, 27 March 2018.
36
“Letter to Jennifer Jessup, Department to Commerce, Committee on National Statistics; Task Force on the 2020 Census.”
The National Academies of Sciences, Engineering and Medicine, 7 August 2018.
37
Brown, J. David, Heggeness, Misty L., Dorinski, Suzanne, M., Warren, Lawrence, and Yi, Moises, “Understanding the Quality of
Alternative Citizenship Data Sources for the 2020 Census.” 6 August 2018.
Citizenship Question Nonresponse | 33You can also read