City of Beaumont SHORT RANGE TRANSIT PLAN FY 2021/22 2023/24 - City of ...
←
→
Page content transcription
If your browser does not render page correctly, please read the page content below
City of Beaumont

SHORT RANGE TRANSIT PLAN
   FY 2021/22 – 2023/24
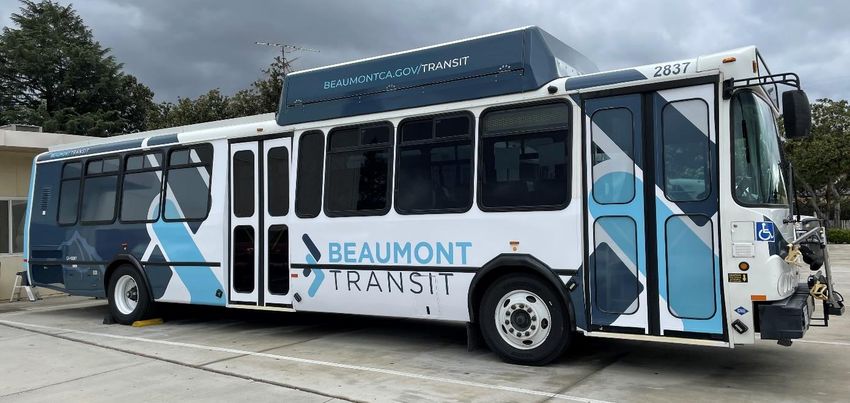
TABLE OF CONTENTS
CHAPTER 1 – SYSTEM OVERVIEW AND SERVICE PROFILE ........................................................ 4
1.1        Description of Service Area ....................................................................................................4
1.2        Population Profile and Demographics .....................................................................................5
  Ridership Demographics ...........................................................................................................................................6
1.3        Services - Fixed Route Transit Services and Paratransit Service, Regional Express Bus Service ..7
  Table 1 ......................................................................................................................................................................8
  Fixed Route ...............................................................................................................................................................9
  Paratransit Services ..................................................................................................................................................9
  Regional Express Bus Service ....................................................................................................................................9
1.4        Ridership, Revenue Miles, Revenue Hours ............................................................................ 10
  Fixed Route .............................................................................................................................................................10
  Paratransit Services ................................................................................................................................................10
  Regional Express Bus Service ..................................................................................................................................11
1.5        Current Fare Structure ......................................................................................................... 12
  Fare Collection Systems ..........................................................................................................................................12
  Incentive Programs and Ridership Promotion ........................................................................................................13
1.6        Revenue Fleet ..................................................................................................................... 13
  Table 1.1 BUS ..........................................................................................................................................................14
  Table 1.1 COM ........................................................................................................................................................15
  Table 1.1 DAR ..........................................................................................................................................................16
1.7        Existing Facilities and Bus Stop Amenities ............................................................................. 17
1.8        Existing Coordination Between Transit Agencies ................................................................... 18
1.9        Prior or Existing Studies and Plans ........................................................................................ 18
CHAPTER 2 - EXISTING SERVICE AND ROUTE PERFORMANCE ................................................ 19
2.1        Key Performance Indicators ................................................................................................. 20
  Table 2.0 .................................................................................................................................................................21
2.2        SRTP Performance Report .................................................................................................... 22
  Table 2.1 .................................................................................................................................................................23
2.3        SRTP Service Summary ......................................................................................................... 24
  Table 2.2 Service Summary All Routes ....................................................................................................................25
  Table 2.2 Service Summary Excluded Routes .........................................................................................................27
  Table 2.2 Service Summary Non-Excluded Routes .................................................................................................28
  Table 2.2 Service Summary BUS .............................................................................................................................30
  Table 2.2 Service Summary DAR .............................................................................................................................31
  Table 2.2A ...............................................................................................................................................................32
2.4        Service Performance ............................................................................................................ 33
  Casino Express ........................................................................................................................................................33
  Route 3 ....................................................................................................................................................................34
  Route 4 ....................................................................................................................................................................36
  Route 7 ....................................................................................................................................................................38
  Route 9 ....................................................................................................................................................................38
  Route 3/4 ................................................................................................................................................................39
  Commuter Link 120.................................................................................................................................................41
  Commuter Link 125.................................................................................................................................................43
  Commuter Link 120/125 Combo.............................................................................................................................45
  Dial A Ride (Paratransit) ..........................................................................................................................................47
  Table 2.3 .................................................................................................................................................................48

Beaumont Transit SRTP 21/22 - 23/24                                                                                                                              2 | Page
2.5         Productivity Improvement Efforts ........................................................................................ 50
2.6         Major Trip Generators.......................................................................................................... 50
2.7         Recent Service Changes ........................................................................................................ 51
   Casino Express ........................................................................................................................................................51
   Commuter Link 125.................................................................................................................................................51
CHAPTER 3 – FUTURE SERVICE PLANS, FARE CHANGES, CAPITAL PLANNING, AND MARKETING
........................................................................................................................................... 51
3.1         Planned Service Changes ...................................................................................................... 51
3.2         Future Marketing Plans, Studies, and Promotions to Promote Ridership ............................... 52
   Free Fare Promotion ...............................................................................................................................................52
   Annual Promotions .................................................................................................................................................52
   Redevelopment of Walmart Regional Transportation Hub ....................................................................................53
3.3         Projected Ridership Growth ................................................................................................. 53
3.4         Proposed Fare Structure Changes ......................................................................................... 53
3.5         Capital Improvement Planning ............................................................................................. 54
   CNG Fueling Station ................................................................................................................................................54
   Maintenance and Operations Facility .....................................................................................................................54
   Vehicle Replacement Plan ......................................................................................................................................54
   Bus Stop Placement Policy and Improvement Plan ................................................................................................54
   Introduce Technology to Offer Predictive Arrival Features ....................................................................................54
   Table 3 ....................................................................................................................................................................55
CHAPTER 4 – FINANCIAL PLANNING ..................................................................................... 56
4.1         Operating and Capital Budget............................................................................................... 56
   Operating Budget ....................................................................................................................................................56
   Table 4 ....................................................................................................................................................................57
   Table 4B Farebox Calculations ................................................................................................................................58
   Capital Budget .........................................................................................................................................................59
   2- EZ Rider II CNG Buses (Project 22-01) .................................................................................................................59
   Video Camera Purchase and Installation (Project 22-02) .......................................................................................61
   Paratransit Scheduling Software (Project 22-03) ....................................................................................................63
   Mobile Lifts (Project 22-04) ....................................................................................................................................65
4.2         Funding Plans to Support Proposed Operating and Capital Program ...................................... 67
   Table 4.1 .................................................................................................................................................................67
   Table 4.2 .................................................................................................................................................................69
4.3         Regulatory and Compliance Requirements ........................................................................... 71
   Table 4.3 .................................................................................................................................................................72
4.4         Open Capital Projects ........................................................................................................... 73
   Table 4.4 .................................................................................................................................................................74

Beaumont Transit SRTP 21/22 - 23/24                                                                                                                              3 | Page
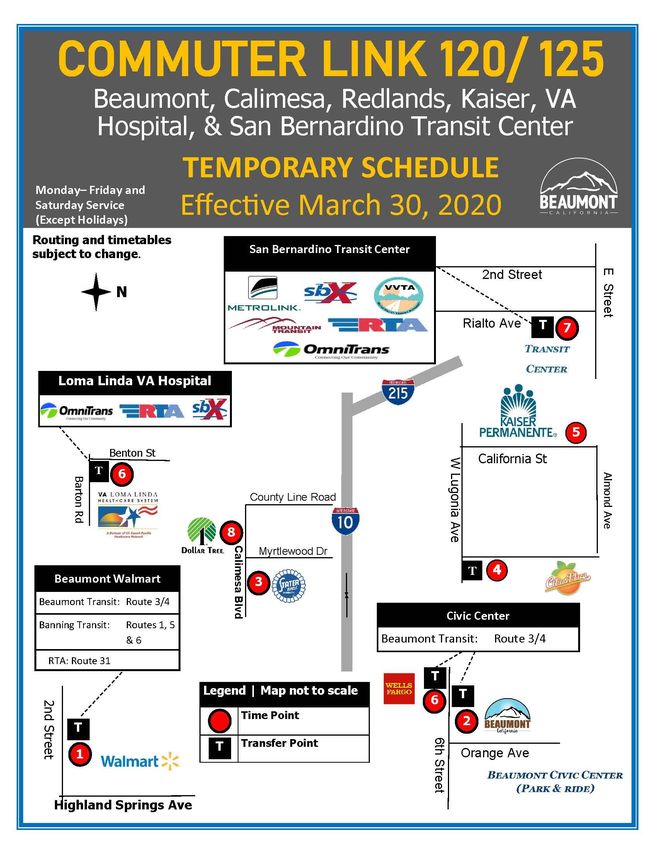
CHAPTER 1 – SYSTEM OVERVIEW AND SERVICE PROFILE
1.1    Description of Service Area
The City of Beaumont’s public transit system services approximately 50 square miles and includes
the City of Beaumont and parts of unincorporated Riverside County area known as Cherry Valley.
Additionally, Beaumont transports passengers to the commercial areas of Cabazon, including
Casino Morongo and the Desert Hills Premium Outlet Malls.

At the center of three major thoroughfares, including Interstate 10, Highway 60 and Highway 79,
Beaumont offers fixed route, commuter link, and paratransit service. Passengers can connect
easily with other Beaumont routes, as well as with regional transit providers such as Banning,
Riverside Transit Agency (RTA) and Sunline Transit Agency at one central location, the Beaumont
Walmart transit center.

Beaumont operates two commuter link routes that connect San Gorgonio Pass area residents
with San Bernardino County. This express service from Beaumont stops in Calimesa, the San
Bernardino Transit Center (SBTC), Kaiser Permanente Redlands medical offices, downtown
Redlands, and the Jerry L. Pettis Memorial Veterans Administration Medical Center (VA). The
SBTC is centrally located within downtown San Bernardino and offers extensive connection
possibilities for passengers, including the Metrolink train system, OmniTrans, Victor Valley
Transit Agency (VVTA), RTA and Mountain Transit.

Beaumont Transit SRTP 21/22 - 23/24                                                    4 | Page
1.2     Population Profile and Demographics
According to the most recent report published by California Department of Finance in May 2020,
Beaumont is the fastest growing city not only in Riverside County, but also in the State of
California. Beaumont has experienced a 3.72% population increase from January 2019 to January
2020 and has an estimated population of 51,4751. Since the 1980s, Beaumont’s population has
increased exponentially and has held the title of fastest growing city in Riverside County for
several years.

                                         Population Growth
              60000

              50000

              40000

              30000

              20000

              10000

                  0
                       1980    1990   2000    2010    2013    2014   2015   2019   2020

                                                      Year

Beaumont has twelve (12) schools located within Beaumont Unified School District consisting of
seven (7) elementary schools, two (2) middle schools, two (2) senior high schools, and one (1)
charter school. Transportation provided by Beaumont Unified School District was eliminated in
2008 and many families rely on Beaumont’s public transportation system to transport youth
passengers to and from school. Beaumont’s youth population (age 18 and under) equals 36%2;
however, ridership reports taken throughout the year show youth passengers make up 56% of
the total passenger base in Beaumont.

Beaumont has three large active adult communities, with another two located in Cherry Valley.
Although the median age of residents in Beaumont is 35 years, persons over the age of 65 make
up 13.5% of the population, not including those living in Cherry Valley3. The growing active adult
communities and the corresponding increase in population for this age group may impact
paratransit and fixed route needs.

1
  State of California, Department of Finance
2
  2015-2019 American Community Survey 5-year Estimates U.S. Census Bureau
3
  Ibid

Beaumont Transit SRTP 21/22 - 23/24                                                       5 | Page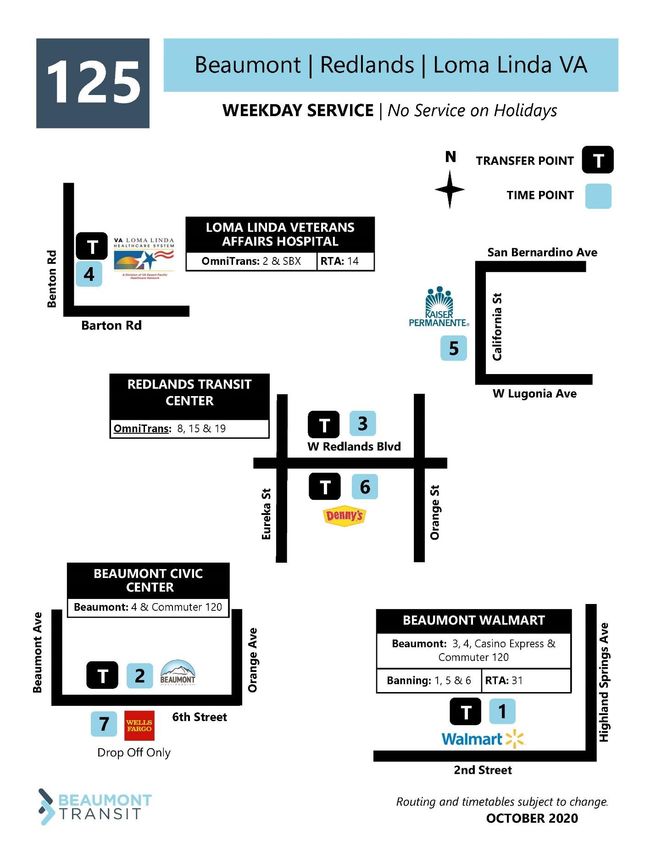
The mean household income in Beaumont is $84,105, below California’s statewide mean
household income of $101,4934. The percentage of families in Beaumont whose income is below
poverty level is 10.5%.

For California residents over the age of 16 years, 63.5% participate in the labor force, where
Beaumont shows almost equal to the state at 61.3%. The mean travel time to work for residents
of Beaumont is 34.4 minutes. This means that most of the labor force works outside of
Beaumont’s city limits and into neighboring areas including Redlands, San Bernardino, Moreno
Valley, and Palm Springs areas.

Beaumont residents make up two predominant races with Hispanic or Latino at 46.5%, 64.9 %
are White, and 22.4% identify themselves as Black, Asian or Other.5

                 70.00%        64.90%              Race
                 60.00%

                 50.00%   46.50%

                 40.00%

                 30.00%

                 20.00%
                                    9.10% 8.80%
                 10.00%                                4.50%
                  0.00%
                                        Race
                               Hispanic        White      Black   Asian   Other

Almost 87.5% of residents over 25 years have at least a high school diploma (or equivalent) with
26.1% earning a bachelor’s degree or higher degree6.

Ridership Demographics
Ridership surveys were conducted in December 2019 and January 2020, before COVID-19
shutdown, as part of the 2020 Comprehensive Operations Analysis. There were 427 responses.

General passengers surveyed indicate that 68% live in a household with an annual income of less
than $30,000. Approximately half of the passengers ride the service five or more days per week,
with 70.5% indicating that they lack access to a personal vehicle. Additionally, almost 54% state
that they use the service to travel either to work or school.

4
  Ibid
5
  Ibid
6
  Ibid

Beaumont Transit SRTP 21/22 - 23/24                                                     6 | Page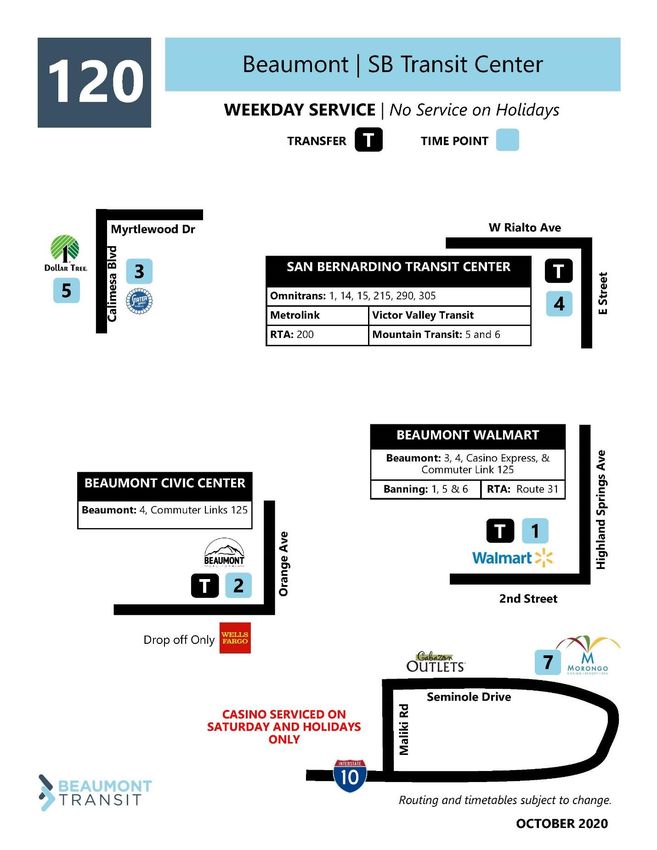
Of the passengers surveyed, 36.4% state that they are Hispanic or Latino and 70.3% are 25 years
or age and over.

1.3 Services - Fixed Route Transit Services and Paratransit Service, Regional
Express Bus Service

Prior to COVID-19, Beaumont Transit operated seven days a week. Since March of 2020,
Beaumont Transit has been operating six days a week. There have been many adjustments to
the service schedule over the past year. The current service schedule is listed below. Included
are the suspended routes of Route 3, 7 and 9. Route 3 will resume service in April 2021 and the
peak Routes 7 and 9 will resume service as COVID recovery continues:

 Sunday     Monday         Tuesday      Wednesday      Thursday        Friday      Saturday
            Casino          Casino       Casino         Casino        Casino
            Express        Express       Express        Express       Express
            Route 3        Route 3       Route 3        Route 3       Route 3
            Route 4        Route 4       Route 4        Route 4       Route 4
                                                                                   Route 3/4
            Route 7*       Route 7*      Route 7*      Route 7*      Route 7*
            Route 9*       Route 9*      Route 9*      Route 9*      Route 9*
           Commuter       Commuter      Commuter      Commuter      Commuter      Commuter
              120            120           120           120           120          120
           Commuter       Commuter      Commuter      Commuter      Commuter
              125            125           125           125           125
* Peak Service

Beaumont Transit SRTP 21/22 - 23/24                                                   7 | Page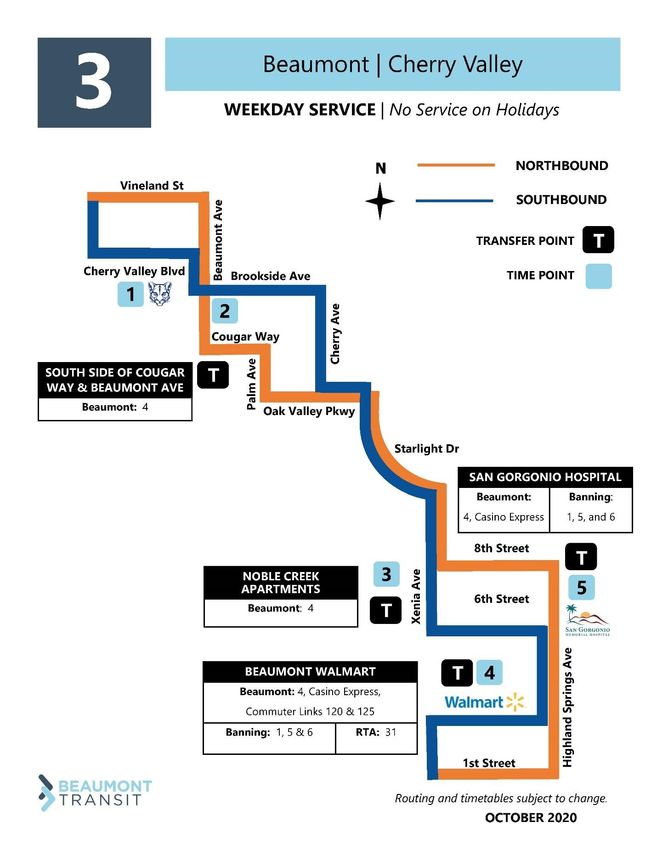
Table 1
Description of Routes
Route Description Major Destinations
Downtown to Walmart with Express Second Street Marketplace and restaurants, Walmart Regional Connection Stop, San
Casino Express Weekday
Service to Cabazon Gorgonio Hospital servicing Casino Morongo and Outlet Malls via the I-10 freeway.
Second Street Marketplace and restaurants, Walmart Regional Connection Stop, San
Gorgonio Hospital, Sundance Community, Mountain View Middle School, San
3 Weekday Walmart to Cherry Valley via Sundance
Gorgonio Middle School, Albert Chatigny Community Recreation Center, Sports Park,
Cherry Valley commercial, Cherry Valley Deviations and Beaumont High School
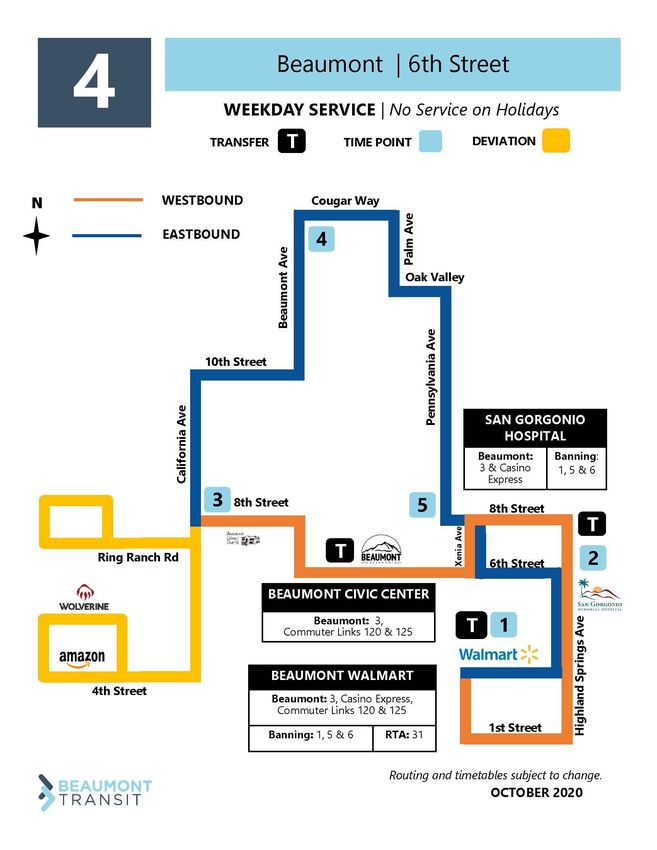
Second Street Marketplace and restaurants, Walmart Regional Connection Stop, San
Gorgonio Hospital, downtown residential areas, Glen View High School, library, 3
Walmart to Downtown via 3 Rings
4 Weekday Rings Ranch Community, Palm Ave, Mountain View Middle School, San Gorgonio
Ranch
Middle School, Sports Park, Beaumont High School, north residential area, Albert
Chatigny Community Recreation Center, Pennsylvania Ave
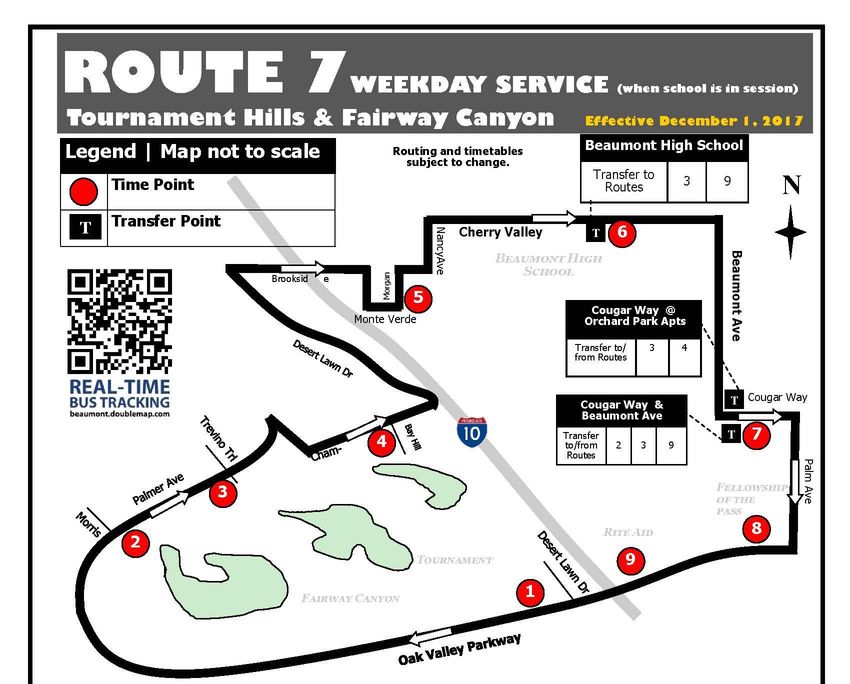
Tournament Hills and Fairway Canyon Following the Beaumont School District calendar: Western masterplan communities
Weekday (Peak
7 to Middle Schools and Beaumont High of Tournament Hills, Fairway Canyon to Beaumont High School, Mountain View
Service)
School Middle School, San Gorgonio Middle School, Oak Valley Shopping Center
Following the Beaumont School District calendar: Southern masterplan communitiy
Weekday (Peak Seneca Springs to Middle Schools and
9 of Seneca Springs, Beaumont High School, Mountain View Middle School, and San
Service) Beaumont High School
Gorgonio Middle School
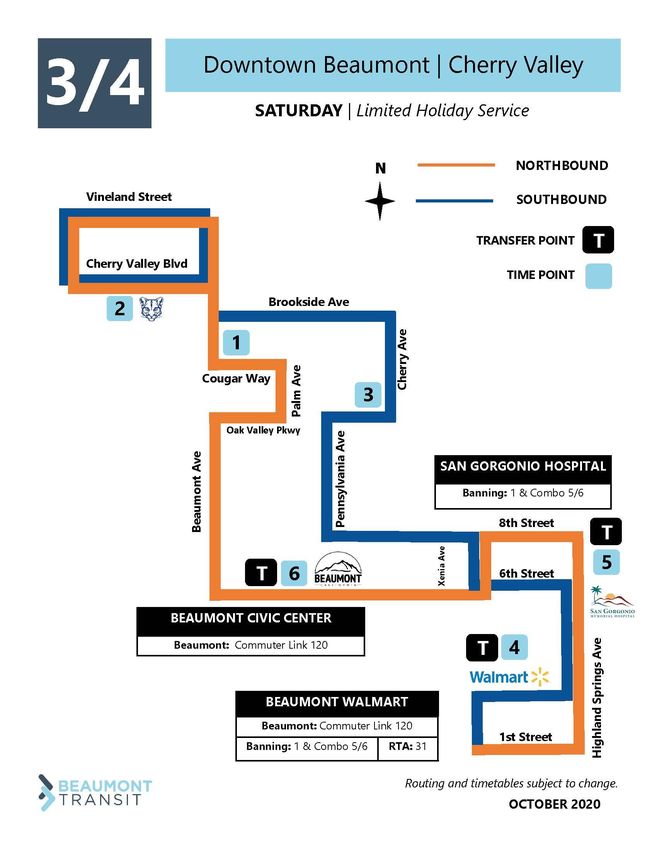
Second Street Marketplace and restaurants, Walmart Regional Connection Stop, San
Gorgonio Hospital, downtown residential areas, Glen View High School, library, 3
Walmart to Cherry Valley via
3/4 Weekend Rings Ranch Community, Palm Ave, Mountain View Middle School, San Gorgonio
Downtown
Middle School, Sports Park, Beaumont High School, Cherry Valley Commercial, north
residential area, Albert Chatigny Community Recreation Center, Pennsylvania Ave
Weekday and Walmart to San Bernardino Transit Walmart, Beaumont Civic Center, Calimesa downtown shopping centers, Calimesa
CL 120
Saturday Center Library, San Bernardino Transit Center
Walmart to Loma Linda Veterans Walmart, Beaumont Civic Center, Redlands Transit Center, Kaiser Redlands Medical
CL 125 Weekday
Hospital Office, Loma Linda Veteran's Affairs Hospital and Loma Linda Medical Center
Service for Seniors 65+, and persons certified under American Disability Act (ADA)
that live in the City of Beaumont and parts of Cherry Valley who are going to places in
City Wide
Weekday Demand Response/Reservation Based Beaumont or certain areas within Cherry Valley. Additionally, service is provided to
DAR persons who live withing 3/4 of a mile from a FR stop and going to a destination also
within an area of 3/4 of a mile from a FR stop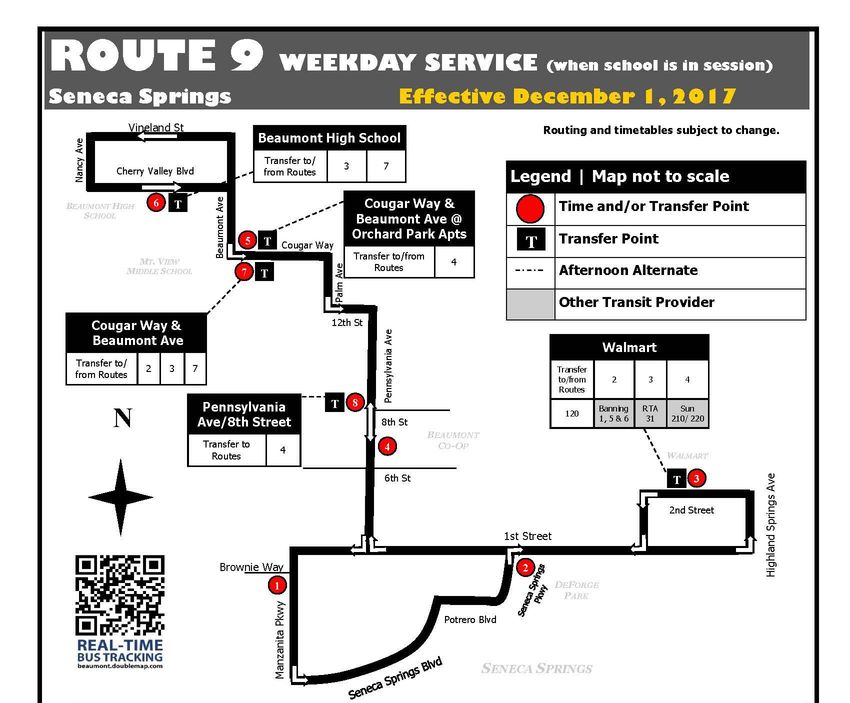
Fixed Route
Beaumont normally operates five weekday fixed routes, two in peak service only, and one
weekend fixed route. Due to COVID-19, the two peak route services have been suspended due
to the close of the school district in March of 2020.

Fixed Route service hours are:
              Monday through Friday                        6:30 a.m. to 6:40 p.m.
               Saturday                                    8:00 a.m. to 5:00 p.m.

During the holidays of Martin Luther King Jr. Day, Presidents’ Day, Columbus Day, Veterans Day,
Day after Thanksgiving, Christmas Eve and New Year’s Eve Beaumont operates limited service
and follows a Saturday schedule.

Beaumont does not operate on New Year’s Day, Memorial Day, Independence Day, Labor Day,
Thanksgiving Day, or Christmas Day.

Paratransit Services
Paratransit service, otherwise known as Dial-A-Ride (DAR), is a reservation-based curb to curb
service for residents of Beaumont and parts of unincorporated Cherry Valley. Qualified
passengers include those who reside 3/4 of a mile from a fixed bus route and are certified under
the American with Disabilities Act (ADA). Due to COVID-19, Beaumont Transit has suspended
transportation of passengers 65 years of age or over, without ADA certification.

DAR service hours are:
Persons with ADA certification
              Monday through Friday         6:30 a.m. to 6:30 p.m.
              Saturday                      8:00 a.m. to 5:00 p.m.

DAR observes the same holiday schedule as the fixed route system. Limited Service is provided
on Martin Luther King Jr. Day, Presidents’ Day, Columbus Day, Veterans Day, and Day after
Thanksgiving. No service is provided on New Year's Day, Memorial Day, Independence Day, Labor
Day, Thanksgiving Day, or Christmas Day.

Regional Express Bus Service
Beaumont operates two regional express routes, including Commuter Link (CL) 120 and
Commuter Link (CL) 125. The CL 120 originates at Beaumont’s Walmart transit center and
provides service to and from Walmart, the Beaumont Civic Center, Calimesa, and San Bernardino
Transit Center (SBTC). The CL 125 also originates at Beaumont Walmart transit center and
provides service to and from Redlands Transit Center, Loma Linda VA Hospital, and Kaiser Medical
Offices in Redlands.

Beaumont Transit SRTP 21/22 - 23/24                                                    9 | Page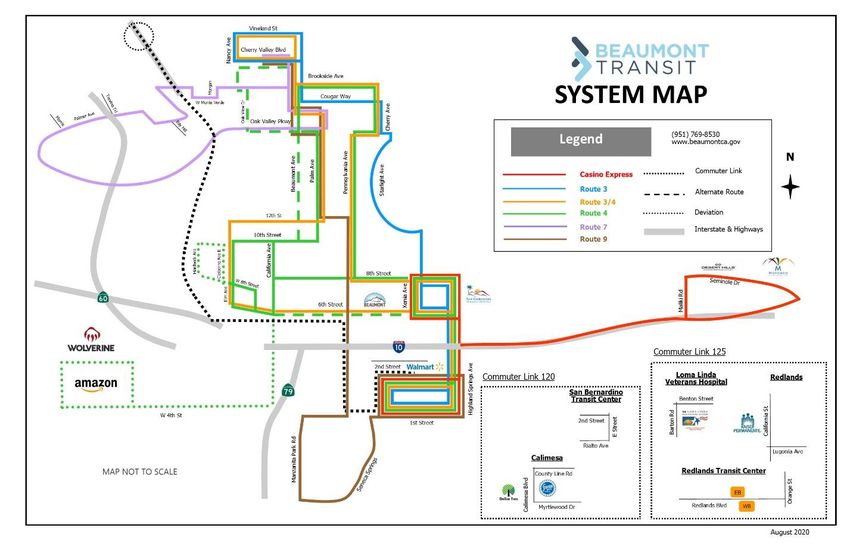
Commuter Link service hours are:
            Monday through Friday                                    5:30 a.m. to 7:00 p.m.
             Saturday                                                7:30 a.m. to 5:20 p.m.

1.4     Ridership, Revenue Miles, Revenue Hours
Fixed Route
In fiscal years 2017, 2018, and 2019 passenger boardings were similar. The average boardings
for the three years was 175,237. In FY 21 SRTP, Beaumont Transit forecasted passenger
boardings would see a decrease of 39% to close out FY 20. Actual numbers at year end FY 20
show an actual decline of 52% over prior years. Total fixed route passenger boardings for FY 20
was 83,699. Unfortunately, most of FY 21 experienced the effects of COVID-19 and passenger
boardings continued to decrease. It is projected that total fixed route passenger boardings at
year end FY 21 will be 20,623. This is a 75% decline from FY 20 and an 88% decline compared
to FY’s 17, 18, and 19 passenger boardings.

                Annual Fixed Route Passenger Boardings

 Local FR

            -   20,000   40,000   60,000   80,000 100,000 120,000 140,000 160,000 180,000 200,000

                              2021 projected   2020    2019   2018     2017

Paratransit Services
In response to the pandemic and social distancing guidelines due to COVID-19, Beaumont
Transit’s Dial-A-Ride (DAR) has experienced a decrease in passenger trips in FY 20 compared to
FY 19 by 34%. In FY 19, there were 8,862 passenger trips. FY 20 ended with 5,820 passenger
trips. FY 21 is projected to have completed 1,909 passenger trips which is a 78% decline from
FY 19 and a 67% decline from FY 20. The decline can be attributed to the reduction of service
to only those persons certified under the Americans Disability Act, as well as to the stay-at-
home orders issued by the State.

Beaumont Transit SRTP 21/22 - 23/24                                                                 10 | Page
Annual Paratransit Passenger Boardings
DAR
- 2,000 4,000 6,000 8,000 10,000 12,000
2021 projected 2020 2019 2018 2017
Regional Express Bus Service
Commuter Link service has experienced a small decrease in passenger boardings compared to
the fixed route and DAR services that Beaumont Transit offers. The fractional decline in
boardings can be attributed to an increase of service and frequency of the service. In 2019
there were 18,252 boardings. FY 20 had 17,224 boardings and is a modest 6% decline
compared to FY 19. FY 21 is projected to end with 11,958 passenger boardings which is a 31%
decline compared to FY 20 and a 35% decline compared to FY 19.
Annual Commuter Passenger Boardings
Commuter
- 2,000 4,000 6,000 8,000 10,000 12,000 14,000 16,000 18,000 20,000
2021 Projected 2020 2019 2018 2017
Beaumont Transit SRTP 21/22 - 23/24 11 | Page1.5 Current Fare Structure
Fixed Route
On fixed route service, passengers pay general fare unless they qualify for a discounted fare.
Discounted fares are available to seniors, persons with disabilities, veterans, or active military.
Children 46" tall or under ride for $0.25 with a paying adult. The following is the current fare
structure:
Fare Category Base Fare Day Pass 10 Ticket Monthly Pass
Book
General $1.25 $3.10 $12.50 $39.13
Child (46” tall or under) Accompanied by $0.25 N/A N/A N/A
a paying adult. Limit 2
Senior/Disabled (60+) $0.75 $1.90 $7.50 $24.80
Military Veterans $0.75 $1.90 $7.50 $24.80
Deviations (Route 3 and 4) $0.50 N/A N/A N/A
Go Pass: MSJC Students Free N/A N/A N/A
(During valid session only)
Active Military Free N/A N/A N/A
Paratransit Services
Fare Categories Base Fare 10-Ride Punch Card
One-Way $2.00 $18.00
Companion & Child $3.00 N/A
PCA (with ID) Free Free
No Show $2.00 N/A
Regional Express Bus Service
Fare Categories Base Fare 10 Ride Punch Day Pass Monthly
Card Pass
General $3.50 $31.50 $8.00 $75.00
Child (46” tall or under) Accompanied by $2.50 $22.50 $6.00 $50.00
a paying adult. Limit 2
Senior/Disabled (60+) $2.50 $22.50 $6.00 $50.00
Military Veterans $2.50 $22.50 $6.00 $50.00
Active Military Free N/A N/A N/A
Fare Collection Systems
There are a variety of options available to passengers to pay fares. Passengers can purchase
monthly passes at the Beaumont Civic Center where cash, check or credit cards are acceptable
forms of payment. Onboard the bus, passengers can purchase ticket books, punch cards, and
day passes from the driver using cash or check. Beaumont Transit has partnered with Token
Beaumont Transit SRTP 21/22 - 23/24 12 | PageTransit as a mobile fare option. With Token Transit, passengers can purchase their fare media
and store it on their phone.
Token Transit is used primarily on the peak routes: Routes 7 and 9. In FY 20, 28% of the
passengers on Route 7 use Token Transit, while 30% of the Route 9 passengers use Token
Transit. The use of Token Transit on these peak routes can be attributed to a younger
passenger base that is susceptible to using smart phones for everyday uses. Systemwide,
passengers predominately use cash or prepaid tickets as their preferred fare media for
transportation.
Incentive Programs and Ridership Promotion
Before COVID-19, Beaumont Transit actively participated in many community events
throughout the calendar year, including the annual Cherry Festival parade, holiday light parade,
Touch-A-Bus, Trunk-or-Treat, Veteran’s Expo, Stuff-the-Bus, and Free Fare Friday.
Beaumont Transit applied for and received funding for a free fare promotion through Low
Carbon Transportation Operation Program (LCTOP) for FY 20. All passengers have been able to
ride Beaumont Transit free because of this grant funding opportunity. Beaumont Transit is
partnering with our neighboring agency, Banning Connect, to continue to offer free fare for
passengers from July 2021 through December 2021. Beaumont and Banning will jointly share
advertising and outreach efforts to gain confidence of our choice and dependent passengers to
get on board public transportation again as we recover from COVID-19 restrictions.
Beaumont offers a real-time bus tracking system called Double Map for our passengers to use.
This program, initially purchased in 2014, promotes the reliability of the local transit system for
passengers. This real-time bus tracking is accessible on a free smart phone app or through any
connection with the Internet. This program gives passengers the ability to find and track their
buses to eliminate unnecessary waiting.
1.6 Revenue Fleet
Beaumont Transit’s fleet consists of twenty-two vehicles, fourteen of which are CNG fueled and
the other eight by gasoline, as shown in Tables 1.1. Two of the gas buses are out of service and
are in the process of being replaced with electric shuttles. Three new CNG vehicles were
delivered in FY 21 and are in service. The CNG fueled vehicles meet the emission mitigation
standards mandated by the California Air Resources Board (CARB).
Beaumont maximizes the life of vehicles in our fleet. Most of the vehicles are considered
Medium Duty vehicles under Federal Transit Administration (FTA) and have a 7-year, 200,000-
mile life expectancy7. Beaumont maintenance keeps vehicles in service longer than FTA
guidelines.
7
https://www.transitwiki.org/TransitWiki/images/6/64/Useful_Life_of_Buses.pdf
Beaumont Transit SRTP 21/22 - 23/24 13 | PageTable 1.1 - Fleet Inventory
FY 2021/22 Short Range Transit Plan
City of Beaumont
Bus (Motorbus) / Directly Operated
Average Lifetime
# of Life to Date Miles Per Active
Active # of Life to Date Vehicle Miles Vehicle As Of
Lift and Fuel Vehicles Contingency Vehicle Miles through Year-To-Date
Year Mfg. Model Seating Ramp Vehicle Type FY 2020/ Vehicles Prior Year End March (e.g., March)
Built Code Code Capacity Equipped Length Code 21 FY 2020/21 FY 2019/20 FY 2020/21 FY 2020/21
2010 CMD C 5500 28 1 32 CN 230,600 233,880
2015 EBC XHF 40 43 1 40 CN 57,702 69,003
2011 EDN EDN 30 1 33 GA 278,190 297,396
2011 EDN EDN 30 1 33 CN 165,591 173,617
2015 EDN XHF 40 43 1 40 CN 51,249 73,757
2015 EDN XHF 40 43 1 40 CN 48,907 67,721
2019 GLV GLV 28 1 33 CN 2,919
2019 GLV GLV 28 1 33 CN 2,847
2009 GMC C-5500 28 1 32 CN 187,418 188,545
2009 STR C-5500 28 1 32 CN 219,620 224,959
Totals: 329 10 1,239,277 1,334,644
TransTrack Manager™ Page 1 of 1
4/22/2021Table 1.1 - Fleet Inventory
FY 2021/22 Short Range Transit Plan
City of Beaumont
Commuter Bus / Directly Operated
Average Lifetime
# of Life to Date Miles Per Active
Active # of Life to Date Vehicle Miles Vehicle As Of
Lift and Fuel Vehicles Contingency Vehicle Miles through Year-To-Date
Year Mfg. Model Seating Ramp Vehicle Type FY 2020/ Vehicles Prior Year End March (e.g., March)
Built Code Code Capacity Equipped Length Code 21 FY 2020/21 FY 2019/20 FY 2020/21 FY 2020/21
2018 EDN EZRider II 30 1 32 CN 72,726 111,121
2011 EDN FORD 550 30 1 33 GA 318,361 339,791
2011 EDN FORD F550 30 1 33 GA 338,738 358,625
2016 EDN FORD F550 30 1 33 CN 94,643 119,368
2010 FRD Ford E450 16 1 24 GA 345,017 359,779
2010 FRD Ford E-450 16 1 24 GA 396,901 413,377
2010 FRD Ford E-450 16 1 24 GA 379,989 389,699
2019 GLV GLV 28 1 33 CN 2,833
2010 STR C-5500 30 1 32 GA 341,112 354,712
Totals: 226 9 2,287,487 2,449,305
TransTrack Manager™ Page 1 of 1
4/22/2021Table 1.1 - Fleet Inventory
FY 2021/22 Short Range Transit Plan
City of Beaumont
Demand Response / Directly Operated
Average Lifetime
# of Life to Date Miles Per Active
Active # of Life to Date Vehicle Miles Vehicle As Of
Lift and Fuel Vehicles Contingency Vehicle Miles through Year-To-Date
Year Mfg. Model Seating Ramp Vehicle Type FY 2020/ Vehicles Prior Year End March (e.g., March)
Built Code Code Capacity Equipped Length Code 21 FY 2020/21 FY 2019/20 FY 2020/21 FY 2020/21
2016 EDN FORD E-450 20 1 24 CN 51,571 57,918
Totals: 20 1 51,571 57,918
TransTrack Manager™ Page 1 of 1
4/22/2021All vehicles meet the ADA accessibility requirements and are equipped with bike racks. Vehicle capacity ranges in size from 16 passengers to 43 passengers. Beaumont Transit is in the finishing stages of rebranding our agency from Beaumont Pass Transit to Beaumont Transit. We have rebranded our buses with new wraps. Below is an example of our new bus wrap. 1.7 Existing Facilities and Bus Stop Amenities Existing Transit Facilities Administrative services for Beaumont Transit are temporarily located in the heart of downtown Beaumont at the Beaumont Civic Center, 550 E 6th Street, Building D. It is at this location where dispatch, administrative assistance, and the operations yard are located. Customer service calls for general information, route planning, and Dial-A-Ride appointments are serviced at this location, while walk in customers, including the purchase of fare media, are serviced within the main civic center building. The Fleet maintenance operations is located at 550 California Ave, approximately 1 mile from the administrative building. Bus Stop Amenities Beaumont has 23 bus shelters, 157 bus stops, and a dozen stops with benches. Staff is working with the City of Beaumont Engineering Department to create plans and a request for proposal to improve the Walmart Regional Bus Stop which connects passengers with four transit agencies. This improvement is funded by the Low Carbon Transportation Operations Program Beaumont Transit SRTP 21/22 - 23/24 17 | Page
(LCTOP) FY 18 award. Additionally, LCTOP will install bus shelters at two other locations located
in the disadvantaged community of Beaumont, including the Beaumont Library.

1.8       Existing Coordination Between Transit Agencies
Because the San Gorgonio Pass area is geographically isolated from the desert, western Riverside
County and the urban area of San Bernardino county, public transit coordination is vital for the
movement of passengers. Passengers traverse cities to accomplish needs such as social services,
employment opportunities, and more diverse commercial businesses.

Beaumont has entered into multiple agreements with surrounding transit operators, including
Banning, OmniTrans, RTA, and Victor Valley Transit Authority (VVTA). The 2019 interagency
agreement with Banning has an added feature of a paper transfer system, reminiscent of the
early 2000s. This has proven to be problematic to Beaumont’s transit-dependent residents
needing to access social services, the courthouse, and DMV services, all located in Banning, as
they are now faced with a “two-seat” ride each way.

Agreements with OmniTrans, RTA and VVTA have added value for connecting passengers.
      - Passengers presenting a Beaumont multi use (day or month) pass can connect to
         OmniTrans, RTA or VVTA for free wherever the two agencies connect.
      - Passengers presenting a multi-use (day, week, or month) pass from OmniTrans or
         VVTA receive a $1.00 discount on commuter service or free connection with our fixed
         route wherever we connect.
      - Passengers presenting RTA multi use pass (day, week, or month) connect for free to
         Beaumont’s commuter and fixed route service wherever the two agencies connect.

1.9       Prior or Existing Studies and Plans
Beaumont completed a Comprehensive Operations Analysis (COA) in 2020. There are three
phases to implementing the action plan outlined by the independent consultant.

      •   Phase 1 was a discovery phase wherein surveys were conducted, on-time performance
          analyzed, and preliminary findings were documented.
      •   Phase 2 addressed a funding analysis including a fare equity analysis, route evaluation,
          and service recommendations.
      •   Phase 3 developed an action plan including a 5-year action plan with short-term, mid-
          term, and long-term recommendations.

The COA Short-Term plan includes discussing a return to regular service under the guidance
provided by the Centers for Disease Control (CDC). Vehicle capacity is discussed as the biggest
challenge moving forward and the ability to meet the needs of passengers as schools reopen.
Additionally, improvements to on-time performance and mid-trip fueling were discussed and
recommendations for improvement were offered.

Beaumont Transit SRTP 21/22 - 23/24                                                       18 | Page
The COA Mid-Term plan (now through December 2022) recommendations include:
• the elimination of service to Calimesa. It was found that few individuals travel to or
from Calimesa. The Calimesa stop slows down the commuter route whose primary
purpose is to connect to San Bernardino.
• Implementation of a 20% fare increase once the on-time performance is resolved.
• enhance the commuting options to the logistic center that is a major employment
center of the city and includes Amazon Distribution Center.
• integration to the new operations and fleet maintenance facility with the routes to offer
service in the area.
• enhancing connectivity with Banning and RTA transit agencies
• creation and implementation of a Bus Stop Improvement Plan.
The COA Long-Term plan (Jan 2023 – June 2025) gave recommendations for the future
including expanding local service to emerging residential neighborhoods; realignment of routes
to a more centralized transfer station is discussed; transition to an alternative fuel fleet and
infrastructure as an ongoing project. Finally, COA consultants recommend introducing more
technology for passengers to offer predictive arrival features.
CHAPTER 2 - EXISTING SERVICE AND ROUTE PERFORMANCE
Fiscal Year 20 was a challenging year for everyone, including public transportation due to
COVID-19. The year was projected to end with less passenger trips than years prior, however
the pandemic created and continues to create passenger boarding’s significantly less then were
thought possible. Beaumont Transit systemwide passenger trips for FY 20 ended with 106,743
passenger trips. This is lower than the passenger trips that were projected and delivered in FY
19. In FY 19, systemwide passenger trips, including paratransit, totaled 203,660. FY 21 is
projected to end significantly lower at 34,500 passenger trips. An 83% decline from 2019 and a
68% decline from FY 20.
Beaumont Transit SRTP 21/22 - 23/24 19 | PageAnnual Systemwide Passenger Boardings
Systemwide
- 50,000 100,000 150,000 200,000 250,000
2021 Projected 2020 2019 2018 2017
There are two primary reasons to explain why Beaumont Transit is experiencing a decline in
passenger boardings. First, is the pandemic. The stay-at-home order negatively impacted
Beaumont’s operations since passengers were not going to work or school. As the school
district and stores begin to open and the social distancing mandate lifted, we hope to see
Beaumont Transit’s passenger boardings increase. Second, Beaumont eliminated service on the
Route 2 in FY 20. The Route 2 previously connected Beaumont passengers in the low income
and downtown area to social services in Banning; however, this service was eliminated with the
entering of an Interagency Agreement with City of Banning which took effect July 1, 2019.
2.1 Key Performance Indicators
Beaumont Transit monitors performance indicators throughout the year to ensure the system is
performing productively. Customer complaints and suggestions are received, noted, and
implemented where appropriate. Route schedules and timepoints are reviewed for connectivity
with other routes and regional connection opportunities. Department expenses are monitored
for farebox recovery ratio.
In Table 2.0. Key performance indicators are set. There are seven discretionary and one
mandatory indicators. Beaumont Transit meets five of the seven discretionary indicators.
Beaumont Transit continues to struggle with passengers per revenue hour and mile portions of
this report due to low ridership. Covid-19 has had an impact on our operations and passenger
trips. Beaumont Transit fails to meet the one mandatory indicator represented by farebox
recovery. However, California Assembly Bill 90, prohibits penalty on an operator that does not
maintain the required farebox ratio during FY 20 and/or FY 21.
Beaumont Transit SRTP 21/22 - 23/24 20 | PageTable 2.0 -- Service Provider Performance Targets Report
FY 2020/21 Short Range Transit Plan Review
City of Beaumont
FY 2020/21 Year to Date
Data Elements FY 2020/21 Plan FY 2020/21 Target Year to Date Performance
Through 3rd Quarter Scorecard
Unlinked Passenger Trips 169,846
Passenger Miles 1,477,908
Total Actual Vehicle Revenue Hours 26,560.0
Total Actual Vehicle Revenue Miles 567,924.0
Total Actual Vehicle Miles 590,904.0
Total Operating Expenses $2,775,646
Total Passenger Fare Revenue $307,338
Net Operating Expenses $2,468,308
Performance Indicators
Mandatory:
1. Farebox Recovery Ratio 18.90% >= 10.00% 2.15% Fails to Meet Target
Discretionary:
1. Operating Cost Per Revenue Hour $104.50 = $10.05 and = $2.10 and = $62.24 and = $2.92 and = 5.27 and = 0.25 and2.2 SRTP Performance Report In FY 20, when the SRTP was prepared for FY 21, Beaumont set a plan for performance. RCTC in turn set targets for Beaumont to keep in mind as the year of operation. The following Table 2.1 outlines the planned performance indicators for FY 21 and compares the FY 22 plan to the FY 21 targets. Beaumont Transit SRTP 21/22 - 23/24 22 | Page
FY 2021/22 - Table 2.1 -- SRTP Performance Report
                                                                                                                                                        Service Provider: City of Beaumont
                                                                                                                                                                                    All Routes

                                                  FY 2019/20                FY 2020/21
                                                                                                       FY 2021/22                                                     Plan Performance
        Performance Indicators                    End of Year                3rd Quarter                                            FY 2021/22 Target
                                                                                                           Plan                                                         Scorecard (a)
                                                     Actual                 Year-to-Date
 Passengers                                                  108,367                    26,383                     84,316    None

 Passenger Miles                                             517,775                   119,731                   785,168     None

 Revenue Hours                                              18,380.8                  10,205.2                   18,930.0    None

 Total Hours                                                19,852.3                  11,348.1                   21,394.0    None

 Revenue Miles                                             393,041.0                 229,575.0                  359,560.0    None

 Total Miles                                               409,890.0                 239,255.0                  417,064.0    None

 Operating Costs                                          $1,522,741                  $693,892                $2,535,849     None

 Passenger Revenue                                         $136,784                    $14,949                  $168,650     None

 Measure-A Revenue                                                                                                           None

 LCTOP Revenue                                                                                                   $40,465     None

 Operating Subsidy                                        $1,385,957                  $678,943                $2,367,199     None

 Operating Costs Per Revenue Hour                             $82.84                    $67.99                   $133.96     = 0.1                            Fails to Meet Target

 Subsidy Per Passenger                                        $12.79                    $25.73                     $28.08    >= $21.87 and = $4.82 and = $56.55 and = $2.52 and = 2.20 and = 0.09 and
2.3 SRTP Service Summary
The following pages include reports that give an insight on how the Beaumont Transit service is
performing in various areas compared to years past, as well as the plan for the coming fiscal
year.
Table 2.2 Service Summary for City of Beaumont All Routes: Like Table 2.1 above, this table
compares 3rd Quarter actual of FY 21 to the plan of FY 21. In addition, the table also shows
actual audited figures for FY 19 and 20 as well as showing FY 21 compared to FY 22 plan. This
table shows all routes Beaumont operates including Dial-A-Ride and excluded routes. Some key
takeaways from this report are:
• Passenger trips are significantly lower than what was reported for previous FY’s.
• Farebox recovery ratio remains below plan because of the low passenger trips.
• Passenger miles are higher although overall passenger trips are lower because of the
long-distance commuter service and increased amount of service offered.
Beaumont Transit SRTP 21/22 - 23/24 24 | PageTable 2.2 -- City of Beaumont -- SRTP Service Summary
FY 2021/22 Short Range Transit Plan
All Routes
FY 2018/19 FY 2019/20 FY 2020/21 FY 2020/21 FY 2021/22
Audited Audited Plan 3rd Qtr Actual Plan
Fleet Characteristics
Peak-Hour Fleet 9 9 13 4 12
Financial Data
Total Operating Expenses $2,796,318 $1,522,741 $2,775,646 $693,892 $2,535,849
Total Passenger Fare Revenue $240,041 $136,784 $524,684 $14,949 $209,115
Net Operating Expenses (Subsidies) $2,556,276 $1,385,957 $2,468,308 $678,943 $2,367,199
Operating Characteristics
Unlinked Passenger Trips 204,274 108,367 169,846 26,383 84,316
Passenger Miles 976,877 517,775 1,477,908 119,731 785,168
Total Actual Vehicle Revenue Hours (a) 24,456.7 18,380.8 26,560.0 10,205.2 18,930.0
Total Actual Vehicle Revenue Miles (b) 457,808.9 393,041.0 567,924.0 229,575.0 359,560.0
Total Actual Vehicle Miles 483,043.8 409,890.0 590,904.0 239,255.0 417,064.0
Performance Characteristics
Operating Cost per Revenue Hour $114.34 $82.84 $104.50 $67.99 $133.96
Farebox Recovery Ratio 8.58% 8.98% 18.90% 2.15% 8.24%
Subsidy per Passenger $12.51 $12.79 $14.53 $25.73 $28.08
Subsidy per Passenger Mile $2.62 $2.68 $1.67 $5.67 $3.01
Subsidy per Revenue Hour (a) $104.52 $75.40 $92.93 $66.53 $125.05
Subsidy per Revenue Mile (b) $5.58 $3.53 $4.35 $2.96 $6.58
Passenger per Revenue Hour (a) 8.4 5.9 6.4 2.6 4.5
Passenger per Revenue Mile (b) 0.45 0.28 0.30 0.11 0.23
(a) Train Hours for Rail Modes. (b) Car Miles for Rail Modes.
TransTrack Manager™ Page 1 of 1
4/22/2021Table 2.2 is further broken down into Excluded and Non-Excluded Routes. The following two
tables reflect these two categories. In FY 21, Beaumont had 4 excluded routes from the farebox
recovery ratio reporting. These routes were Casino Express, Route 3/4, Commuter Link 120,
and Commuter Link 125. Excluded Routes are new routes or routes that have had a 25%
change in route. Being excluded gives a grace period for the route to perform and gain
passenger ridership for three years. More detail on excluded routes is in Table 2.2A
Table 2.2 Excluded Routes has the following points of interest:
• Excluded Routes have not gained passenger base necessary to reach farebox
recovery plan.
• The new routes are gaining passengers; however, the low passenger counts create
higher operating cost per revenue hour.
Table 2.2 Non-Excluded Routes consists of the remaining routes and services Beaumont offers.
These non-excluded routes are services that have been established and unaltered for at least 3
years. Non-excluded routes include the Route 3, Route 4, Route 7, and Route 9.
Non-excluded reports have the following points of interest:
• Non-excluded routes are doing very well and have a farebox recovery of 17.74%
through the 3rd Quarter FY 20.
• Operating Costs per revenue hour and subsidies are low compared to plan and
previous years.
Beaumont Transit SRTP 21/22 - 23/24 26 | PageTable 2.2 -- City of Beaumont -- SRTP Service Summary
FY 2021/22 Short Range Transit Plan
Excluded Routes
FY 2018/19 FY 2019/20 FY 2020/21 FY 2020/21 FY 2021/22
Audited Audited Plan 3rd Qtr Actual Plan
Fleet Characteristics
Peak-Hour Fleet 2 4 5 2 5
Financial Data
Total Operating Expenses $460,249 $1,110,135 $1,359,487 $513,991 $1,486,755
Total Passenger Fare Revenue $14,420 $44,092 $287,923 $7,546 $71,950
Net Operating Expenses (Subsidies) $445,829 $1,066,044 $1,241,987 $506,444 $1,435,605
Operating Characteristics
Unlinked Passenger Trips 7,344 33,563 52,476 14,400 19,634
Passenger Miles 35,251 161,102 801,695 69,120 429,778
Total Actual Vehicle Revenue Hours (a) 2,849.2 10,461.4 16,116.0 6,538.7 11,809.0
Total Actual Vehicle Revenue Miles (b) 76,021.0 266,476.0 425,086.0 164,300.0 266,082.0
Total Actual Vehicle Miles 77,316.0 272,658.0 434,330.0 169,759.0 312,410.0
Performance Characteristics
Operating Cost per Revenue Hour $161.54 $106.12 $84.36 $78.61 $125.90
Farebox Recovery Ratio 3.13% 3.97% 21.17% 1.47% 4.83%
Subsidy per Passenger $60.71 $31.76 $23.67 $35.17 $73.12
Subsidy per Passenger Mile $12.65 $6.62 $1.55 $7.33 $3.34
Subsidy per Revenue Hour (a) $156.48 $101.90 $77.07 $77.45 $121.57
Subsidy per Revenue Mile (b) $5.86 $4.00 $2.92 $3.08 $5.40
Passenger per Revenue Hour (a) 2.6 3.2 3.3 2.2 1.7
Passenger per Revenue Mile (b) 0.10 0.13 0.12 0.09 0.07
(a) Train Hours for Rail Modes. (b) Car Miles for Rail Modes.
TransTrack Manager™ Page 1 of 1
4/22/2021Table 2.2 -- City of Beaumont -- SRTP Service Summary
FY 2021/22 Short Range Transit Plan
Non-Excluded Routes
FY 2018/19 FY 2019/20 FY 2020/21 FY 2020/21 FY 2021/22
Audited Audited Plan 3rd Qtr Actual Plan
Fleet Characteristics
Peak-Hour Fleet 8 7 8 3 7
Financial Data
Total Operating Expenses $2,336,069 $412,606 $1,416,159 $179,901 $1,049,094
Total Passenger Fare Revenue $225,621 $92,693 $236,761 $7,402 $137,165
Net Operating Expenses (Subsidies) $2,110,448 $319,913 $1,226,321 $172,499 $931,594
Operating Characteristics
Unlinked Passenger Trips 196,930 74,804 117,370 11,983 64,682
Passenger Miles 941,626 356,673 676,213 50,611 355,390
Total Actual Vehicle Revenue Hours (a) 21,607.6 7,919.3 10,444.0 3,666.5 7,121.0
Total Actual Vehicle Revenue Miles (b) 381,787.9 126,565.0 142,838.0 65,275.0 93,478.0
Total Actual Vehicle Miles 405,727.8 137,232.0 156,574.0 69,496.0 104,654.0
Performance Characteristics
Operating Cost per Revenue Hour $108.11 $52.10 $135.60 $49.07 $147.32
Farebox Recovery Ratio 9.66% 22.47% 16.71% 4.11% 13.07%
Subsidy per Passenger $10.72 $4.28 $10.45 $14.40 $14.40
Subsidy per Passenger Mile $2.24 $0.90 $1.81 $3.41 $2.62
Subsidy per Revenue Hour (a) $97.67 $40.40 $117.42 $47.05 $130.82
Subsidy per Revenue Mile (b) $5.53 $2.53 $8.59 $2.64 $9.97
Passenger per Revenue Hour (a) 9.1 9.5 11.2 3.3 9.1
Passenger per Revenue Mile (b) 0.52 0.59 0.82 0.18 0.69
(a) Train Hours for Rail Modes. (b) Car Miles for Rail Modes.
TransTrack Manager™ Page 1 of 1
4/22/2021The City of Beaumont service is further broken down in Tables 2.2 by dividing up the service
into programs. Beaumont Transit has two programs. One program is the BUS program which is
all fixed route and commuter link services. The second program is the DAR program which is
our Dial-A-Ride or paratransit program.
Table 2.2 BUS shows all routes within this program. Key notes of interest:
• Passenger Trips on the fixed and commuter links are significantly lower than previous
years.
• Low passenger trips directly affect the amounts listed in the subsidies.
• Operating cost per revenue hour is low compared to plan and audited actuals of years
past which means Beaumont consciously attempts to lower operating costs to a level to
balance farebox ratio where possible.
Table 2.2 DAR shows the Dial A Ride or paratransit program. Key notes of interest:
• Paratransit service is a very expensive service to offer; however, it is a required service.
• Passenger trips are lower but the cost to operate the service is significantly higher than
previous years.
Beaumont Transit SRTP 21/22 - 23/24 29 | PageTable 2.2 -- Beaumont-BUS -- SRTP Service Summary
FY 2021/22 Short Range Transit Plan
All Routes
FY 2018/19 FY 2019/20 FY 2020/21 FY 2020/21 FY 2021/22
Audited Audited Plan 3rd Qtr Actual Plan
Fleet Characteristics
Peak-Hour Fleet 8 8 11 4 11
Financial Data
Total Operating Expenses $2,528,180 $1,334,203 $2,471,923 $583,021 $2,318,526
Total Passenger Fare Revenue $236,763 $116,125 $500,684 $11,486 $189,115
Net Operating Expenses (Subsidies) $2,291,416 $1,218,078 $2,188,585 $571,535 $2,169,876
Operating Characteristics
Unlinked Passenger Trips 195,400 102,547 160,782 24,944 82,486
Passenger Miles 937,920 492,226 1,429,869 119,731 777,299
Total Actual Vehicle Revenue Hours (a) 21,785.4 16,571.9 23,844.0 9,751.2 18,295.0
Total Actual Vehicle Revenue Miles (b) 424,129.0 369,493.0 532,748.0 219,507.0 346,810.0
Total Actual Vehicle Miles 445,928.3 383,827.0 552,664.0 227,562.0 402,230.0
Performance Characteristics
Operating Cost per Revenue Hour $116.05 $80.51 $103.67 $59.79 $126.73
Farebox Recovery Ratio 9.36% 8.70% 20.25% 1.97% 8.15%
Subsidy per Passenger $11.73 $11.88 $13.61 $22.91 $26.31
Subsidy per Passenger Mile $2.44 $2.47 $1.53 $4.77 $2.79
Subsidy per Revenue Hour (a) $105.18 $73.50 $91.79 $58.61 $118.60
Subsidy per Revenue Mile (b) $5.40 $3.30 $4.11 $2.60 $6.26
Passenger per Revenue Hour (a) 9.0 6.2 6.7 2.6 4.5
Passenger per Revenue Mile (b) 0.46 0.28 0.30 0.11 0.24
(a) Train Hours for Rail Modes. (b) Car Miles for Rail Modes.
TransTrack Manager™ Page 1 of 1
4/22/2021Table 2.2 -- Beaumont-DAR -- SRTP Service Summary
FY 2021/22 Short Range Transit Plan
All Routes
FY 2018/19 FY 2019/20 FY 2020/21 FY 2020/21 FY 2021/22
Audited Audited Plan 3rd Qtr Actual Plan
Fleet Characteristics
Peak-Hour Fleet 1 1 2 1 1
Financial Data
Total Operating Expenses $268,138 $188,538 $303,723 $110,871 $217,323
Total Passenger Fare Revenue $3,278 $20,659 $24,000 $3,463 $20,000
Net Operating Expenses (Subsidies) $264,860 $167,879 $279,723 $107,408 $197,323
Operating Characteristics
Unlinked Passenger Trips 8,874 5,820 9,064 1,439 1,830
Passenger Miles 38,957 25,550 48,039 7,869
Total Actual Vehicle Revenue Hours (a) 2,671.3 1,808.9 2,716.0 454.0 635.0
Total Actual Vehicle Revenue Miles (b) 33,679.9 23,548.0 35,176.0 10,068.0 12,750.0
Total Actual Vehicle Miles 37,115.5 26,063.0 38,240.0 11,693.0 14,834.0
Performance Characteristics
Operating Cost per Revenue Hour $100.38 $104.23 $111.83 $244.20 $342.24
Farebox Recovery Ratio 1.22% 10.96% 7.90% 3.12% 9.20%
Subsidy per Passenger $29.85 $28.85 $30.86 $74.64 $107.83
Subsidy per Passenger Mile $6.80 $6.57 $5.82 $25.08
Subsidy per Revenue Hour (a) $99.15 $92.81 $102.99 $236.57 $310.74
Subsidy per Revenue Mile (b) $7.86 $7.13 $7.95 $10.67 $15.48
Passenger per Revenue Hour (a) 3.3 3.2 3.3 3.2 2.9
Passenger per Revenue Mile (b) 0.26 0.25 0.26 0.14 0.14
(a) Train Hours for Rail Modes. (b) Car Miles for Rail Modes.
TransTrack Manager™ Page 1 of 1
4/22/2021Beaumont Transit
Short Range Transit Plan
FY 2021/2022 - 2023/2024
Table 2.2A Excluded Routes
Excluded routes are new routes or new service extensions that are eligible for exemptions from the farebox recovery requirements
Service
Mode Type Date of Exemption
Route # (FR/DAR) (DO/CO) Route Description Implementation End Date
Saturday Service: Walmart to Cherry Valley
Route 3/4 FR DO via Downtown August 2019 August 2022
Monday - Saturday Service: Walmart to
Route 120 FR DO San Bernardino Transit Center August 2019 August 2022
Monday - Friday: Downtown to Walmart
with Express Service to Casino Morongo
Casino Express FR DO and Outlet Malls August 2020 August 2023
Monday - Friday Service: Walmart to Loma
Route 125 FR DO Linda Veterans Hospital October 2020 October 2023You can also read