City-wide Concept Plan for Erode - Government of India - Erode City Municipal Corporation
←
→
Page content transcription
If your browser does not render page correctly, please read the page content below
Government of India                            Smart Cities Mission
Ministry of Urban Development                   Smart cities challenge

                          Smart Cities Challenge
         City-wide Concept Plan for Erode
                                October2015

Erode Municipal Corporation                   Government of Tamil Nadu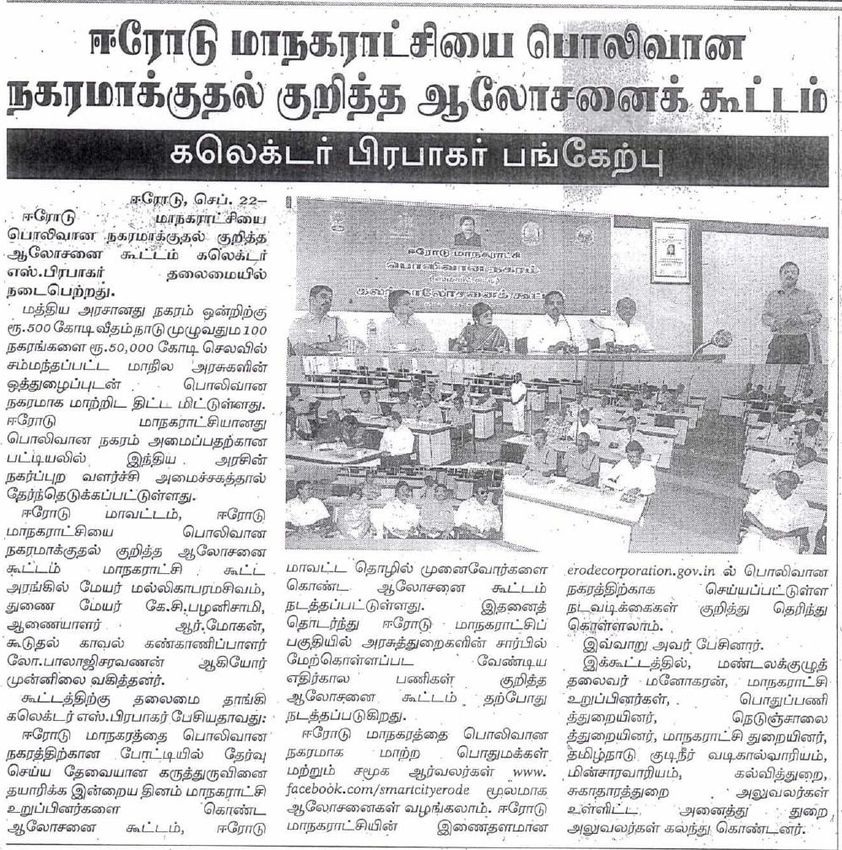
Contents
1. INTRODUCTION ....................................................................................................................................... 1
1.1. SMART CITIES MISSION ............................................................................................................................... 1
1.2. APPROACH TO SMART CITIES CHALLENGE - STAGE 2 ......................................................................................... 1
1.3. APPROACH FOR PREPARATION OF CITY-WIDE CONCEPT PLAN.............................................................................. 2
1.4. SCOPE AND CONTENTS OF THIS DOCUMENT ..................................................................................................... 4
2. CITY BACKGROUND ................................................................................................................................. 5
2.1. CITY OVERVIEW.......................................................................................................................................... 5
2.2. INSTITUTIONAL FRAMEWORK ........................................................................................................................ 6
2.3. LAND-USE ................................................................................................................................................. 9
2.4. DEMOGRAPHICS....................................................................................................................................... 10
2.5. ECONOMIC BASE AND GROWTH DRIVERS ....................................................................................................... 11
3. BASELINE ASSESSMENT ......................................................................................................................... 13
3.1. WATER, SANITATION, ENERGY AND ENVIRONMENT ........................................................................................ 13
3.2. MOBILITY AND OPEN SPACES ...................................................................................................................... 19
3.3. HOUSING, INCLUSION AND SECURITY ........................................................................................................... 23
3.4. E-GOVERNANCE AND CITIZEN ENGAGEMENT ................................................................................................. 25
3.5. SELF-ASSESSMENT SUMMARY ..................................................................................................................... 27
4. CITIZEN ENGAGEMENT .......................................................................................................................... 30
4.1. FACE-TO-FACE MEETINGS .......................................................................................................................... 31
4.2. SOCIAL MEDIA......................................................................................................................................... 32
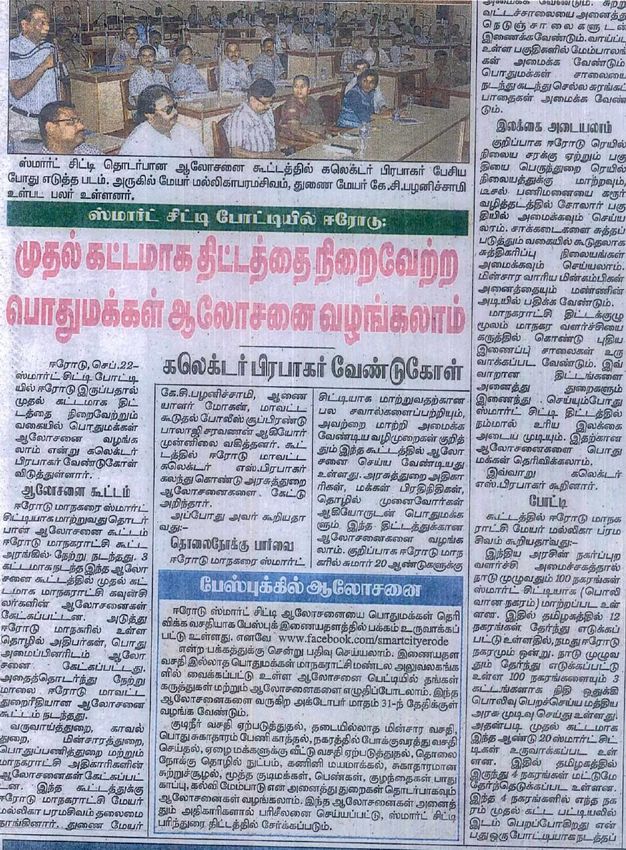
4.3. COVERAGE IN PRINT, RADIO AND TELEVISION ................................................................................................ 32
4.4. CONTESTS AND POLLS ............................................................................................................................... 33
5. CITY VISION, GOALS AND STRATEGIC PLAN ........................................................................................... 34
5.1. APPROACH TO VISION FORMULATION........................................................................................................... 34
5.2. VISION FOR ERODE ................................................................................................................................... 39
5.3. PRIORITY GOALS AND STRATEGIES ............................................................................................................... 40
6. COMPONENTS OF SMART CITY PROPOSAL ............................................................................................ 42
6.1. PAN CITY INITIATIVE – GUIDELINES UNDER SMART CITIES MISSION .................................................................... 42
6.2. PAN-CITY INITIATIVE - INITIAL IDEAS ............................................................................................................. 43
6.3. AREA DEVELOPMENT PLAN ......................................................................................................................... 45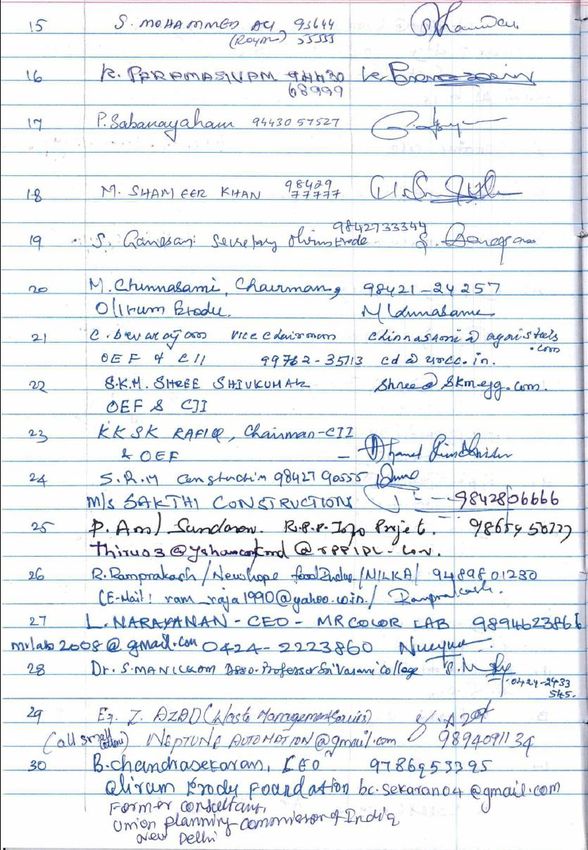
Exhibits
Exhibit 1.1Approach to Smart Cities Challenge – Stage 2 ....................................................................... 1
Exhibit 1.2 Approach to Smart Cities Challenge – Stage 2 ...................................................................... 3
Exhibit 1.3City Baseline: Framework for Self-Assessment...................................................................... 3
Exhibit 2.1ECMC – Erode District, City Map, Old Corporation and added areas .................................... 5
Exhibit 2.2 ECMC - Areas added during expansion ................................................................................. 6
Exhibit 2.3ECMC – spatial representation and ward level breakup ....................................................... 6
Exhibit 2.4ECMC- Zones .......................................................................................................................... 7
Exhibit 2.5Agencies involved in policy, planning and provision of services in Erode ............................. 7
Exhibit 2.6Revised Master Plan Details- Erode LPA .............................................................................. 10
Exhibit 2.7Land-Use of Erstwhile Erode City- 2002 Vs. 2021 ................................................................ 10
Exhibit 2.8ECMC - Population details.................................................................................................... 10
Exhibit 2.9ECMC - Population Projection .............................................................................................. 11
Exhibit 3.1 Water Supply Gap Analysis: Prevailing Infrastructure/Services vs. Demand...................... 13
Exhibit 3.2 Water Supply: Service levels Vs. Benchmarks..................................................................... 13
Exhibit 3.3 Sewerage Gap Analysis: Prevailing Infrastructure/Services vs. Demand............................ 15
Exhibit 3.4 Sewerage: Service levels Vs Benchmarks ............................................................................ 15
Exhibit 3.5 MSW Gap Analysis: Prevailing Infrastructure/Services vs. Demand ................................... 16
Exhibit 3.6 MSW: Service levels Vs. Benchmarks .................................................................................. 16
Exhibit 3.7 Drain network and service levels ........................................................................................ 17
Exhibit 3.8Storm Drains: Service levels ................................................................................................. 17
Exhibit 3.9Streetlights- infrastructure .................................................................................................. 18
Exhibit 3.10Streetlights- Demand and Gap........................................................................................... 18
Exhibit 3.11 Arterial Road network in Erode ........................................................................................ 19
Exhibit 3.12Parks in ECMC .................................................................................................................... 22
Exhibit 3.13 Slums in Erode ................................................................................................................... 23
Exhibit 3.14 Education Facilities in Erode ............................................................................................. 23
Exhibit 3.15 Education Facilities in Erode- Demand and Gap ............................................................... 24
Exhibit 3.16 Health Infrastructure in Erode City ................................................................................... 24
Exhibit 3.17 Health Infrastructure in Erode City ................................................................................... 24
Exhibit 4.1SCP formulation - Consultation stages................................................................................. 30
Exhibit 4.2 Round 1 Consultations: Stakeholder groups covered ......................................................... 31
Exhibit 4.3 Round 1 Consultations: Initial list of Face-to-face meetings .............................................. 31
Exhibit 4.4 Snapshot of Social Media Platforms ................................................................................... 32
Exhibit 4.5 Press Meet .......................................................................................................................... 32
Exhibit 5.1 Themes underlying Erode’s vision ...................................................................................... 39
Exhibit 6.1 Illustrative Smart City solutions .......................................................................................... 42
Exhibit 6.2 Area Development options: Pros and cons ......................................................................... 46
1. Introduction
1.1. Smart Cities Mission
The Smart Cities Mission is a Centrally Sponsored Program of Government of India (GoI) under the
Ministry of Urban Development (MOUD). Under this Mission, GoI envisaged support 100 cities with an
outlay of Rs. 50,000 crore with a matching grant from State Governments/Urban Local Bodies. Its
duration will be five years from 2015-16 to 2019-20. The support under the Smart Cities Mission is
envisaged through a Smart Cities Challenge under two stages: Stage 1 (Shortlisting of cities by
States) has completed, following which 12 cities from Tamil Nadu have been selected. In the Stage 2
Challenge(the Challenge round for selection), the shortlisted cities from all States have to submit a
Smart City Proposal (SCP) to compete with each other at the National level. 20 cities that fare best in
this competition would be selected for funding during 2015-16. The other cities will get a chance to
improve their proposals and be eligible to participate in challenge round during the next financial year.
In Tamil Nadu, the Tamil Nadu Urban Infrastructure Finance Development Corporation (TUFIDCO) is
the nodal agency of the Government of Tamil Nadu (GoTN) steering the Smart Cities Mission.
Following the first stage challenge, twelve cities have been shortlisted in Tamil Nadu under the Smart
Cities Mission. Erode is one of the cities selected from Tamil Nadu following the Stage I challenge. As
its Local Government and Urban Local Body, the Erode City Municipal Corporation (ECMC) is
steering the task of preparing the Smart City Proposal.
This document covers the City-Wide Concept Plan and details the approach, findings from baseline
assessment and articulates the City Vision, Goals and Strategy.
1.2. Approach to Smart Cities Challenge - Stage 2
Exhibit 1.1 below provides a snapshot of the steps followed by ECMC towards participation in the
Smart Cities challenge, in accordance with the Smart Cities Mission guidelines issued by MOUD.
Exhibit 1.1Approach to Smart Cities Challenge – Stage 2
Step 2 Generate Options
Step 1 Prepare City-wide Step 3 Finalize / Submit
for Pan City initiative(s)
Concept Plan Smart City Proposal
and Area based proposal
City Baseline Assessment Round II Consultations Local Body approvals
Round I Consultations • Options for Pan-city State Review and Approvals
• Face-to-Face interactions • Ideas for Area- Finalise Smart City Proposal
• Use of Social Media / MyGov Development Proposal Round III Consultations for
• Contests and Polls • Prioritization dissemination
Smart City Concept Plan • Implementation framework
• City Vision, Goals, Strategy • Fit with MOUD guidelines
15 Sep 15 15 Oct 15 15 Nov 15 30 Nov 15
Start date City-wide Concept Plan Draft SCP Final SCP
1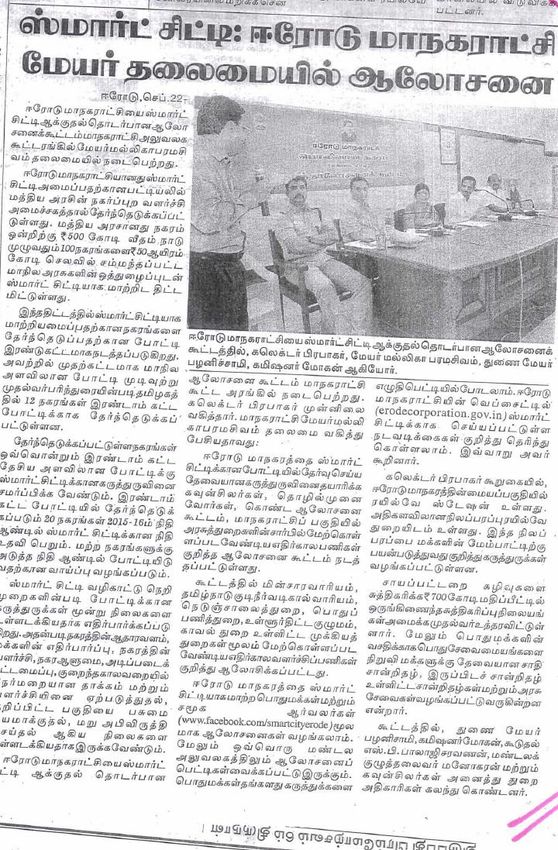
In line with the Smart City guidelines, ECMC‟s process for preparing the Smart City Proposal covers
preparation and submission of the following deliverables:

1. A Smart City Concept Plan that captures the City‟s Vision, Goals and Strategy based on a
   baseline assessment and as appropriate to its local context, resources and level of ambition.

2. A Smart City Proposal that would cover

    a.   A Pan City proposal that articulates specific city wide initiatives in the areas of city
         governance, infrastructure and services through deployment of smart solutions that help
         create positive impact and improvements in a relatively short time frame and
    b.   An Area based proposal that incorporates identifies an area within the city as an
         appropriate site for one of the three typologies of development namely greenfield, re-
         development or retrofitting.

The Smart City Proposal will also cover the implementation framework and financing plan.

Consultations form a critical aspect of the Smart Cities Challenge.

ECMC has initiated a comprehensive Stakeholder Engagement plan in September 2015. ECMC‟s
consultations seek to involve all stakeholder groups including Elected Representatives, Citizens &
Civil Society, Trade & Industry and City Administration through a combination of Face-to-Face
interactions, Social media & Internet and traditional media covering Print, Television and Radio.
Contests and Polls to generate wider enthusiasm and participation have also been planned as part of
the consultative process for this exercise.

The Consultations are being organised under three rounds:

Round 1 Consultations have focused on engaging citizens and stakeholder to crystallise the City
Vision, Goals and Strategy towards finalising the City-wide Concept Plan and to draw initial views on
area development proposals and pan city initiatives.

Round 2 Consultations would focus on engaging citizens and stakeholders on possible options for
Area Development proposals and pan-city initiatives and to enable crystallising the priority initiatives
that need to be incorporated as part of ECMC‟s Smart City Proposal

Round 3 Dissemination would use various media and social media platforms to disseminate among
stakeholders the initiatives reflected in ECMC‟s Smart City Proposal.

Scope and inputs from Round I consultations are detailed under Chapter 4 Citizen Engagement.

1.3. Approach for preparation of City-wide Concept Plan
The first deliverable in the Stage 2 of the Smart Cities Challenge is the City wide Concept Plan which
encompasses finalisation of the City Vision, Goals and Strategy.

Exhibit 1.2 captures the approach for preparation of the City-wide concept plan which essentially
involved three steps as described below:

1. Baseline assessment: The baseline assessment covered a situation analysis and a review of
   previous plans including the recently prepared City Development Plan and City Mobility Plan of
   ECMC. The assessment also covered review of prevailing service levels and a gap analysis vis-à-
   vis benchmark norms. It also covered a comprehensive self-assessment on the 24 parameters
   (and grouped under four thematic areas as shown in Exhibit 1.3) identified under the Smart City
   guidelines.

                                                                                                      2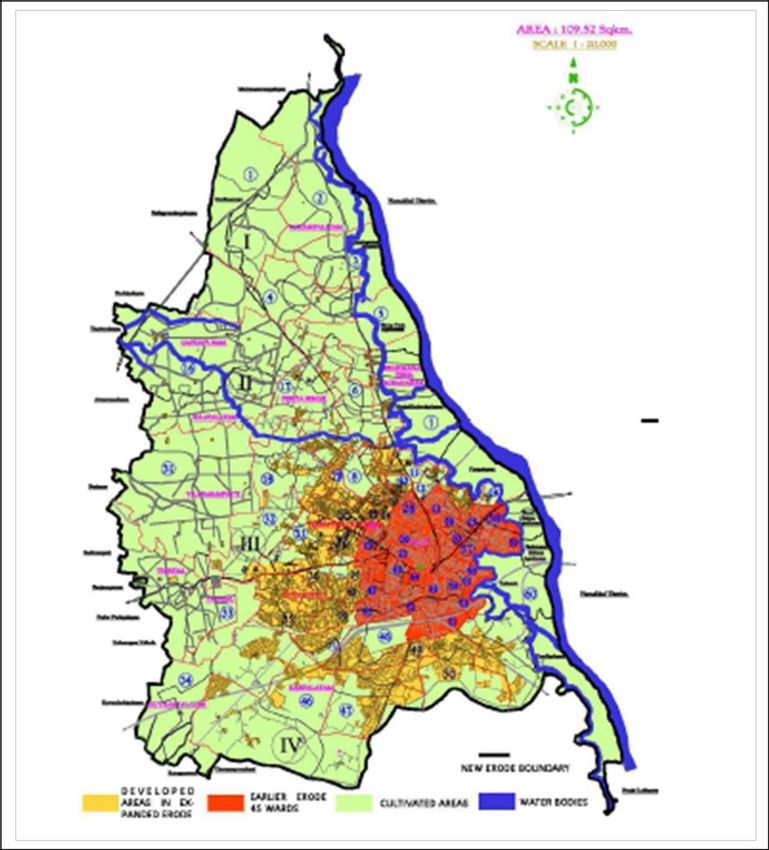
Exhibit 1.2 Approach to Smart Cities Challenge – Stage 2
Baseline assessment and
Consultations - Round I
mapping
• Earlier studies and city maps • Face-to-Face, Social Media/My Gov
• Ongoing / proposed initiatives / plans • Dissemination on Media / Website
• Service levels / assessment indicators • MOUD guidelines
Formulate City Vision, Goals &
Strategies
• Review Vision and Goals under earlier initiatives
• Validate Vision themes and Priority Goals from Consultations
Crystallise Vision Statement, Values, Goals and Strategies
Exhibit 1.3City Baseline: Framework for Self-Assessment
Structure, Economy, Mobility Watsan, Energy and Environment
• City Identity and culture • Water Supply / Water Management
• Economy and Employment • Waste-water Management
• Mixed Use • Waste management
• Compactness • Sanitation
• Walkability • Energy Supply / Source / Efficiency
• Transport • Underground wiring
• Open Spaces • Air Quality
Inclusion, Housing and Security Smart Solutions & IT-led delivery
• Housing and Inclusiveness • Citizen participation
• Education • IT connectivity
• Health • Intelligent Govt. Services
• Safety and Security
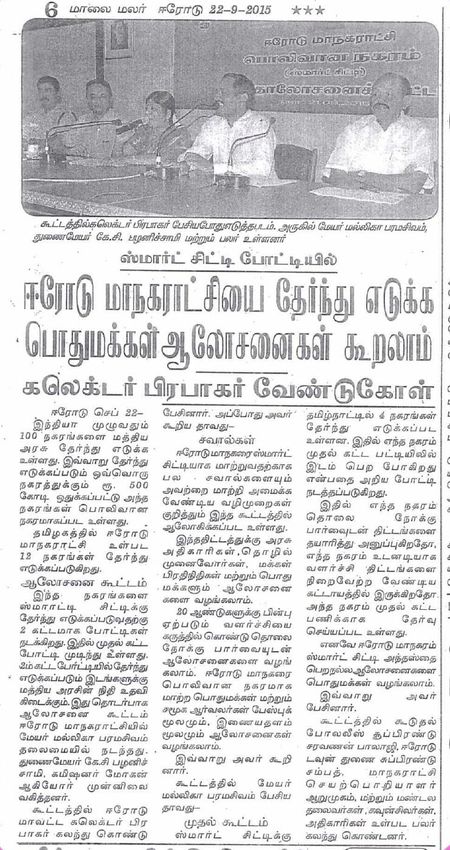
2. Round I Consultations: ECMC undertook a comprehensive range of consultations covering
face-to-face consultations, written submissions, print, radio & TV, online crowd sourcing of ideas
and polling (through internet and mobile). The consultations covered the entire spectrum of
stakeholders including Elected Representatives, City Administration (including line departments of
GoTN), Public Stakeholders and representatives from Trade & Industry. Round I consultations are
expected to be concluded this week and has elicited very positive and wide response from all
sections of society and was well supported by large partner organisations including the
Confederation of Indian Industry (CII), Olirum Erode, Lion‟s Club etc and Educational Institutions
in the city.
a. Face-to-face Meetings involved direct interactions with over 1000 participants and included
meetings with (i) Elected Council, (ii) Zonal town-halls (which elicited participation from over
3
500 members), (iii) Meeting with District Collector and Line Departments (attended by over
200 members) and (iv) Members of the Press/Media.
b. Written submissions from citizens and local associations/agencies through ECMC zonal
offices and suggestion boxes at prominent locations in the city
c. Crowd sourcing through Face book, Twitter and MyGov.in
d. City Pulse polls both online and offline (including in local language)
e. Essay and Vision contests in Educational Institutions
f. Dissemination of updates and information on Smart Cities Challenge on social media
platforms, ECMC‟s website, My Gov page and Print/TV media.
3. Review by GoTN and ECMC and finalisation of City-wide concept plan: This City-wide
Concept Plan document reflects the City Vision, Priority Goals and Strategies, emerging from the
review of the city baseline and aspirations and ideas reflected in stakeholder views emerging from
Round I consultation. The findings were presented to ECMC and GoTN during a review
conducted on 9 October 2015 and the feedback from this review has been duly incorporated in
this document.
1.4. Scope and contents of this document
This document covers the City-wide Concept Plan for Erode city and is organised along the following
sections:
Section 1 Introduction (this section) covers the background to this exercise and details the
approach adopted by ECMC in preparing this City-wide concept plan
Section 2 City Background provides an overview of Erode, discusses its institutional
framework, economic base/growth drivers and its demographic profile.
Section 3 City Baseline Assessment presents findings from a review of prevailing service
levels and a gap analysis vis-à-vis benchmark norms across various services. It also reports key
performance indicators and provides a self-assessment on 24 parameters identified under the
GoI‟s Smart Cities guidelines provided post the regional workshops conducted by MOUD.
Section 4 Citizen Engagement details the methodology, level of engagement and findings from
Round I consultations undertaken by ECMC.
Section 5 City Vision, Goals and Strategic Plan articulates the Vision statement for Erode and
identifies the priority goals and strategies for the City.
Section 6 Components of Smart City Proposal discusses the approach, initial views and
options being considered for the Smart City Proposal for Erode.
4
2.      City background
2.1. City overview
2.1.1. Regional Setting
Erode city, located in the western part of Tamil Nadu, is the district headquarters of Erode district. The
city extends over an area of 110 sq. km and lies between River Cauvery on the east and NH 47 on
the west. (Refer Exhibit 2.1). At Census 2011, Erode had a population of 4.98 lakh. The city is
referred to as the „Loom city‟ or „Tex-Valley‟ for its handloom, power-loom textiles and ready-made
garments industry.Erode Municipal Corporation (ECMC) is the ULB under which urban services of
Erode are managed. Erode was managed under a municipality since 1871. It was elevated by GoTN
as a Special Grade municipality in 1980 and subsequently as a Municipal Corporation in 2001.

         Exhibit 2.1ECMC – Erode District, City Map, Old Corporation and added areas

        Source: ECMC, ECMC CDP

                                                                                                        5
2.1.2. Location and Connectivity
The city is located at 400 kilometres (km) from Chennai, the State Capital and 80 km from
Coimbatore. It is well connected by road and rail, with the closest airport located at Coimbatore.
Road: The North-South National Highway Corridor with the NH 47 (connecting Salem,
Coimbatore, Cochin and Kanyakumari) and NH209 (connecting Bangalore to Coimbatore)
traverses Erode. State highways connect Erode City to other urban centres in district and state.
Rail: The city lies on the broad gauge rail route connecting Chennai and Coimbatore. Erode
forms a nodal centre for adjoining districts of Salem, Coimbatore, Trichy and Nammakal.
2.2. Institutional framework
2.2.1. Erode Municipal Corporation
Erode was constituted as a Municipality in the year 1871 and was elevated to Special Grade during
the year 1980 and upgraded as a Municipal Corporation by merging Four (4) grade III municipalities
Two (2) Town Panchayat and Five (5) village panchayats. In 2011, the area of the Corporation was
increased from 8.44 sq. km to 109.52 sq.km. ECMC is divided into 4 zones and 60 wards for
administrative purpose. Refer Exhibit 2.2 for a list of areas that were added to ECMC.
Exhibit 2.2 ECMC - Areas added during expansion
No of
Category Names of ULBs
ULBs
Municipalities 4 Kasipalayam, Surampatti, VeerappanChathiram, PeriyaSemur
Town Panchayats 2 B.P.Agraharam and Suriyampalayam
Thindal, Gangapuram, Ellapalayam, Villarasampatti,
Village Panchayats 5
Muthampalayam
Source: ECMC
ECMC‟s 60 wards are organised in four administrative Zones, each having 15 wards. Refer Exhibit
2.3 and Exhibit 2.4 for the details on administrative units.
Exhibit 2.3ECMC – spatial representation and ward level breakup
Source: ECMC
6
Exhibit 2.4ECMC- Zones
Zone Area
Zone Zone Name (Ward nos.)
(Sq.km)
I VeerapanChathram (1 to 15) 33.41
II Periyasemur (16 to 30) 23.34
III Surampatti (31 to 45) 27.04
IV Kasipalayam (46 to 60) 25.54
Source: ECMC
2.2.2. Departments and Agencies of Government of Tamil Nadu
There are a number of agencies involved in the policy formulation and delivery of services other than
the Municipal Corporation. Refer Exhibit 2.5 for a list of departments and agencies engaged in
provisioning of core urban services of Erode.
Exhibit 2.5Agencies involved in policy, planning and provision of services in Erode
MAWS HUDD Transport PWD Highways Police Electricity
DMA TNHB TNSTC Traffic TNEB
Police
TWAD TNSCB
DTCP
Source: ECMC, GOTN, IMaCS analysis. Key: DMA= Directorate of Municipal Administration, TWAD= Tamil Nadu Water Supply
and Drainage Board, TNHB=Tamil Nadu Housing Board, TNSCB=Tamil Nadu Slum Clearance Board, DTCP=Department of
Town and Country Planning, TNSTC= Tamil Nadu State Transport Corporation, PWD- Public Works Department, TNEB- Tamil
Nadu Electricity Board
The key departments of GoTN involved in policy formulation and delivery of urban services include
the following:
The Municipal Administration and Water Supply department (MAWS) is the nodal
department responsible for Municipal Administration and Water Supply. The Erode Corporation
function under the Directorate of Municipal Administration (DMA).
The Housing and Urban Development department (HUDD) is the nodal department
responsible for urban planning and housing. The Department of Town and Country Planning,
under the HUDD is responsible for master planning in urban areas other than ChMA.
The Highways and Ports department (DoH) is responsible for formulating polices laws,
regulations and various programs to improve roads, highways and bridges for land transport and
ports for sea transport.
The Transport department is the nodal department for public transport. The bus transport
undertakings of Erode come under the Tamil Nadu State Transport Corporation (TNSTC). It is
also the Nodal Agency of the State Government in respect of projects implemented by the
Southern Railway and the Civil Aviation of the Government of India.
7 The Public Works department (PWD) formed in 1858 is in charge of public sector works in the
State of Tamil Nadu. The department functioned under the control of Secretary to GoTN and
deals with policy making on all matters concerning the Building organizations and Water
Resources Organization. It is entrusted with the construction and maintenance of buildings for
most of government departments and public undertakings, and the construction of bridges, roads
and infrastructure.
The Department of Environment (DoE) is the nodal department responsible for planning,
promotion, coordination and overseeing implementation aspects relating to Environment, other
than those dealt with by TNPCB.
Other than these the following are also involved in provision of critical services to ECMC.
Erode Traffic Police, a division of the Tamil Nadu Police, is the law enforcement agency in
Erode Corporation which is headed by Commissioner of Police and administrative control vests
with the Tamil Nadu Home Ministry.
Department of Energy (Tamil Nadu) is one of the Governments of Tamil Nadu dealing with the
energy problems in the State. There are separate undertakings & Bodies for electricity
generation& distribution and transmissions such as TNEB Limited, Tamil Nadu Generation and
Distribution Corporation Limited and Tamil Nadu Transmission Corporation Limited.
Education: Department of School Education (Tamil Nadu) is one of the Governments of
Tamil Nadu which formulates policies, laws, regulations and various programs based on the
needs of the society in the field of School education in Tamil Nadu. The levels of schooling taken
care by them are elementary, Middle, Secondary and Higher Secondary in the State of Tamil
Nadu.
Department of Higher Education (Tamil Nadu) formulates policies, laws, regulations and
various programs based on the needs of the society in the field of Higher education in Tamil
Nadu.
Department of Health and Family Welfare (Tamil Nadu) is one of the Government
Departments of Tamil Nadu which formulates policies, laws, regulations and various programs
for the family welfare and health of the society of State of Tamil Nadu.
The key GoTN agencies that are vested with responsibilities for managing service delivery in Erode
city include the following:
Directorate of Town and Country Planning (DTCP) formed under HUDD is the nodal planning
agency for the areas other than Chennai Metropolitan area. DTCP is responsible for all planning
work including preparation of Master Plans, Detailed Development Plans, Land use maps and
related reports.
Tamil Nadu Water Supply and Drainage (TWAD) Board formed under MAWS is the main
implementing agency for all water supply and sewerage schemes outside the Chennai
metropolitan area.
The Tamil Nadu Housing Board (TNHB) formed under the HUDD is the nodal institution
mandated with provision of plots and ready-built houses.
8 The Tamil Nadu Slum Clearance Board (TNSCB) formed under the Tamil Nadu Slum Areas
(improvement & clearance) Act 1957 is mandated with eradication of slums through provision of
housing, infrastructure and livelihood programs in slum areas.
The Tamil Nadu Pollution Control Board (TNPCB) is the nodal agency for monitoring and
control of air, noise and water pollution in the State of Tamil Nadu.
The Tamil Nadu Urban Finance and Infrastructure Development Corporation (TUFIDCO) and Tamil
Nadu Urban Infrastructure Financial Services Limited (TNUIFSL) are nodal financial institutions that
play a role with respect to financing of urban infrastructure in Tamil Nadu.
The Tamil Nadu Urban Finance and Infrastructure Development Corporation (TUFIDCO) is
designated the State-level Nodal Agency (SLNA) for centrally sponsored urban infrastructure
development schemes of Smart Cities, AMRUT and IDSMT. TUFIDCO also extends financial
assistance to the ULBs from its own sources for various infrastructure developments.
The Tamil Nadu Urban Infrastructure Financial Services Limited (TNUIFSL) is a Public-
Private Partnership in urban section promoted by GoTN and set up with the aim to manage
various funds, including the Tamil Nadu Urban Development Fund (TNUDF).
A number of departments and agencies of GoI also play an important role in provision of critical
transport services to Erode city, connecting Erode with rest of the country.
Southern Railways headquartered in Chennai is the earliest of the 17 zones of the Indian
Railways. It covers the States of Tamil Nadu, Kerala, Puducherry and small portions of Andhra
Pradesh, Telangana and Karnataka. This zone of Indian Railways derives its revenue from the
passengers and not from freight. The Erode stations come under the jurisdiction of Southern
Railways
National Highway Authority of India (NHAI) is an autonomous agency responsible for the
development, maintenance, management and operation of National Highways. It is the nodal
agency of Ministry of Road Transport and Highways.
2.3. Land-use
Preparation of Master Plans in Tamil Nadu is handled under the Department of Town and Country
Planning (DTCP) which operates under the Housing and Urban Development Department (HUDD) of
GoTN. Earlier, Erode Local Planning Authority (LPA) was a composite LPA of an area of 80.07 sq.km.
and covered the erstwhile ECMC limit and a few other municipalities under its purview and the
previous Master Plan was prepared for this composite LPA. In addition to the Master Plan, 58
Detailed Development Plans were also prepared for select regions within this area.
However, with addition of extended areas in 2011, ECMC‟s area went up from 8.44 sq. km. to 109.52
sq. km. Parts of ECMC (Gengapuram, Suriyampalam etc.) thus extended beyond the boundaries of
the erstwhile Erode LPA into the Chithode New Town Development Authority limit. This situation was
corrected in June 2013 vide G.O.(Ms).No.148 HUDD [UD 4(2)], under which the LPA area was
expanded to include the entire area under ECMC, villages under Perundurai, area under the erstwhile
Chithode New Town Development Authority and 26 villages from Non-Plan area. Refer Exhibit 2.6.
9Exhibit 2.6Revised Master Plan Details- Erode LPA
Name of the Proposed Total area to be covered
Sl Existing extent of
composite local additional area under the project
no. planning area (sq.km)
planning area (Sq.km) (Sq.km)
Erode LPA 80
Chithode NTDA 25.4
1 Erode Perunthurai NTDA 425 201 731
------------------------------------
Total 530.4
Source: G.O (Ms.).No.23. Housing and Urban Development Department. GoTN
Exhibit 2.7 shows the land use breakup of erstwhile Erode Corporation area and Erode Local
Planning Area. Out of the total extent of 8.44 sq.km of erstwhile Erode Municipal Area, 86.85% of the
land has been developed and only 11.15% remains undeveloped, while remaining 2% of area is
under water bodies and hence non-developable. Within Erode Local Planning Area (80.07 sq.km.),
developed lands constitute around 26.5% of the total area. Around 7% of the said area is covered by
water bodies, while around 67% of Erode Local Planning Area is undeveloped.
Exhibit 2.7Land-Use of Erstwhile Erode City- 2002 Vs. 2021
Existing In 2002 Proposed For 2021
Sl. No Land Use Category
Area (Ha.) % To Total Area (Ha.) % To Total
1 Residential 483 57% 1,499 19%
2 Commercial 133 16% 166 2%
3 Industrial 60 7% 292 4%
4 Educational 13 2% 58 1%
5 Public and Semi-public 44 5% 106 1%
6 Agriculture 95 11% 5,347 67%
7 Water bodies 16 2% 539 7%
8 Total 844 100% 8,007 100%
Source: Master Plan for Erode
2.4. Demographics
2.4.1. Population trends and projections
Population within ECMC was 4.98 lakh during Census 2011. If we take total area (including areas
added to form ECMC), the population grew at 22.9% during 2001-11. However, population growth
within the core area has been limited with the population of erstwhile Erode municipality growing at
4.3% only. (Refer Exhibit 2.8). Overall population density of the expanded ECMC is low at 45 persons
per hectare and reflects potential for growth in population in future.
Exhibit 2.8ECMC - Population details
Decadal Population density
Areas within Area Population
Sl. No Growth (persons per hectare)
expanded ECMC sq.km.
2001 2011 (%) 2001 2011
1 Erstwhile Erode city 8.44 150,541 156,953 4.3% 178 186
2 Periyasemur 9.13 32,024 55,281 72.6% 35 61
3 Kasipalayam 25.64 52,500 73,375 39.8% 20 29
4 VeerappanChathram 7.36 72,703 84,437 16.1% 99 115
5 Surampatti 3.17 31,948 41,897 31.1% 101 132
10Decadal Population density
Areas within Area Population
Sl. No Growth (persons per hectare)
expanded ECMC sq.km.
2001 2011 (%) 2001 2011
6 Suriyampalayam 17.71 21,893 28,554 30.4% 12 16
7 B.P.Agraharam 10.81 21,458 24,615 14.7% 20 23
8 Thindal 5.89 10,084 15,433 53.0% 17 26
9 Villarasampatty 7.86 4,560 7,439 63.1% 6 9
10 Gangapuram 7.17 4,337 5,840 34.7% 6 8
11 Ellapalayam 3.2 1,921 2,503 30.3% 6 8
12 Muthampalayam 3.14 1,477 1,794 21.5% 5 6
ECMC 109.52 405,446 498,121 22.9% 37 45
Source: ECMC
The decadal population growth percentages show that the Expanded Erode City Municipal
Corporation has registered increase in population growth over the years. The density of the city was
seen to increase from 178 pph to 186 pph during 2001-11. Due to the expansion of the city, the
overall density decreased to 45 pph. As per the City Development Plan for Erode, the population is
expected to be 9.05 lakhs in 2045.
Exhibit 2.9ECMC - Population Projection
Year Projected Population
2015 535,000
2030 700,000
2045 905,000
Source: ECMC CDP, 2013
Social indicators that define the characteristics of the population are Gender ratio and Literacy rate.
As per the Census 2011, the sex ratio in the city is 953females per thousand males. The sex ratio of
the city has fluctuated during the last three decades. The literacy rate was 88.39% in 2011, which was
higher than state‟s average of 86.81%, indicating an increasing awareness for literacy among the
people. Male literacy rate was 93.18%, and female literacy was 83.65%.
2.5. Economic base and growth drivers
Erode has a diverse balanced economy with contributions from agriculture, industry and commerce. In
terms of per capita income, Erode district is ranked 6th amongst all the districts. Erode district is
largely service based with a fairly large agro-base and manufacturing sector presence. The city is
known as the turmeric city and loom city for its national presence in terms of production and trading of
the textile products and turmeric. The sectors having much significance in economic development of
Erode are presented below:
Textiles: Erode is well known for handloom, power-loom textile products and readymade
garments and hence it is called Loom City of India or Tex-valley of India. A number of spinning
mills are situated in and around town of Erode. Textile alone contributes to nearly Rs. 4000 crore
in revenue.
Other Industrial activities: Agro-based industries contribute significantly in the industrial
development at Erode. It is also one of the largest coconut oil producers in south India.
Moreover, there are a lot of dall mills, cotton textiles, vanaspathy manufacturing, wax and screen
printing power loom, sizing, warping and printing press located in the city. In addition, the city has
11a number of tanneries. Erode stands second in leather processing in the state, next only to
Ambur.
Agriculture: Erode has a reasonably developed agro-processing and animal husbandry base.
Agricultural activity in the district is supported by Cauvery, Bhavani. Amaravathi, Uppar and
Parambikulam Aliyarrivers. Turmeric and coconut are grown in the district which is also famous
for rice cultivation, oil mills and dairy products.
Some of the recent developments and proposed initiatives in the region that are likely to have a
bearing on the growth potential in Erode include the proposed Coimbatore-Salem Industrial Corridor,
Coimbatore-Erode-Salem expressway and Perundurai SIPCOT Industrial Park. The proposed
Coimbatore- Salem Industrial Corridor (envisaged with an investment of Rs. 43,000 crore) links
Coimbatore, Erode and Salem districts and is being planned with the objective of a comprehensive
industrial growth in the region
123. Baseline assessment
This chapter presents findings from a review of prevailing service levels and a gap analysis vis-à-vis
benchmark norms across various services. It also reports key performance indicators and provides a
self-assessment on 24 parameters identified under the GoI‟s Smart Cities guidelines provided post
the regional workshops conducted by MOUD.
3.1. Water, Sanitation, Energy and Environment
3.1.1. Water Supply
Refer Exhibit 3.1and Exhibit 3.2for gap analysis of water supply infrastructure / services (existing,
future demand and gaps) and prevailing service levels (vis-à-vis norms)
Exhibit 3.1 Water Supply Gap Analysis: Prevailing Infrastructure/Services vs. Demand
Norms / Demand Gap / Addl. Need
Prevailing
Unit 1 Assumptions / Projected Projected
status 2015 2015
Source 2030 2045 2030 2045
Water Supply* MLD 34 @ 135 LPCD 70 95 122 36 61 88
Treatment Capacity MLD 47 Demand + 15% 80 109 141 33 62 94
Water Sourcing MLD 47 Treatment + 5% 34* 114 148 - 67 101
Storage ML 23 1/3 of demand 23 35 41 - 12 17
Network Length Km 472 AMRUT SLIP 1,643 1,643 1,643 1,171 1,171 1,171
Connections 000s 52 AMRUT SLIP 126 172 222 74 120 170
Source: ECMC. * Actual supply after losses.
Exhibit 3.2 Water Supply: Service levels Vs. Benchmarks
Service Levels Unit Norms Existing
Per Capita Supply LPCD 135 64
Coverage % 100% 38.62%
Duration Hours/day 24 hours No daily supply
NRW % 20% 28%
Metering % of total 100% 20%
Quality % 100% 62%
Complaints redress % of total 100% 100%
Cost recovery % 80% 70%
Collection efficiency % 90% 75%
Source: ECMC, ECMC CDP 2014. Benchmarks are as per SLB Norms provided by MOUD.
Salient aspects of the water supply baseline are explained below:
1. Overall demand-supply, Sourcing and Treatment: The existing source of water supply is
surface water that is from River Cauvery. In addition, the added areas of ECMC (except
Muthamapalayam) have independent water supply distribution and draw small quantities of water
from combined water schemes implemented by TWAD/ independent system. Muthamapalayam
has local bore-wells as source. ECMC currently has a treatment capacity of 47 MLD and a
storage capacity of approximately 23 Million Litres (ML).The daily treated water drawn from the
River amount to 47 MLD .Due to transmission and distribution loss of 13 MLD, 34 MLD
water reaches the public
132. Storage, Distribution and Connections: The total water storage capacity of the city is 25.36
MLD of which 23.4 MLD is elevated service reservoir 1.96 MLD is ground level sumps. 4.28 MLD
of Storage capacity is not usable due to its condition / design restrictions. The water is being
supplied to consumers through elevated reservoirs (31MLD) and through direct pumping (3 MLD)
in added area. In which 3 MLD is transmission loss and 10 MLD is distribution loss due to the
existing condition / design restrictions of distribution network. The total area has been divided into
4 water supply zones for effective operation and maintenance. The storage capacity is
significantly lower than the norm of one-third storage capacity required to provide stable and
reliable supply. ECMC has a network length of approximately 472 km with the core areas of the
city. However the supply of water to the areas varies from daily to alternate days. ECMC has
nearly 51,650 connections much of it in the core areas of the city.
3. Service levels, key issues and gap: As is seen from Exhibit 3.1, ECMC has fairly large
infrastructure gaps across the water value chain vis-à-vis its medium and long-term demand.
Large parts of added areas are uncovered and this is reflected in poor coverage and service
levels. As is apparent from Exhibit 3.2, ECMC lags several indicators on service delivery
performance. At present, the supply of water varies from daily in some areas to alternate days in
other. Similarly it faces gaps in coverage, per capita supply, duration of supply, Non-Revenue
Water and metering, even though it fares better on cost recovery, complaints redress and quality
of supply. Some of the key issues that need to be addressed with respect to water supply are
summarised below:
a. Poor coverage in extended areas
b. Insufficient source
c. Duration and reliability of supply is poor.
d. Absence of Bulk water metering leads to ineffective monitoring of flow in
reservoirs/intermediate storage points.
e. Pipe networks are not laid for some stretches of roads within Corporation boundary. There
are many uncovered areas in the city and these areas are dependent on water supply
through tankers.
f. Supply through public fountains in several areas
g. Weak distribution system even in covered areas which require rehabilitation
4. Recent Proposals and ongoing initiatives: ECMC has identified water supply as a priority area
to address. It has prepared DPRs for provision of a dedicated water supply in both the core areas
and extended areas which includes
a. Source Augmentations
b. Distribution network system
c. House service connections including water metering
d. Providing SCADA system
Implementation of these initiatives can significantly address access gaps across zones in Erode and
could help bring ECMC on par with benchmark levels.
3.1.2. Sewerage and Access to Toilets
Refer Exhibit 3.3 and Exhibit 3.4 for a gap analysis of sewerage and sanitation infrastructure /
services (existing, future demand and gaps) and prevailing service levels (vis-à-vis norms)
14Exhibit 3.3 Sewerage Gap Analysis: Prevailing Infrastructure/Services vs. Demand
Demand Gap / Addl. Need
Prevailing
Unit 1 Norms / Source Projected Projected
status Existing 2015
2025 2045 2025 2045
Generation MLD 27 80% water demand 56 76 98 28 48 71
Treatment Capacity MLD 0 80% water demand 56 76 98 56 76 98
Sewer length km 0 AMRUT SLIP 1,643 1,643 1,643 1,643 1,643 1,643
Connections 000s 0 AMRUT SLIP 126 172 222 126 172 222
Toilets Nos. 177 1 seat / 200 users 443 602 779 266 425 602
Source: ECMC, AMRUT SLIP draft document, ECMC CDP.
Exhibit 3.4 Sewerage: Service levels Vs Benchmarks
Service Sector- Proposed Indicator Norm Status
Coverage of toilets 100% 82%
Coverage of Sewage network services 100% 0%
Collection efficiency of the sewage network 100% 0%
Adequacy of sewage treatment capacity 100% 0%
Quality of sewage treatment capacity 100% 0%
Extent of reuse and recycling of sewage 20% N.A
Efficiency in redressal of customer complaints 80% NA
Extent of cost recovery in sewage 100% N.A
Efficiency in collection of sewage charges 90% N.A
Source: ECMC
1. No Underground System and No treatment facility: At present there is no sewerage system in
Erode City Municipal Corporation and the implementation of the UGD for the erstwhile corporation
area and the four adjoining municipalities namely Veerappanchatram, Kasipalayam, Surampatti
and Periyasemur. is under implementation which will get completed in 2017.
2. Existing Sewer network: Individual sanitary facilities like septic tanks cater to the populace. 60%
of the households have septic tanks.An estimated 17.5% of the households are without any outlet
or toilets. There is discharge of sewage to water bodies and storm water drains in several places.
177 public conveniences cater to population uncovered by septic tanks, which is inadequate to
meet the norms
3. Service levels: As can be seen in Exhibit 3.4, the service levels in sewerage are near to zero and
access to toilets is poor.
4. Ongoing Sewerage expansion and other proposals: The ongoing sewerage network (being
undertaken with KfW assistance) will cover five municipal areas – erstwhile corporation areas,
Veerappachatram, Kasipalayam, Surampatti and Periyasemur – sanitation service delivery and
waste-water management are expected to improve. The projects consider the 2011 census data
and designed for the period of 2025 with the capacity of 43 MLD sewerage generations. The
project components includes the provision of network distribution at a length 506 km and
treatment capacity of 50.55 MLD and the house service connection of 75738 nos. ECMC is
preparing a DPR for covering uncovered areas within ECMC limits. The initial project cost for this
expansion is estimated at Rs 150 crore and will provide 31,500 HSCs in these areas. Further, a
feasibility study for implementing a Tertiary Treatment / Reverse Osmosis facility for reuse and
recycling of domestic sewage is also being initiated. Ongoing project initiatives under Swacch
15Bharat Mission and other state level schemes are being taken up on priority to correct the gaps in
public and community toilets on priority.
3.1.3. Municipal Solid Waste
Refer Exhibit 3.5and Exhibit 3.6 for gap analysis of Municipal Solid Waste (MSW) infrastructure /
services (existing, future demand and gaps) and prevailing service levels (vis-à-vis norms)
Exhibit 3.5 MSW Gap Analysis: Prevailing Infrastructure/Services vs. Demand
Demand Gap / Addl. Need
Prevailing
Unit 1 Norms / Source Projected Projected
status Existing 2015
2025 2045 2025 2045
MSW Generation TPD 250 @ 600 gms / capita 309 420 543 59 170 293
MSW Collection TPD 213 100% collection 309 420 543 97 208 331
Land for processing/landfill Acres 27 1 acre/20,000 26 35 45 - 8 18
Processing capacity TPD 120 85% of generation 247 336 434 127 216 314
Source: ECMC.
Exhibit 3.6 MSW: Service levels Vs. Benchmarks
Services Norm Actual
Door to door coverage 100% 85%
Efficiency of collection of MSW 100% 85%
Segregation 100% -
MSW recovery and disposal 100% 25%
Cost recovery 100% N.A
Collection efficiency 100% N.A
Source: ECMC.
1. Waste generation and primary collection: Erode generates an estimated 250 Tonnes per day
(Translating to over 500 gms per capita per day) of which it manages to collect close to 213
tonnes. The collection is handled completely by ECMC either through its own employees or
through contract labour.
2. Processing and Landfill: There are 2 disposal yards; Vendipalayam and Vairapalayam with a
total landfill area of 27 acres. There is a composting and disposing plant in Vendipalayam. The
composting plant treats around 120 MT of waste per day and is operated by a private operator,
Integrated Waste Management and Urban Services Company (Tamil Nadu) Limited (IWMUST).
The private operator segregates the wastes manually at the yard and makes manure out of the
degradable wastes. Manure is processed through windrow method. For every one ton of manure
that is sold, the private operator pays Rs. 50 to ECMC. The ECMC has delegated the solid waste
management functions including street sweeping, collection and transportation to the four zones.
O&M costs are met from the revenue income and from user fee collected from non-domestic
sources, royalty of compost and sale of rejects to cement company.
3. Proposed initiatives: ECMC now plans to add a 10 MT bio-methanation plant in vendipalayam
compost yard and a compost/disposal facility at Vairapalayam to treat the remaining waste.
3.1.4. Water ways, water bodies and drains
Water ways and drains: ECMC does not have an effective network of storm water drains to dispose
storm water generated in the city. The total length of drains is about 594 km (manmade drains of 571
16km and natural drains of 23 km), which covers about 74% of the total road network in the Corporation
area. Refer Exhibit 3.7 and Exhibit 3.8 for the details and service levels on drains.
Open Drains: The drainage function of an urban local body is related to the disposal of
wastewater and storm water. This is carried out either through underground piped drains
(sewers) or surface drains. Ideally, storm water drainage should be separate from the
wastewater drainage system. But in the absence of closed drainage system in the city, the open
drainage system of Erode carries the wastewater as well as storm water from the entire
Corporation area and finally discharges into the Perumpallam Odai and Pitchakkaran Odai.
Proposed projects: DPR has been prepared for providing Storm Water Drain (macro and micro)
for the city with the project cost estimated as Rs. 900 crore.
Exhibit 3.7 Drain network and service levels
Particulars Unit Quantity
Storm Drain length (manmade) Km 571
Natural Drains (3 Nos.) km 23
No. of locations of water logging Nos. 711
Incidence of sewerage mixing % 7696
Source: ECMC
Exhibit 3.8Storm Drains: Service levels
Sl.N Service Indicator Unit Current Normative Standard
1. Road length covered with storm water % 74% 130
2. Pucca Drains (Open & Closed) % 37% 100
3. Road length covered with built-up drains % 71% 130
Source: ECMC
Water bodies: Within ECMC area there are a number of water bodies and as a first step, ECMC
intends to improve the conditions of 12 water bodies. In addition, clean-up of the Perumpallam odai
and creating an urban forestry layer around it has also been a demand from citizens and
stakeholders.
3.1.5. Energy
Energy Consumption: The sustained demand of the Erode city is 110 per day. The full load capacity
of the sub-stations present in the city is 82 MVA which is not used to its maximum extent as the
supply is only 74 MVA.As adequate and uninterrupted supply of electricity is important, TNEB has
proposed the following initiatives
The contribution of solar energy to be at least 10% of the demand (10 to 11 MW) by installing
solar panels across the corporation.
In the public consultations, the need for underground electric cables was greatly emphasised as
the removal of overhead cables will increase the efficiency of flow of electricity and also free the
road space.
Streetlights: The provision and maintenance of the streetlights is the responsibility of ECMC. At
present there are 18002 streetlights. The coverage of streetlights is around 1 streetlight for every 45
metres of road length, which is lesser than the envisaged norms of a streetlight per 25 metres which is
predominantly because of the less coverage in added areas. Majority of the streetlights (88%) are not
energy efficient adding to the O&M burden of the department. Refer Exhibit 3.9 for the zone-wise
17details of streetlights. ECMC has undertaken/ initiated capital expenditure to Increase coverage in
extended areas, Move towards energy efficient technology, LED streetlights and automatic on-off
technology for energy saving. It is estimated that energy efficient lighting cold help in achieving 42%
energy savings and 15% savings in Maintenance/ repair. Refer Exhibit 3.10 for gap analysis of
streetlight infrastructure existing, future demand and gaps) and prevailing service levels (vis-à-vis
norms).
Exhibit 3.9Streetlights- infrastructure
Energy efficient
Zones Others Total
streetlights
Zone 1 418 3058 3476
Zone 2 743 4277 5020
Zone 3 437 5183 5620
Zone 4 478 3408 3886
Total 2076 15926 18002
Source: ECMC
Exhibit 3.10Streetlights- Demand and Gap
Need Gap / Incremental Need
Norms /
Unit Existing Assumptions/ Projected Projected
Source Now 2015
2030 2045 2030 2045
Road Length km 807 @15 km/sq.km 1643 1643 1643 836 836 836
Distance
Streetlights Nos. 18002 between the 65706 65706 65706 47704 47704 47704
streetlights 25m
Source: ECMC. IMaCS Analysis
183.2. Mobility and Open spaces
3.2.1. City Mobility
Transport Infrastructure: The key characteristics of the transport infrastructure in the city are as
follows:
1. The total city road network in the city is about 807 km of which 110 km of arterial roads. There are
twenty eight junctions located the city area. Road area (14% of total area) and Road length (7.2
km per sq.km) reflect the low road density in the city. Sizeable daily traffic ranging from 11,714
PCU‟s to 35,867 PCU‟s is observed at various Inner Cordon locations.
Exhibit 3.11 Arterial Road network in Erode
Source: ECMC CMP
2. On- street parking has become a menace in the city core area. There is no authorised designated
on-street parking and vehicles are parking haphazardly as parking is free. Parking is observed on
major road stretches in the city core even at the designated „No Parking‟ spaces. On-street
parking demand of two wheelers, cycles and cars is more on busy roads. Off-street parking facility
is available at Erode Railway junction, Erode Central bus terminal and Gani market area.
3. Heavy pedestrian movement is observed along Mettur road, roads near Market area and Panner
Selvam Park. Outof 1102 kms of road length, footpath availability is minimal (available for a length
of 2.6 kms on various roads in the city area, ie; on Perundurai road -1.3 kms, Sathy road-0.6kms,
EVN road – 0.45 kms,
4. Tamil Nadu State Transport Corporation (TNSTC) provides city as well as long distance bus
transport services in Erode. The city bus fleet is 153 (TNSTC- 106, private- 47), operating 1640
services daily. Its city network operation covers 112 routes of which major roads are covered. In
19addition to TNSTC and private buses, a number of mini buses operated by private operators also
provide city services. The condition of buses is poor. There are no bus bays and there are very
few bus shelters in the city. The city has one bus terminal, Central Bus stand located onSathy
road, from where both the city and long distance services are operating. The Central bus stand is
one of the biggest and busiest bus terminals in Tamil Nadu with an area of about 11.20 acres. It is
a Grade-A bus terminal and serves the City and Mofussil bus terminals as well as mini-bus
services.
st
5. Popular personalised modes of transport in Erode are two wheelers and cars. As on 31 March
2013, total number of registered vehicles in the LPA area is 4.51 lakhs. Nearly 84% of the total
registered vehicles are two wheelers, 8% are cars and 4% are commercial vehicles. Availability of
two wheelers and bicycles per household is 0.40 and 0.15 respectively. Vehicle availability per
person for cars is 0.03, the lowest of all three modes.
6. Total daily trips made in LPA are estimated to be 9.78 Lakhs. Total number of trips made by bus,
Car, two-wheelers & Auto rickshaw together is 6.36 Lakhs and remaining is by walk and bicycles.
33% of the trips are made by public transport (bus, railway) and 21% by Two Wheelers. Total
NMT share is 35% (walk is 28% and bicycle- 7%). Share of car is low (6%). Usage of share autos
is minimal in Erode. The average trip length for bus and cars is around 7 km and for two wheelers
5.6 km.
7. About 20- 30% of accidents in the city are fatal. When compared with total accidents, the growth
rate of fatal accidents is also very high (8%/ annum).
Key issues
Erode has radial system of road network, with roads emerging radially from the city center. Congested
roads in the city are concentrated in and around the market area and the Panner Selvam Park. The
basic problem of the city roads is its limited carriage way width coupled with reduction in road lane
capacity due to unauthorised parking, absence of foot path, lack of pedestrian crossing facilities,
encroachment of road space by vendors (in the market area), etc. The combined effect of all the
above is the extreme congestion leading to high air and noise pollution and increased fuel usage.
All the road junctions are managed by at-grade traffic management measures and some of the
intersections are functioning above the limits of this management measure. Two wheelers, cars and
auto rickshaws form the main share of private modes, with two wheeler population having a significant
share of 85%. Public transport is available through mofussil bus services operated by TNSTC and
also by private and mini buses. Service coverage exists to various places in LPA, but many areas still
lack public transport facility.
Erode thus faces various traffic and transportation issues due to Unplanned, intense urban sprawl,
Congestion and urban mobility issues, Absence of non-motorised transport facilities and Unorganized
parking facilities
CMP Vision, Goals and Proposals
1. CMP Vision: The CMP vision for transport in Erode LPA is that “An integrated approach towards
the transport services and systems for Erode to promote sustainable urban transport
infrastructure through various projects, including policies and planning, public transport systems
and goods delivery networks, NMT facilities, land use, with a view to provide safe, affordable and
efficient transportation, with focus on energy efficiency, reduction in pollution and congestion,
controlling urban sprawl by considering the regional and national importance of Erode”.
20You can also read