CLARK COUNTY RECYCLING DONE RIGHT CAMPAIGN - Changing and tracking recycling behavior at the curb
←
→
Page content transcription
If your browser does not render page correctly, please read the page content below
CLARK COUNTY
RECYCLING DONE RIGHT
CAMPAIGN
Changing and tracking recycling behavior at the curb
Kim D. Harless, Environmental Operations Specialist

WSRA WRED Event - March 29th, 2018
CL ARK
COUNT Y, WA
Seven cities and a
town

Largest city:
Vancouver

2017 Population:
474,643

2% increase in
population last few
years

9-12% increase in
tons of garbage over
last few years
500,000

400,000

300,000

200,000

100,000

     0
          1993
                 1995
                        1997
                               1999
                                      2001
                                             2003
                                                    2005
                                                           2007
                                                                  2009
                                                                         2011
                                                                                2013
                                                                                       2015
                                                                                              2017
                  Inbound Tons                        Population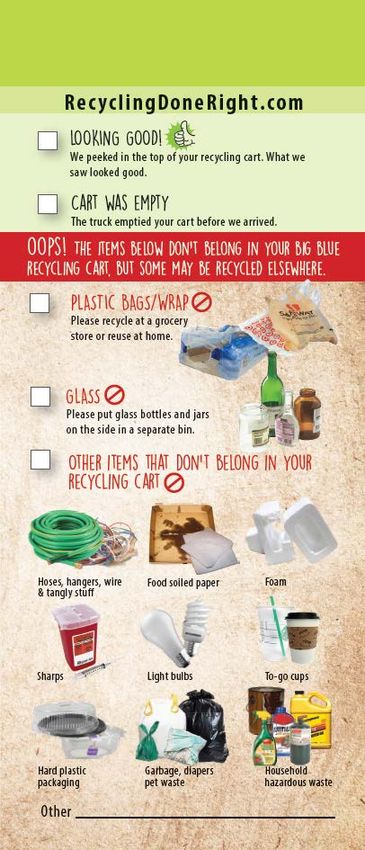
Single-Family Recycling Residue by Percent Weight of
Total Inbound Recyclables

25%
                                                                22.70%

                                                       19.83%
20%                                           19.14%
                            17.81%
                                     16.65%
                   15.71%
          14.72%
15%

      11.43%
10%

5%
  2010     2011    2012     2013     2014     2015     2016      2017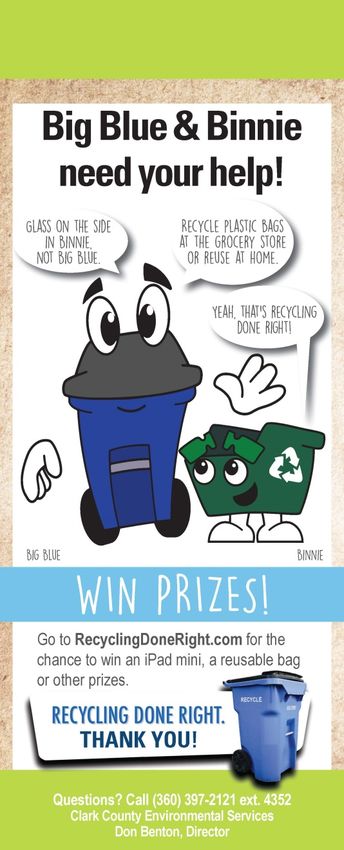
Soft tactics
Pros
• Positive reinforcement
• People may be more openly receptive
• Less likely to negatively react or retaliate

Cons
• May not be as motivated as negative reinforcement
• May not be as effective, but may have same costs

                                                      5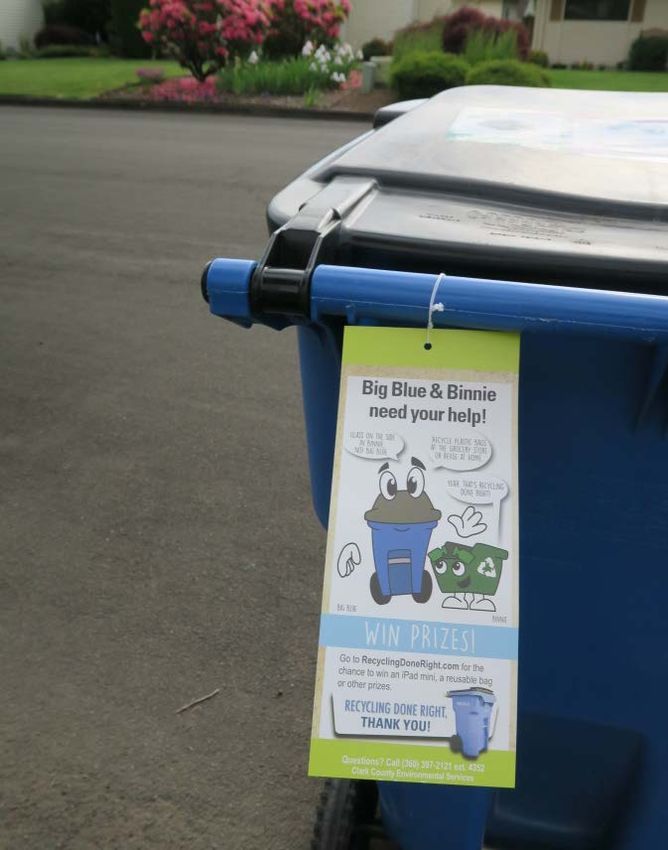
Public Perception
  Wanted to avoid…
   Being the “Recycling Police”
   Negative attitudes towards recycling
   Elected officials - All publicity is not
   good publicity

  Be prepared.
   Notify the police
   Notify elected officials
   Be able to defend your project

                                              6
Why Tags?
Point of behavior

Personal individualized feedback

Reaching new audiences

Collect data from the curb

It is effective…

                                   7
TEST, TEST, TEST
 2010 Pilot
 • Plastic Bags: 70% improvement
 • Glass Bottles: 94% improvement
 • Overall: 22% improvement
 2012 Pilot
 • Saw similar results
 2015 – first rollout year
 • Presort, post sort, and post-post sort

                                            8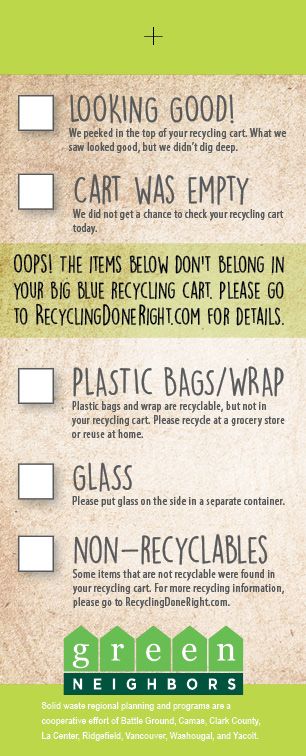
2015 Effectiveness Study Results

                      Control    June 13th     % reduction      October 17th       % reduction
Plastic Bags/Wrap*    1.3%       .78%          40%              .8%                38.5%
Total unacceptable    26.4%      20.5%         22.3%            19.6%              25.8%

         All values percent by weight
         *Significant declines in loose grocery bags; film and wrap remained constant
         Results for glass were uncertain due to seasonal changes and crushed glass

“It appears that the outreach campaign had a positive impact on the
           quality of recyclables set out in Clark County”
                              – Green Solutions

       Check out the Recycling Partnership for resources and case studies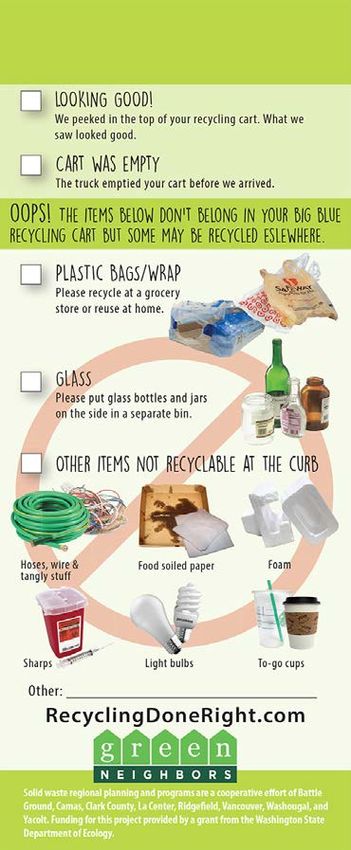
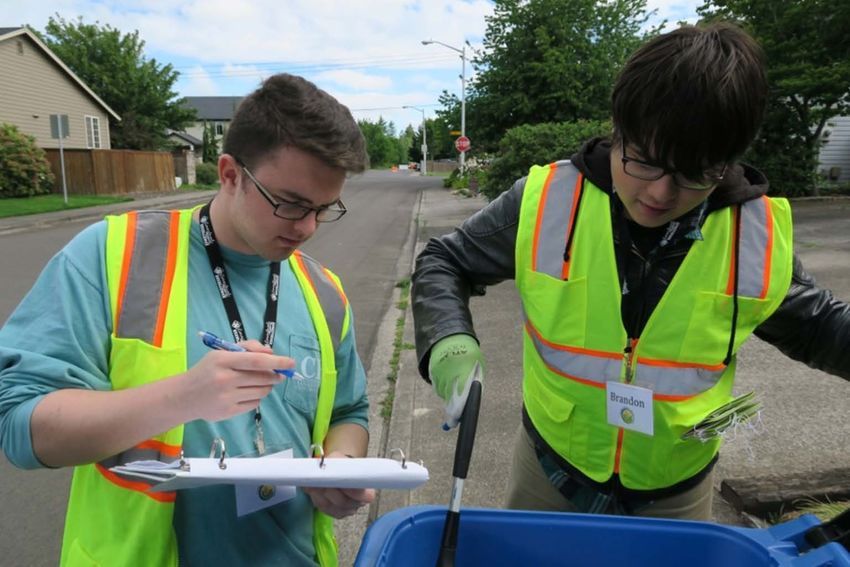
Implementation Overview
4 weeks to target

20,000-25,000 carts with

10 temporary workers in

teams of two

Have only reached
about 60% of
households

                           10
Teams of two
2015 2016 2017
Data Collection Opportunities

       Think of the possibilities! And do it!

                                                13
Data Collection
14What’s in the cart?
Cart Tagging
By occurrence – how popular is the mistake?
• The percent of the population making a mistake – where a behavior
change needs to be made
Characterizations Studies
By ton – how massive is the problem?
• The impact of those incorrect behaviors on the facility
One bad apple or
collective community of mistakes
• Two different problems, with different ways to approach
150.00%
5.00%
10.00%
15.00%
20.00%
25.00%
30.00%
35.00%
Looking Good 30.55%
Hard Plastic Packaging 30.33%
Plastic Bags 20.87%
Plastic Wrap 19.86%
To-go Cups 12.96%
Paper Towels and Napkins 7.47%
Other Garbage 7.00%
Food-soiled Paper 5.96%
Foam 5.08%
Food-soiled Cardboard 5.06%
Tanglies 4.73%
Empty from Truck 4.35%
Tissue 4.28%
Garbage 2.90%
HHW 2.61%
Glass 2.11%
Food Waste 1.90%
Textiles 1.80%
Loose Shredded Paper 0.86%
2017: Percent of carts tagged for...
Wood 0.69%
Wires 0.60%
Yard Debris 0.55%
Empty Set Out 0.47%
Hoses 0.45%
Electronics 0.44%
How popular is the incorrect behavior?
Diapers 0.18%
Light Bulbs 0.05%
Pet Waste 0.05%
Sharps 0.03%
16Top offenders by popularity
1. Miscellaneous hard plastic packaging, such as clamshells, salad containers,
and blister packaging
2. Plastic Bags
3. Plastic Wrap/Film
4. To-go cups (paper and plastic)
5. Paper towels and Napkins
6. Other garbage (not any other category; not a bag of garbage)
• Home goods like brushes, shower curtains, plastic plants and chairs, etc.
• Other plastic packaging like candy wrappers
• Lids to containers
• Cigarette butts and packaging
17RESIDUE VERSUS CONTAMINATION
End of the sorting process
vs.
Actual non-program materials due to
customer error
Contracted with Green Solutions in 2016 and 2017
to find answers
18Single-Family Recycling Residue by Percent Weight of
Total Inbound Recyclables
25%
22.70%
19.83%
20% 19.14%
17.81%
16.65%
15.71%
14.72% 14.70%
15%
10.60%
11.43%
10%
9.23%
8.00%
5%
2010 2011 2012 2013 2014 2015 2016 2017
Residue Rate Contamination Rate MRF ErrorImpact, by weight, at the MRF?
Material % Description
Fines 26.0%Too small
Plastic packaging 6.9%clamshells, lids, blister and other plastic packaging
Other wastes 4.8%Other items like diapers and miscellaneous garbage
Non-recyclable paper 4.1%Wax or plastic coated, wet strength and freezer boxes
Wood and C/D 4.0%
Plastic objects 3.9%like toys and other objects, not packaging
Rigid plastics 3.8%Possible to be recycled within a rigid recycling program
Textiles 2.8%
Food Waste 2.6%
Bagged garbage 2.4%A bag of garbage
Glass 1.5%Any glass
Plastic bags 1.4%
Plastic film and wrap 1.3%
Non-recyclable metals 0.7%Mixed metals, metal lids, and appliances
Styrofoam 0.3%
Shredded paper 0.2%Both bagged and loose
20Rank Popularity Weight Combined MRF Top 7 MRF Top 7
Hit List?
(cart tags) (sort study) Top 5 Pre-Sword Post-Sword
Plastic Packaging, Plastic Hoses and Hoses and
Plastic Plastic bags and
1 including plastic Packaging stretchy or stretchy or
Packaging film
cups (2) tangly items tangly items
Plastic Bags Non-recyclable
To-go cups Plastic Bags Plastic Bags and
2 and Other waste paper and food
(4) and Film Film
Wrap/Film waste
Bottles of
Non-recyclable Other waste Biological
3 To-go Cups Hazardous Textiles
Paper (7) waste
Chemicals
Non- GARBAGE,
Paper Towels Food-soiled
4 Wood and C/D recyclable Textiles** including
and Napkins paper
Paper (7) biological
Plastic bags Bottles of
Other Plastic Objects Non-recyclable
5 & Wrap/Film Propane tanks Hazardous
garbage and Rigid Plastics plastics…?
(9) Chemicals
Food soiled
Food-soiled
6 Textiles Sharps paper and food
paper
waste**
Styrofoam
Plastic Bags and Large car
7 (including Propane tanks
Wrap/Film parts
food service)
21Clark County’s status
22Impacts of National Sword on Clark County
Increased operational costs
Increased bale quality
Increased residue
Increased domestic end-markets available
Nothing has been taken off the recycling list!
232017
September/October
• Brokers became conservative and market for MWP became uncertain,
• MWP began to stockpile
• Added at four FTEs to improve bale quality
• ~5% to 1.9% contamination
• Slowed line. Material still coming in and flowing out doors – bottleneck
November
• Slowed the sort line from 25 tons per hour to 14
• Diverting nearly all out-of-county tons to other MRFs
• Material no longer flowing outside the facility
• Added another four FTEs to paper sort lines
• Material going to SE Asia instead of China
December
• MWP became no longer marketable. Creating ONP product instead.
• Remaining MWP reprocessed into ONP, or disposed
242018
January
• Domestic markets reemerged to accept ONP product
• 1.1% contamination
February
• 0.65% contamination – so close!
• 10-15% of the paper that was formerly recycled is now
landfilled
March
• Material is all able to be moved
• Some disposal of stored bales from when the market
disruption first occurred
• Possible buyer identified of the 10-15% MWP that used to be
recycled
25Public and Political Perception
• Upset to learn recyclables were
going to China
• China is not to blame
• Opened some eyes about the
mystical process
• Elves come and pick up
• Fairies use magic at the facilities to
make new items!
• Public may be more receptive
to “stronger arm” tactics
26Outreach
27In the Portland, OR Media-shed
Different states
Different state agencies
Different system models
Same waste-shed (mostly)
28What we are doing in response
Now… Upcoming…
• Blogs • Inviting local news or
radio hosts to come to
• App transfer station
• Tabling • Help in separating us from
• Social media Portland and Oregon
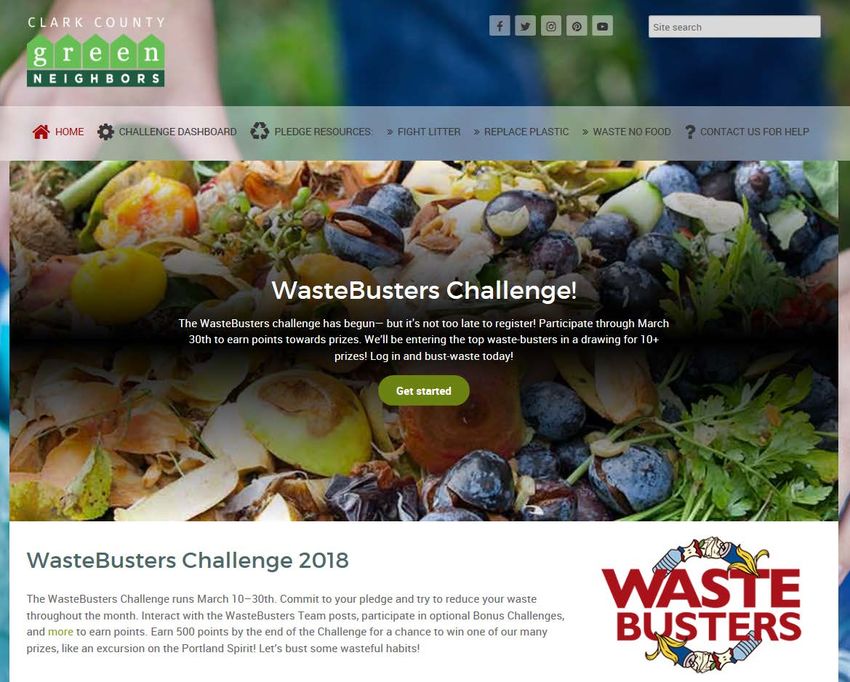
• Challenge • Inspire confidence in the
system
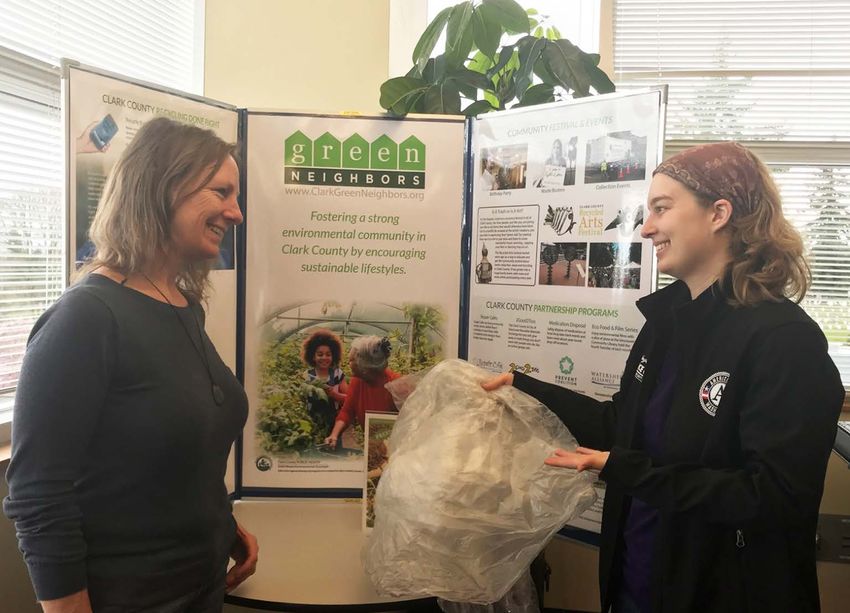
29Resilient Recycler Green Neighbors Blog Series
RecycleRight App
Tabling Events
Social Media
In conclusion
• Soft approaches are effective too

• Great for communities that would be resistant
  • Who particularly value privacy and property

• Use tested models
  • such as those by the Recycling Partnership

• Pilot in your community before rolling out

• National Sword may open opportunities to be more strong-
 armed, but soft is a good start

                                                             35
Questions?
Kim D. Harless
Kim.Harless@clark.wa.gov
360.397.2121 ext. 5957
Clark County Recycling Done Right Campaign 3/29/18 36You can also read