Classification of Level 2 Driving Events Observed on Public Roads - DOT HS 812 980 January 2021 - ROSA P
←
→
Page content transcription
If your browser does not render page correctly, please read the page content below
DOT HS 812 980 January 2021

Classification of Level 2 Driving
Events Observed on Public Roads

Disclaimer
 This publication is distributed by the U.S. Department of Transportation,
 National Highway Traffic Safety Administration, in the interest of
 information exchange. The opinions, findings, and conclusions expressed
 in this publication are those of the authors and not necessarily those of
 the Department of Transportation or the National Highway Traffic Safety
 Administration. The United States Government assumes no liability for
 its contents or use thereof. If trade or manufacturers’ names or products
 are mentioned, it is because they are considered essential to the object of
 the publication and should not be construed as an endorsement. The
 United States Government does not endorse products or manufacturers.

 NOTE: This report is published in the interest of advancing motor
 vehicle safety research. While the report may provide results from
 research or tests using specifically identified motor vehicle models, it is
 not intended to make conclusions about the safety performance or safety
 compliance of those motor vehicles, and no such conclusions should be
 drawn.

Suggested APA format citation:

Rao, S. J. & Forkenbrock, G. J. (2021, January). Classification of level 2 driving events observed
 on public roads (Report No. DOT HS 812 980). National Highway Traffic Safety
 Administration.

Technical Report Documentation Page
 1. Report No. 2. Government Accession No. 3. Recipient's Catalog No.
 DOT HS 812 980
 4. Title and Subtitle 5. Report Date
 Classification of Level 2 Driving Events Observed on Public Roads January 2021
 6. Performing Organization Code
 NSR-120
 7. Authors 8. Performing Organization
 Sughosh J. Rao, Ph.D., Transportation Research Center, Inc. Report No.
 Garrick J. Forkenbrock, NHTSA
 9. Performing Organization Name and Address 10. Work Unit No. (TRAIS)
 NHTSA Vehicle Research and Test Center
 P.O. Box 37
 11. Contract or Grant No.
 East Liberty, OH 43319
 12. Sponsoring Agency Name and Address 13. Type of Report and Period
 National Highway Traffic Safety Administration Final Report
 1200 New Jersey Avenue SE 14. Sponsoring Agency Code
 Washington, DC 20590
 15. Supplementary Notes
 The authors acknowledge the support of Randy Landes, Thomas Gerlach Jr., and Bryan O’Harra for assistance with
 vehicle preparation, data processing, testing, and report review.

 16. Abstract
 This report summarizes data collected with three commercially available light vehicles equipped with SAE level 2
 driving automation systems: a 2018 Cadillac CT6, a 2018 Nissan Leaf, and a 2018 Lexus LS500. SAE level 2
 driving automation systems are referred to as partial driving automation systems and require the full and
 undivided attention of the driver at all times, and drivers are expected to assure the safety of the vehicles.

 Up to three routes with a different mix of roadway types were used: (1) a highway route composed exclusively of
 divided, limited-access highways with exit and on ramps; (2) a rural route that consisted primarily of roads with a
 single lane per travel direction passing through signalized or signed intersections; and (3) a mixed route composed
 of highway, rural, and city driving.

 The operation of each level 2 driving automation system was recorded. The responses of the systems to various
 real-life traffic scenarios were studied, and observed “events” were categorized into one of three categories: (1)
 events where the vehicle, during otherwise normal driving, suddenly terminated its level 2 driving automation
 system operation and transferred full control back to the driver (Type I); (2) driving situations where the system
 remained in operation but satisfied certain classification criteria (Type II); and (3) driving situations where either
 the driver performed a manual override to disengage the system, or an unintended lane departure had occurred
 (Type III). Details regarding the availability of the level 2 driving automation systems, the various events
 recorded, and the prevailing road and weather conditions are provided.

 17. Key Words 18. Distribution Statement
 automated vehicle, AV, automated driving, level 2 driving automation, highway Document is available to the
 driving, Super Cruise, ProPilot, Safety System +A public from the National
 Technical Information
 Service, www.ntis.gov.
 19. Security Classif. (of this report) 20. Security Classif. (of this page) 21. No. of Pages 22. Price
 Unclassified Unclassified 56
Form DOT F 1700.7 (8-72) Reproduction of completed page authorized

 i
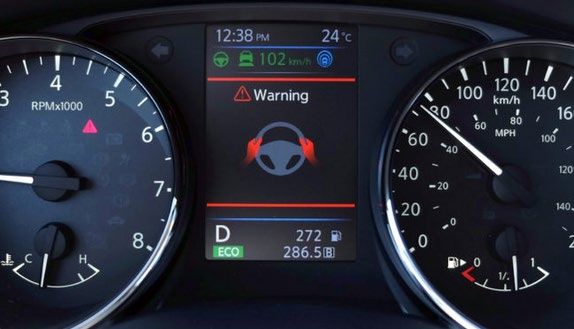
Table of Contents

GLOSSARY ................................................................................................................................................ v
EXECUTIVE SUMMARY ....................................................................................................................... vi
1 INTRODUCTION ............................................................................................................................... 1
 1.1 Objective and Evaluation Overview .......................................................................................... 1
 1.2 Test Vehicles ............................................................................................................................. 1
 1.2.1 2018 Cadillac CT6 .........................................................................................1
 1.2.2 2018 Nissan Leaf ............................................................................................3
 1.2.3 2018 Lexus LS500 .........................................................................................4
 1.2.4 Level 2 Driving Automation System Implementation and Functionality ......5
 1.3 Test Routes ................................................................................................................................ 5
 1.3.1 Highway Route ...............................................................................................6
 1.3.2 Rural Route ....................................................................................................7
 1.3.3 Mixed Route ...................................................................................................7
 1.4 Vehicle Drives Matrix ............................................................................................................... 8
 1.5 Instrumentation.......................................................................................................................... 9
2 EVENT OCCURANCE AND PREVAILING ENVIRONMENTAL AND ROAD
 CONDITIONS................................................................................................................................... 10
 2.1 Event Classification ................................................................................................................. 10
 2.2 Environment Classification ..................................................................................................... 11
 2.3 Cadillac CT6 Performance ...................................................................................................... 12
 2.3.1 Cadillac CT6 Super Cruise Availability Analysis........................................12
 2.3.2 Cadillac CT6 – Highway Route Performance ..............................................14
 2.4 Nissan Leaf Performance ........................................................................................................ 17
 2.4.1 Nissan Leaf – Highway Route Performance ................................................17
 2.4.2 Nissan Leaf – Rural Route Performance ......................................................20
 2.4.3 Nissan Leaf – Mixed Route Performance ....................................................23
 2.5 Lexus LS500 Results ............................................................................................................... 26
 2.5.1 Lexus LS500 – Highway Route Performance ..............................................26
 2.5.2 Lexus LS500 – Rural Route Performance....................................................29
 2.5.3 Lexus LS500 – Mixed Route Performance ..................................................32
3 SUMMARY OF AVERAGE NUMBER OF EVENTS PER CATEGORY ................................. 36
 3.1 Overall Highway Route Performance ..................................................................................... 36
 3.2 Overall Rural Route Performance ........................................................................................... 36
 3.3 Overall Mixed Route Performance .......................................................................................... 37
 3.4 Miscellaneous Comments........................................................................................................ 38
4 CONCLUSIONS ............................................................................................................................... 39

 ii
5 REFERENCES .................................................................................................................................. 41
APPENDIX A: Cadillac CT6 Super Cruise Driver Display ................................................................ A-1
APPENDIX B: Nissan Leaf ProPilot Assist Driver Display ................................................................ B-1
APPENDIX C: Lexus LS500 Driver Display ........................................................................................ C-1
FIGURES
 Figure 1.1. 2018 Cadillac CT6. .............................................................................................................. 2
 Figure 1.2. GM Super Cruise availability map. ...................................................................................... 2
 Figure 1.3. 2018 Nissan Leaf. ................................................................................................................ 3
 Figure 1.4. 2018 Lexus LS500. .............................................................................................................. 4
 Figure 1.5. Highway route. ..................................................................................................................... 6
 Figure 1.6. Rural route. .......................................................................................................................... 7
 Figure 1.7. Mixed route. ......................................................................................................................... 8
 Figure 2.1. Comparison of highway route and Super Cruise availability map..................................... 13
 Figure 2.2. Net miles of Super Cruise unavailability ........................................................................... 14
 Figure 3.1. Highway route – events per 100 miles comparison by event category. ............................. 36
 Figure 3.2. Rural route – events per 100 miles comparison by event category. ................................... 37
 Figure 3.3. Mixed route – events per 100 miles comparison by event category. ................................. 38
 Figure 5.1. Cadillac CT6 instrument cluster. ..................................................................................... A-1
 Figure 5.2. Nissan Leaf ProPILOT Assist instrument cluster display. ............................................... B-1
 Figure 5.3. Nissan Leaf ProPILOT Assist driver engagement warning. ............................................ B-1
 Figure 5.4. Lexus LS 500 instrument cluster display. ........................................................................ C-1
 Figure 5.5. Lexus LS500 lane departure alert function display.......................................................... C-2
 Figure 5.6. Driver attention warning. ................................................................................................. C-2
TABLES
 Table 1.1. Level 2 Driving Automation System Implementation and Functionality Summary ............. 5
 Table 2.1. Super Cruise Unavailability Statistics for Each Drive ........................................................ 14
 Table 2.2. Cadillac CT6 Highway Route Event Categories Breakdown .............................................. 15
 Table 2.3. Cadillac CT6 Highway Drive Type I Event Results ........................................................... 15
 Table 2.4. Cadillac CT6 Highway Drive Type II Event Results .......................................................... 16
 Table 2.5. Cadillac CT6 Highway Drive Type III Event Results......................................................... 17
 Table 2.6. Nissan Leaf Highway Route Event Types Breakdown ....................................................... 18
 Table 2.7. Nissan Leaf Highway Route Type I Event Results ............................................................. 18
 Table 2.8. Nissan Leaf Highway Route Type II Event Results ............................................................ 19
 Table 2.9. Nissan Leaf Highway Route Type III Event Results .......................................................... 20
 Table 2.10. Nissan Leaf Rural Route Event Categories Breakdown .................................................... 20
 Table 2.11. Nissan Leaf Rural Route Type I Event Results ................................................................. 21
 Table 2.12. Nissan Leaf Rural Route Type II Event Results................................................................ 22
 Table 2.13. Nissan Leaf Rural Route Type III Event Results .............................................................. 23
 Table 2.14. Nissan Leaf Mixed Route Event Categories Breakdown .................................................. 23
 Table 2.15. Nissan Leaf Mixed Route Type I Event Results ............................................................... 24
 Table 2.16. Nissan Leaf Mixed Route Type II Event Results .............................................................. 25
 Table 2.17. Nissan Leaf Mixed Route Type III Event Results ............................................................. 26
 Table 2.18. Lexus LS500 Highway Route Event Types Breakdown ................................................... 26
 Table 2.19. Lexus LS500 Highway Route Type I Event Results ......................................................... 27
 Table 2.20. Lexus LS500 Highway Route Type II Event Results........................................................ 28
 Table 2.21. Lexus LS500 Highway Route Type III Event Results ...................................................... 29
 Table 2.22. Lexus LS500 Rural Route Event Categories Breakdown ................................................. 29
 Table 2.23. Lexus LS500 Rural Route Type I Event Results............................................................... 30

 iii
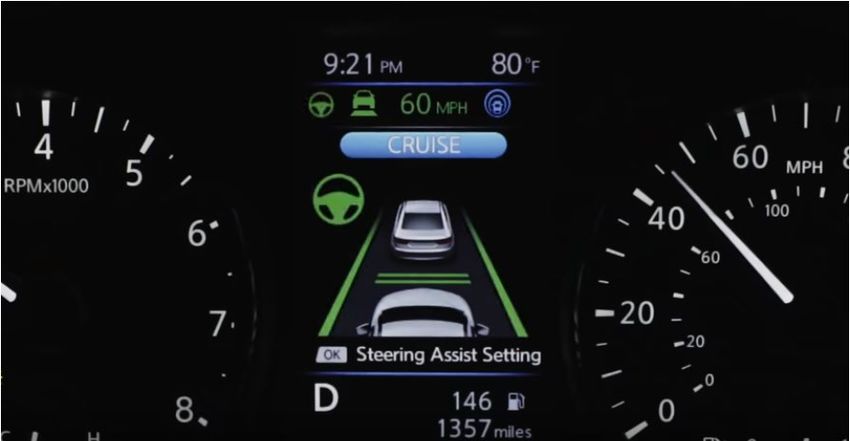
Table 2.24. Lexus LS500 Rural Route Type II Event Results ............................................................. 31
Table 2.25. Lexus LS500 Rural Route Type III Event Results ............................................................ 32
Table 2.26. Lexus LS500 Mixed Route Event Categories Breakdown ................................................ 32
Table 2.27. Lexus LS500 Mixed Route Type I Event Results ............................................................. 33
Table 2.28. Lexus LS500 Mixed Route Type II Event Results ............................................................ 34
Table 2.29. Lexus LS500 Mixed Route Type III Event Results .......................................................... 35
Table 5.1. Super Cruise Status Indications ......................................................................................... A-2

 iv
GLOSSARY

ACC adaptive cruise control
LKA lane keeping assist (relates to the Lexus LS500)
LTA lane tracing assist (relates to the Lexus LS500)
ODD operational design domain
SC Super Cruise (relates to the Cadillac CT6)
S.R. State Route
TRAC traction control (relates to the Lexus LS500)
TRC Transportation Research Center, Inc.
VDC vehicle dynamic control (relates to the Nissan Leaf)
VSC Vehicle Stability Control (relates to the Lexus LS500)

 v
EXECUTIVE SUMMARY

This report summarizes the data collected while operating three vehicles equipped with SAE
level 2 driving automation systems, which are a form of advanced driver assistance systems, on
three different routes. The three vehicles driven were a 2018 Cadillac CT6, a 2018 Nissan Leaf,
and a 2018 Lexus LS500. The three routes used a different mix of roadway types: (1) a highway
route composed exclusively of divided, limited-access highways with exit and on ramps; (2) a
rural route that consisted primarily of roads with a single lane per travel direction passing
through signalized and non-signalized intersections; and (3) a mixed route with a mix of
highway, rural, and city roadways.

Two of the three vehicles were repeatedly driven on each route, and the operations of their
respective level 2 driving automation systems were recorded. The Cadillac CT6 level 2 driving
automation system, trademarked as “Super Cruise,” is geofenced to work only on certain limited-
access divided highways that have been mapped by General Motors, according to the manufacturer.
For this reason, the Cadillac CT6 was only operated on the highway route. While operating the
vehicles in level 2 driving automation, the drivers, who were professional experimenters and/or
test drivers, held their hands just above or lightly touched the respective steering wheels.

Using instrumented cameras, driver-annotated video and GPS were used to document system
availability and operation to various real-life traffic scenarios. Three classification types were
developed to describe events that observed during the drives.

 • Type I events occurred when the level 2 driving automation system, during otherwise
 normal driving operation, (1) suddenly terminated its level 2 driving automation
 operation; (2) issued a takeover notification to the driver; and (3) transferred full control
 back to the driver. This required the driver to immediately respond by resuming manual
 control of the vehicle.

 • Type II events occurred when the level 2 driving automation system exhibited some form
 of subjectively noteworthy operation, but not to the point where the driver believed it was
 necessary to manually override the system to regain full control of the vehicle. At the
 time of the Type II event, the level 2 driving automation system was actively providing
 lateral and longitudinal control of the vehicle without issuing an alert or warning to the
 driver.

 • Type III events occurred during driving situations where either the driver performed an
 override input to immediately disengage the system and resumed full manual control, or
 an unintended lane departure had occurred.

From the driver’s perspective, the important distinction between Type II and III events was how
they responded to the event. A driving situation where the vehicle maintained a lane position bias
near the roadway center line separating the driver’s vehicle from oncoming traffic is an example
of a Type II event. Conversely, when a Type III event concluded with the driver applying a
manual override, it was because they believed the vehicle was unable to continue automatically
performing the driving task. A common Type III event example occurred when the vehicle

 vi

entered, and initially responded to, a curved section of road, but was unable to maintain lane
position within the entire curve. In this case, the driver had to resume manual steering of the
vehicle to prevent a lane departure.

For the Cadillac CT6, Super Cruise would sometimes disengage on roads within its operational
design domain (ODD). Over the 1,620 miles of highway route driving, 95.8 percent of which
were within the Super Cruise ODD, the system was unavailable for 24.1 percent of the miles. It
is important to highlight that the Cadillac CT6 received a map update midway through the
testing. After the map update, the Super Cruise unavailability averaged 18.0 percent of the
highway route miles.

In summary, the Cadillac CT6 averaged:

 • 22.7 Type I events per 100 miles on the highway route, often due to geofencing near
 entry/exit ramps;
 • 2.4 Type II events per 100 miles on the highway route; and
 • 0.7 Type III events every 100 miles on the highway route.

For the Nissan Leaf:

 • Type I events per 100 miles averaged 10.5, 23.7, and 21.3, for the highway, rural, and
 mixed routes, respectively.
 • Type II events per 100 miles averaged 4.1, 3.1, and 4.8, for the highway, rural, and mixed
 routes, respectively.
 • Type III events per 100 miles averaged 13.0, 15.4, and 27.5, for the highway, rural, and
 mixed routes, respectively. All the rural and mixed route Type III events were lane
 departures. Overall, 480 of the 486 Type III events were lane departures for the Nissan
 Leaf.

The Lexus LS500 averaged:

 • Type I events per 100 miles averaged 4.8, 10.3, and 38.7, for the highway, rural, and
 mixed routes, respectively.
 • Type II events per 100 miles averaged 6.5, 11.3, and 32.6, for the highway, rural, and
 mixed routes, respectively.
 • Type III events per 100 miles averaged 23.5, 178.0, and 124.6, for the highway, rural,
 and mixed routes, respectively. All Type III events were lane departures for the Lexus
 LS500.

While this study documents observed statistics for the identified categories of events associated
with the tested SAE level 2 driving automation systems (SAE International, 2018), there are no
documented or implied conclusions in this report over their correlation to driving safety, driver
engagement, or consumer acceptance.

 vii
1 INTRODUCTION

There are many factors that can affect the performance of SAE driving level 2 driving
automation systems (SAE International, 2018), 1 and not all systems have the same operational
characteristics. As such, better understanding how vehicles equipped with these systems operate
in the real world is of great interest to NHTSA.

1.1 Objective and Evaluation Overview

The work described in this report was performed to document the observations that were made
while operating three passenger cars equipped with level 2 driving automation systems on public
roads. Up to three test routes, and multiple drives per route, were used. Additionally, since a
driver must instantly respond to a take-over request presented by a level 2 driving automation
system, the state of the vehicle and the driving environment surrounding it at the time of the
request was documented. The process used to perform this evaluation included the following
steps.

 • Identify and procure three vehicles equipped with a level 2 driving automation system.
 • Select routes for highway driving, rural driving, and mixed driving.
 • Instrument test vehicles.
 • Perform test-drives on the selected test routes.
 • Summarize the performance of the vehicles.

1.2 Test Vehicles

Among the pool of candidate vehicles equipped with level 2 driving automation systems at
NHTSA’s Vehicle Research and Test Center, the three most recent model year vehicles were
selected.

 1. 2018 Cadillac CT6
 2. 2018 Nissan Leaf
 3. 2018 Lexus LS500

A brief description of each vehicle is provided in the following subsections.

1.2.1 2018 Cadillac CT6

The level 2 driving automation system, available for the 2018 Cadillac CT6 (Figure 1.1), is
named Super Cruise. Super Cruise can automatically steer to maintain lane position under certain

1
 SAE J3016 defines level 2 driving automation as “the sustained and ODD-specific execution by a driving automation
system of both the lateral and longitudinal vehicle motion control subtasks of the DDT with the expectation that the
driver completes the OEDR subtask and supervises the driving automation system,” where the ODD is the operational
design domain, DDT is the dynamic driving task, and OEDR is the object and event detection and response.

 1
conditions on limited-access freeways that are separated from opposing traffic. The system
works in conjunction with adaptive cruise control (ACC), which controls acceleration and
braking while Super Cruise is enabled and in operation. At the time this report was written,
Super Cruise was the only level 2 driving automation system available on the market, suggesting
that drivers can use it hands-free. Figure 1.2 illustrates the system’s availability map around
Columbus, Ohio, from the Cadillac website during this study (www.cadillac.com/world-of-
cadillac/innovation/super-cruise).

 Figure 1.1. 2018 Cadillac CT6.

 Figure 1.2. GM Super Cruise availability map. 2

The Super Cruise driver indications and warnings are detailed in Appendix A. The following
operating conditions, taken from the Cadillac CT6 owner’s manual (General Motors LLC, 2018),
is indicated to be satisfied for Super Cruise to be engaged:

 1. ACC is turned on.
 2. Forward automatic braking is set to “Alert and Brake” in the vehicle settings.

2
 The Super Cruise availability map on the Cadillac website has since been updated. This figure shows the availability
map when the work described in this report was conducted.

 2
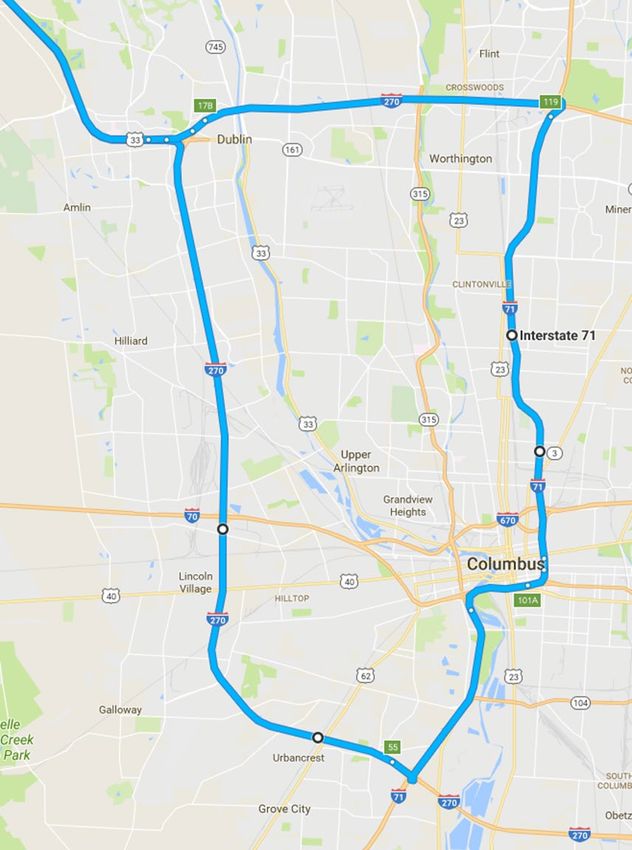
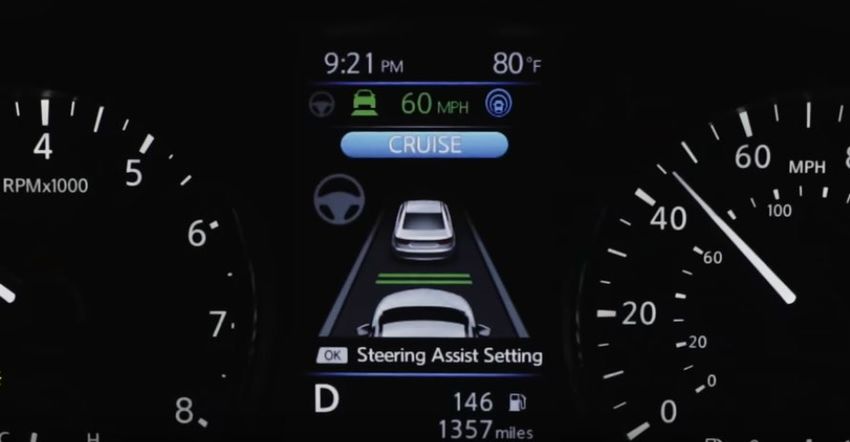
3. The vehicle is located on a limited-access freeway where Super Cruise is available.
 4. The Super Cruise camera and radar sensors are not obstructed or damaged.
 5. Lane markings are clearly visible.
 6. Driver attention is detected by driver facing camera.
 7. Teen driver setting is not active.

1.2.2 2018 Nissan Leaf

The 2018 Nissan Leaf (Figure 1.3) is available with an optional level 2 driving automation
system named ProPILOT Assist (subsequently referred to simply as ProPILOT). ProPILOT
includes Nissan’s intelligent cruise control (ICC) and steering assist (SA) systems. When both
these features are activated, ProPILOT provides level 2 driving automation functionality. The
Nissan Leaf owner’s manual (Nissan North America, Inc., 2018) states that ProPILOT should
only be engaged during highway driving, but since the driver can enable and operate ProPILOT
off highway (i.e., it is not geofenced), the Nissan Leaf was tested on the mixed and rural routes
in addition to the highway route.

 Figure 1.3. 2018 Nissan Leaf.

The ProPILOT Assist driver indications and warnings are detailed in Appendix B. The Nissan
Leaf owner’s manual (Nissan North America, Inc., 2018) states that ProPILOT cannot be set
when:

 1. Vehicle speed is below 20 mph (32 km/h) and the vehicle ahead is not detected.
 2. The shift lever is not in the D (drive) position.
 3. Parking brake is applied.
 4. Brakes are operated by the driver.
 5. Vehicle dynamic control (VDC) is off. 3
 6. VDC system is operating. 4

3
 Although it is not directly stated in the owner’s manual, NHTSA interprets “VDC off” as being switched off by the
driver or disabled due to a system fault. Nissan uses VDC to describe the Leaf’s electronic stability control system.
4
 Although it is not directly stated in the owner’s manual, NHTSA interprets “VDC system is operating” as a time
during which electronic stability control is actively trying to stabilize the vehicle.

 3
7. Wheel slip is occurring.
 8. Any door is open.
 9. Driver’s seat belt is not fastened.

1.2.3 2018 Lexus LS500

The level 2 driving automation system available for the 2018 Lexus LS500 (Figure 1.4) is part
of the Lexus Safety System +A option package. This package includes lane-tracing assist (LTA)
and lane-keeping assist (LKA) which, when used in conjunction with ACC, to provide level 2
driving automation functionality. The Lexus LS500 owner’s manual (Lexus, 2018) states that the
LTA and LKA systems should only be engaged during highway driving. However, since the
driver can enable and operate these systems off highway (i.e., the system operation is not
geofenced), the vehicle was tested on the mixed and rural routes in addition to the highway route.

 Figure 1.4. 2018 Lexus LS500.

The Lexus LS500 driver indications and warnings are detailed in Appendix C. The Lexus LS500
owner’s manual (2018) states that the following conditions must be met for the vehicle’s level 2
driving automation system to operate:

 1. LKA is turned on.
 2. Setting for “Steering Assist” and “Lane Center” in the multi-information display are set
 to “On.”
 3. System recognizes white or yellow lines.
 4. Dynamic radar cruise control with full-speed range is in operation.
 5. Width of traffic lane is approximately 8.2 to 13.5 ft (2.5 to 4.1 m).
 6. Turn signal lever is not operated.
 7. Vehicle is driven on a straight road or around a gentle curve with a radius of more than
 approximately 656 ft (200 m).
 8. No system malfunctions are detected.
 9. Vehicle does not accelerate or decelerate by a fixed amount or more.
 10. Steering wheel is not operated with a steering force level suitable for changing lanes.
 11. Hands off steering wheel alert is not displayed.

 4
12. Vehicle Stability Control (VSC) and traction control (TRAC) are turned on.
 13. VSC, TRAC, antilock brake system (ABS) and pre-collision system are not operating.
 14. Steering assist function is not operating.

1.2.4 Level 2 Driving Automation System Implementation and Functionality

The implementation and functionality of level 2 driving automation systems can vary widely.
Variations can include not just the features and/or capabilities of the system (e.g., an ability to
perform automatic lane changes around slower-moving traffic) but also the enabling sensors. A
description of these factors, for the vehicles used in this study, is presented in Table 1.1.

 Table 1.1. Level 2 Driving Automation System Implementation and Functionality Summary
 Description Cadillac CT6 Nissan Leaf Lexus LS500
 Front-facing short- and long- Front-facing short- and long-
 Front-facing radar and mono
 Sensors range radars, mono camera. range radars, and stereo
 camera.
 lidar mapping and GPS data. cameras.
 Geographical Certain limited-access, divided
 operational highways mapped by General Highway driving Highway driving
 design domain Motors.
 System available on all System available on all
 Geofenced to certain divided public roads with lane lines public roads with lane lines
 Availability highways mapped by General at the discretion of driver; at the discretion of driver;
 Motors. owner’s manual suggests to owner’s manual suggests to
 only use on highways. only use on highways.
 Auto lane change
 None None None
 capability
 Driver engagement
 Monitors driver gaze and Driver engagement
 Driver attention monitored only through
 attention with driver-facing monitored only through a
 monitoring capacitive touch sensor on
 camera. steering wheel torque sensor.
 steering wheel.
 Potentially unlimited duration
 Limited duration (~17s in
 of hands-off driving (within Limited duration (~10s) of
 straights, ~4s in curves) of
 Hands free the ODD) for as long as hands-off driving before
 hands-off driving before
 driving camera-based attention system issues warning to
 system issues warning to
 monitoring system confirms hold steering wheel.
 hold steering wheel.
 engagement.

1.3 Test Routes

Three separate test routes were designed to include a specific mix of road types and diverse
operating conditions. Some of these routes were outside the intended geographical and/or
environmental ODD of the test vehicles’ level 2 driving automation systems. The routes are
described in the following subsections.

 5
1.3.1 Highway Route

The highway route (Figure 1.5) consisted exclusively of divided, controlled-access highways
with exit ramps and on ramps. This route:

 • Began on Ohio State Route (S.R.) 347 heading west at the entrance of Transportation
 Research Center Inc. (TRC);
 • Turned southwest on U.S. 33;
 • Went onto I-270 south counterclockwise around Columbus;
 • Took I-71 north through Columbus;
 • Merged onto I-270 west;
 • Went onto U.S. 33 traveling northeast; and
 • Ended on S.R. 347 at the TRC entrance.

The highway route was 108 miles long and under normal traffic conditions took approximately
one hour and 40 minutes to complete.

 Figure 1.5. Highway route.

 6
1.3.2 Rural Route

The rural route (Figure 1.6) was composed of single-lane-per-direction-of-travel roads, that had
signed or signalized intersections. Unlike the highway route, some of the rural route roadways
had undulations, hills, and sharp corners. This route:

 • Started on S.R. 347 at the TRC entrance (heading east);
 • Headed north on County Road 222;
 • Continued to S.R. 31;
 • Headed west on S.R. 47;
 • Went south on S.R. 292; and
 • Ended on S.R. 347 at the TRC entrance.

The rural route, 32.4 miles long and under normal traffic conditions, took approximately 45
minutes to complete.

 Figure 1.6. Rural route.

1.3.3 Mixed Route

The mixed route (Figure 1.7) consisted of highway, rural, and residential roads. This route:

 • Began heading west on S.R. 347 from the TRC entrance;
 • Turned south on US 33;
 • Exited left onto US 36 toward the city of Delaware, Ohio;

 7
• Went west on S.R. 37;
 • Continued onto S.R. 347; and
 • Ended on S.R. 347 at the TRC entrance.

The different roadway types on the mixed route and their corresponding distances are listed in
Table 1.2. The mixed route, 63.1 miles long and under normal traffic conditions, took
approximately one hour and 17 minutes to complete.

 Figure 1.7. Mixed route.

 Table 1.2. Mixed Route Roadway Types and Distances
 Environment Distance (miles)
 Freeway 16.1
 Rural 41.1
 Residential 5.9
 Total 63.1

1.4 Vehicle Drives Matrix

It was initially intended to drive each vehicle 15 times on each route. However, the number of
times the vehicles were actually driven on a given route (Table 1.3) was often less.

 Table 1.3. Vehicle Drives Matrix
 Highway Route Rural Route Mixed Route
 Vehicle
 No. Miles No. Miles No. Miles
 Cadillac CT6 15 1,620 - - - -
 Nissan Leaf 15 1,620 3 97.2 15 946.5
 Lexus LS500 5 540 3 97.2 5 315.5

 8
• The Cadillac CT6 was only tested on the highway route since Super Cruise was not
 available (i.e., not able to be enabled or put into operation) on the rural route and for most
 of the mixed route.

 • For two reasons, testing on the rural route was limited to three exploratory drives with the
 Nissan Leaf and the Lexus LS500. First, the time where the respective level 2 driving
 automation system could be enabled and put into operation was limited (recall that the
 roads associated with this route were outside of the vehicles’ stated ODDs). Second,
 when level 2 driving automation systems were in operation, a relatively high number of
 the events described in Chapter 2 were observed. Completing 15 rural route drives per
 vehicle would therefore have imposed an unnecessarily high data processing burden.

 • The Lexus LS500 was limited to five drives on the highway and mixed routes to reduce
 the high data processing burden imposed by the relatively high number of the events
 described in Chapter 2.

1.5 Instrumentation

Two Waylens Horizon cameras were used to capture video, inertial, and GPS data during testing.
The cameras were equipped with a 3-axis accelerometer, a 3-axis magnetometer, and a 3-axis
solid state gyroscope. The cameras record GPS data at 10 Hz and video with a resolution of
1080p at 60 frames per second. One camera was mounted over the driver’s shoulder to record
their driving actions, and the second camera was mounted on the wind shield to record a front-
facing view outside of the vehicle.

 9
2 EVENT OCCURANCE AND PREVAILING ENVIRONMENTAL AND ROAD
 CONDITIONS

This chapter defines and describes the driving events that occurred while attentive professional
drivers were operating each vehicle in level 2 driving automation. The environmental conditions
at the time the events were also observed, were recorded, reviewed, and classified.

Note: The events observed, and the prevailing environmental and road conditions, are reported
as they were encountered. Testing was not designed or intended to normalize for exposure to the
various environmental and road conditions. As an example, no attempt was made to have a
similar number of drives in wet and dry conditions; it was only noted if the roadway was wet or
dry when an event occurred.

2.1 Event Classification

While operating the vehicles in level 2 driving automation, the drivers, who were professional
experimenters and/or test drivers, held their hands just above or lightly touched the respective
steering wheels until a noteworthy “event” occurred, at which time they would typically place
their hands back on the steering wheel, push a steering wheel-mounted button to flag the event in
the drive video, and briefly annotate the driving situation. Later, during post-processing at
VRTC, the drivers reviewed their respective videos and subjectively 5 classified their flagged
events into one of three categories, Type I, Type II, or Type III.

Type I events occurred when the system, during otherwise normal driving, (1) suddenly
terminated its level 2 driving automation system operation; (2) issued a takeover notification to
the driver; and (3) transferred full control back to the driver. This required the driver to
immediately respond by resuming manual control of the vehicle. The takeover prompts may be
composed of any combination of auditory, visual, and/or haptic modality. To be classified as a
Type I takeover event, it was required that the vehicle was being driven in level 2 driving
automation, and that the system was performing the driving task in a manner free from
anomalous behavior until the transfer of control occurred.

Type II events occurred when the level 2 driving automation system exhibited some form of
subjectively noteworthy operation, but not to the point where the driver believed it was necessary
to manually override the system to regain full control of the vehicle. At the time of the Type II
event, the level 2 driving automation system was actively providing lateral and longitudinal
control of the vehicle without issuing an alert or warning to the driver.

A driving situation where the level 2 driving automation system biased the vehicle’s lane
position very near the roadway center line separating the driver’s vehicle from oncoming traffic
is an example of a Type II event referred to as “lane hugging.” Another example occurred when
the level 2 driving automation system repeatedly steered the vehicle to the left and right of the
lane center while being driven in a curve, which can cause the vehicle to wander back and forth
about the center of the lane. In this report, this phenomenon is referred to as “dithering in lane.”

5
 To remove as much ambiguity from this process as possible, the drivers each received a common set of Type I, II,
and III event definitions and examples of how sample driving events should be classified before post-processing began.

 10
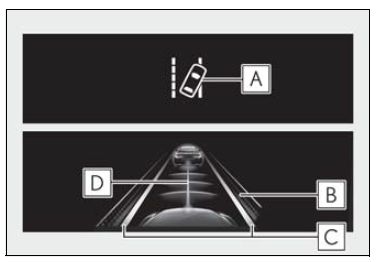
Type III events were broken down into two sub-categories: “driver intervention events” and
“lane departure with automatic centering events.”

 • Type III driver intervention events occurred during driving situations where the driver,
 believing the vehicle was unable to automatically perform the driving task any further,
 performed an override input to immediately disengage the system and resume full manual
 control. Transfer of control from the vehicle back to the driver always occurred after the
 override input during a Type III driver intervention event. The driver override inputs used
 during a Type III driver intervention event could be any combination of steering or
 braking, which are described as lateral and longitudinal interventions, respectively.

 • Type III lane departure with automatic centering events occurred when the vehicle,
 while operating in level 2 driving automation without traffic in an adjacently lane,
 breached a lane boundary but then automatically (i.e., without any intervention from the
 driver) returned back toward the center of the original travel lane.

The key difference between the initial conditions of the two Type III event sub-categories had to
do with whether other vehicles were present or approaching the test vehicle. If so, the driver was
instructed to prevent the vehicle from entering the adjacent lane, and the event was classified as a
Type III driver intervention event. If not, and if the driver believed if the unintended lane change
into an adjacent lane would not affect other traffic present on the roadway, the driver used the
opportunity to let the event “play out” to assess if or how their vehicle was able to recover from
the unintentional (i.e., vehicle-induced) lane departure, and classified the event as a Type III lane
departure with automatic centering event.

The events, along with the prevailing road and environmental conditions when they occurred,
were catalogued for each vehicle. The events were then statistically analyzed, and then
summarized.

2.2 Environment Classification

The environmental conditions prevailing during each event were recorded and classified into
three broad categories: roadway type, roadway condition, and lane line condition.

Roadway type:

Two special roadway types were classified (entry/exit ramp and merge lane), while all other
roadways were considered “normal.”

 Entry/Exit Ramp: Highway entry and exit ramps can have sharp curves, high banking,
 and steep grades. These conditions pose challenges to the vehicles operating in level 2
 driving automation. 6 If the event occurred on an entry/exit ramp, it was classified as
 such).

6
 Although they were outside of the stated ODD for the vehicles described in this report, at times it was possible to
engage the Lexus LS500 and Nissan Leaf level 2 driving automation system while driving on entrance and exit ramps.

 11
Merge Lane: When two lanes merge or split, the lane lines on the merge side disappear
 for a short distance, and the effective lane width increases as a result. It was observed that
 such a situation can pose problems for vehicles operating in level 2 driving automation,
 and hence the category is of interest.

Roadway condition:

Roadway conditions were classified subjectively by reviewing the video of the event.

 Wet/Dry: It is noted whether the event occurred on wet or dry road.
 Straight/Curved: It is noted whether the event occurred on straight or curved road
 segment.
 Flat/Not Flat: It is noted whether the event occurred on a flat or sloped road segment.

Lane line condition:

Lane line condition was classified by subjective review of the test video. Since the level 2
driving automation systems described in this report depend heavily on lane lines to provide the
information needed for them to help keep the vehicle centered within the lane, it is noted whether
the lane lines are good, degraded, or missing when an event occurs.

2.3 Cadillac CT6 Performance

The Cadillac CT6 was only tested on the highway route since the Super Cruise was not available
on some or all of the roads included within the rural and mixed routes. This section describes the
performance of the Cadillac on the highway route.

2.3.1 Cadillac CT6 Super Cruise Availability Analysis

A side-by-side comparison of most of the highway route and the corresponding Super Cruise
availability map (at the time of testing) is shown in Figure 2.1. It is evident from this
comparison that Super Cruise was not available for a portion of the designed route. During
testing, it was noticed that the system was not available to be engaged during other portions of
the drive as well. This section discusses the statistics pertaining to Super Cruise availability over
the 15 drives performed on the highway route.

 12
a) Highway route section b) Super Cruise availability map
 Figure 2.1. Comparison of highway route and Super Cruise availability map.

From the availability map, the distance for which Super Cruise was not expected to be available
on the highway route (circled in red in Figure 2.1b) was calculated to be 4.25 miles. The number
of miles and percentage of the drive for which Super Cruise was actually unavailable for each
test drive was calculated using Equation 1. Since the Cadillac CT6 was out of its ODD for 4.25
miles during the test route, this was subtracted to calculate the net miles unavailable, and
percentage net miles unavailable using Equation 2.

% = × 100 …. (1)
 (108 )

 −4.25
% = × 100 …. (2)
 −4.25

The Super Cruise unavailability statistics for each of the 15 drives is shown in Table 2.1. The
plot of the net miles unavailable is shown in Figure 2.2. During testing, a map update was
pushed to the Cadillac CT6 after drive number 9. Table 2.1 illustrates that the net Super Cruise
unavailability was consistently below 20 percent for the drives after the map update.

 13
Table 2.1. Super Cruise Unavailability Statistics for Each Drive
 Drive Total Miles Total % Miles Net Miles % Net Miles
 No. Unavailable Unavailable Unavailable Unavailable
 1 27.5 25.5% 23.3 22.4%
 2 28.6 26.5% 24.3 23.5%
 3 35.9 33.2% 31.7 30.5%
 4 35.1 32.5% 30.8 29.7%
 5 34.2 31.7% 29.9 28.9%
 6 38.7 35.8% 34.4 33.2%
 7 30.9 28.6% 26.6 25.7%
 8 29.5 27.3% 25.2 24.3%
 9 47.9 44.3% 43.6 42.0%
 10 23.3 21.6% 19.1 18.4%
 11 21.2 19.7% 17.0 16.4%
 12 22.4 20.7% 18.2 17.5%
 13 23.3 21.6% 19.1 18.4%
 14 20.7 19.2% 16.5 15.9%
 15 20.3 18.8% 16.0 15.5%
 Total 439.5 27.1% 375.7 24.1%

 Figure 2.2. Net miles of Super Cruise unavailability

Of the 1,620 total nominal miles driven on the highway route, Super Cruise was available and
active for a total of 1,180.5 miles. Of the 1,620 miles, the system was geofenced out for 63.75
miles, and the overall percentage of the net miles unavailable was 24.1 percent. It is important to
highlight that, for the 6 drives after the map update, net Super Cruise unavailability averaged
18.0 percent, which was an improvement of 6.1 percent over the overall average.

2.3.2 Cadillac CT6 – Highway Route Performance

Super Cruise was operational for 1,180.5 of the 1,620 total miles driven with the Cadillac CT6,
during which time a total of 304 events were recorded. These events included 268 Type I events,
28 Type II events, and 8 Type III events (Table 2.2).

 14
Table 2.2. Cadillac CT6 Highway Route Event Categories Breakdown
 Event Category Number
 Type I 268
 Type II 28
 Type III 8
 Total 304

The Type I event distribution over the various environmental conditions for the Cadillac CT6
highway drives is presented in Table 2.3. The percentage of the total number of Type I events is
also presented. As noted previously, the drives were not designed to normalize for exposure to
the various environmental and road conditions.

 Table 2.3. Cadillac CT6 Highway Drive Type I Event Results

 Total Type I Events 268
 Exit Ramp 28 10.4%
 Roadway Type Merge Lane 33 12.3%
 Normal 207 77.2%
 Dry 264 98.5%
 Wet 4 1.5%
 Straight 205 76.5%
 Road Condition
 Curved 63 23.5%
 Flat 249 92.9%
 Not Flat 18 6.7%
 Good 247 92.2%
 Lane Line
 Degraded 14 5.2%
 Condition
 Missing 4 1.5%

During the 15 drives, the Cadillac CT6 presented a total of 268 Type I events. There were 10.4
percent of these events that occurred on exit ramps 7 while another 12.3 percent occurred on
merge lanes. The remaining occurred on normal highway roads. There were 98.5 percent of the
Type I events that happened in dry conditions, while the remaining 1.5 percent occurred in wet
conditions. There were 76.5 percent of the Type I events that occurred on straight road segments
and the remaining 23.5 percent occurred on curved road segments. 92.9 percent of the Type I
events occurred on flat roads. There were 92.2 percent of all the Type I events that occurred
when clear lane lines were present, 5.2 percent of the events occurred while the lane lines were
degraded, and only 1.5 percent of the events occurred when one or both lane lines were missing.

7
 Although exit and on ramps are outside the ODD of Super Cruse, the system stayed active long enough on certain
exit ramps where these events occurred.

 15
The Type II event distribution over the various environmental conditions for the Cadillac CT6
highway drives is presented in Table 2.4. During the 15 highway drives, the Cadillac CT6 had
28 total Type II events. Dithering in lane accounted for 64.3 percent of all the Type II events, 1
occurrence (3.6 percent) of lane hugging was recorded, while the remaining 32.1 percent were
miscellaneous Type II events that included, but were not limited to, Super Cruise not recognizing
the posted speed limit, being available but driver unable to engage it, and/or having issues with
glare on the driver attention monitoring camera and the driver wearing sunglasses.

 Table 2.4. Cadillac CT6 Highway Drive Type II Event Results

 Total Type II Events 28
 Dithering in Lane 18 64.3%
 Event Description Lane Hugging 1 3.6%
 Other 9 32.1%
 Exit Ramp 1 3.6%
 Roadway Type Merge Lane 9 32.1%
 Normal 18 64.3%
 Dry 28 100.0%
 Wet 0 0.0%
 Straight 12 42.9%
 Road Condition
 Curved 16 57.1%
 Flat 23 82.1%
 Not Flat 5 17.9%
 Good 24 85.7%
 Lane Line
 Degraded 3 10.7%
 Condition
 Missing 1 3.6%

Of the 28 total Type II events, 32.1 percent occurred in a merge lane, while 1 (3.6 percent) event
occurred on an exit ramp. All the Type II events were recorded in dry road conditions. There
were 42.9 percent of the Type II events that occurred on straight road segments and the
remaining 57.1 percent occurred on curved road segments. There were 82.1 percent of the Type
II events that occurred on flat roads and the remaining 17.9 percent of the events occurred on
roads that are not flat. There were 85.7 percent of the Type II events that occurred while clear
lane lines were present, 10.7 percent of the events occurred while the lane lines were degraded,
and 3.6 percent of the events occurred when one or both lane lines were missing.

The Type III event distribution over the various environmental conditions for the Cadillac CT6
highway drives is presented in Table 2.5. Due to the small sample size of events, the percentages
are only displayed to maintain consistency throughout this document but are not discussed.

 16
Table 2.5. Cadillac CT6 Highway Drive Type III Event Results

 Total Type III Events 8
 Lane Departure w/
 1 12.5%
 Auto Centering
 Event Description Lateral Intervention 6 75.0%
 Longitudinal
 1 12.5%
 Intervention
 Exit Ramp 2 25.0%
 Roadway Type Merge Lane 1 12.5%
 Normal 5 62.5%
 Dry 8 100.0%
 Wet 0 0.0%
 Straight 5 62.5%
 Road Condition
 Curved 3 37.5%
 Flat 7 87.5%
 Not Flat 1 12.5%
 Good 4 50.0%
 Lane Line
 Degraded 2 25.0%
 Condition
 Missing 2 25.0%

In the 15 drives on the highway route, the Cadillac CT6 had 8 Type III events, which included 1
lane departure where the system re-centered the vehicle, 6 incidents where the driver had to
intervene using the steering wheel (lateral intervention) and 1 instance where the driver had to
apply the brakes (longitudinal intervention). Of the 8 Type III events, 2 occurred on highway
exit/on ramps, while 1 event occurred on a merge lane. All 8 Type III events occurred in dry
conditions. Five of the 8 Type III events occurred on straight sections of road. Seven of the 8
Type III events occurred on flat roads. Four Type III events occurred on good lane line
conditions while 2 occurred when lane lines were degraded, and a further 2 occurred when lane
lines were missing on one or both sides.

2.4 Nissan Leaf Performance

The Nissan Leaf was tested on all three routes: highway, rural, and mixed. Results for each route
are described in the following sections.

2.4.1 Nissan Leaf – Highway Route Performance

The Nissan Leaf was driven 15 times on the highway route for a nominal total of 1,620 miles. A
total of 448 events were recorded. These events included 211 Type III events, 171 Type I events,
and 66 Type II events (Table 2.6).

 17
Table 2.6. Nissan Leaf Highway Route Event Types Breakdown
 Event Category Number
 Type I 171
 Type II 66
 Type III 211
 Total 448

The Type I event distribution over the various environmental conditions for the Nissan Leaf
highway drives is presented in Table 2.7.

 Table 2.7. Nissan Leaf Highway Route Type I Event Results

 Total Type I Events 171
 Exit Ramp 70 40.9%
 Roadway Type Merge Lane 101 59.1%
 Normal 0 0.0%
 Dry 148 86.5%
 Wet 23 13.5%
 Straight 92 53.8%
 Road Condition
 Curved 79 46.2%
 Flat 110 64.3%
 Not Flat 61 35.7%
 Good 155 90.6%
 Lane Line
 Degraded 10 5.8%
 Condition
 Missing 6 3.5%

Of the 171 Type I events, 40.9 percent occurred on exit ramps while another 59.1 percent
occurred on merge lanes, with none occurring on normal highway roads. There were 865 percent
of the Type I events that happened in dry conditions, while the remaining 13.5 percent occurred
in wet conditions. 53.8 percent of the Type I events occurred on straight road segments and the
remaining 46.2 percent occurred on curved road segments. There were 64.3 percent of the Type I
events that occurred on flat roads (35.7 percent on not flat roads). There were 90.6 percent of all
the Type I events that occurred when clear lane lines were present, 5.8 percent of the events
occurred while the lane lines were degraded, and only 3.5 percent of the events occurred when
one or both lane lines were missing.

The Type II event distribution over the various environmental conditions is presented in Table
2.8 for the Nissan Leaf highway route drives. Of the 66 total Type II events, dithering in lane
accounted for 47.0 percent. There were 53.0 percent were miscellaneous Type II events that
included, but were not limited to, false lane departure warnings, ProPILOT not disengaging
despite large input from driver, driver attention warning disappearing before driver touched the
steering, etc. No lane line hugging events were recorded.

 18
Table 2.8. Nissan Leaf Highway Route Type II Event Results

 Total Type II Events 66
 Dithering in Lane 31 47.0%
 Event Sub-type Lane Hugging 0 0.0%
 Other 35 53.0%
 Exit Ramp 21 31.8%
 Roadway Type Merge Lane 37 56.1%
 Normal 8 12.1%
 Dry 62 93.9%
 Wet 4 6.1%
 Straight 42 63.6%
 Road Condition
 Curved 24 36.4%
 Flat 44 66.7%
 Not Flat 22 33.3%
 Good 60 90.9%
 Lane Line
 Degraded 5 7.6%
 Condition
 Missing 1 1.5%

There were 31.8 percent of the Type II events that occurred on an exit ramp, while 56.1 percent
occurred on a merge lane. There were 93.9 percent of the Type II events that occurred in dry
road conditions. There were 63.6 percent of the Type II events that occurred on straight road
segments and the remaining 36.4 percent occurred on curved road segments. There were 66.7
percent of the Type II events that occurred on flat roads and the remaining 33.3 percent of the
events occurred on roads that were not flat. There were 90.9 percent of the Type II events that
occurred while clear lane lines were present, 7.6 percent of the events occurred while the lane
lines were degraded, and 1.5 percent of the events occurred when one or both lane lines were
missing.

The Type III event distribution over the various environmental conditions for the Nissan Leaf
highway route drives is presented in Table 2.9. Of the 211 Type III events recorded on the
Nissan Leaf, 68.2 percent of the events were lane departure where the system re-centered the
vehicle, 28.9 percent of the incidents involved driver lateral intervention, and the remaining 2.8
percent of the incidents involved a driver longitudinal intervention.

There were 31.3 percent of the Type III events that occurred on exit ramps while another 34.1
percent occurred on merge lanes. The remaining 34.6 percent occurred on normal highway roads.
There were 81.5 percent of the Type III events that occurred in dry conditions, while the
remaining 18.5 percent occurred in wet conditions. There were 51.2 percent of the Type III
events that occurred on straight road segments and the remaining 48.8 percent occurred on
curved road segments. There were 67.8 percent of the Type III events that occurred on flat roads

 19
(32.2 percent on not flat roads). There were 84.8 percent of all the Type III events that occurred
when clear lane lines were present, 12.3 percent of the events occurred while the lane lines were
degraded, and 2.8 percent of the events occurred when one or both lane lines were missing.

 Table 2.9. Nissan Leaf Highway Route Type III Event Results

 Total Type III Events 211
 Lane Departure
 144 68.2%
 w/ Auto Centering
 Event Sub-type Lateral Intervention 61 28.9%
 Longitudinal
 6 2.8%
 Intervention
 Exit Ramp 66 31.3%
 Roadway Type Merge Lane 72 34.1%
 Normal 73 34.6%
 Dry 172 81.5%
 Wet 39 18.5%
 Straight 108 51.2%
 Road Condition
 Curved 103 48.8%
 Flat 143 67.8%
 Not Flat 68 32.2%
 Good 179 84.8%
 Lane Line
 Degraded 26 12.3%
 Condition
 Missing 6 2.8%

2.4.2 Nissan Leaf – Rural Route Performance

The rural route was outside of the Nissan Leaf ODD (according to the user manual), so there
were only three exploratory drives of this route for a total of 97 miles. A total of 41 events
(Table 2.10) were recorded which included 15 Type III events, 23 Type I events, and 3 Type II
events. The three categories of events are further categorized, and the results presented in this
section.
 Table 2.10. Nissan Leaf Rural Route Event Categories Breakdown
 Event Category Number
 Type I 23
 Type II 3
 Type III 15
 Total 41

 20
You can also read