Climate and Water Resources Summary for the Wellington Region - Warm Season (November to April) 2018-2019 Release date: 16 May 2019 - Greater ...
←
→
Page content transcription
If your browser does not render page correctly, please read the page content below
Climate and Water Resources Summary for the
             Wellington Region
   Warm Season (November to April) 2018-2019
          Release date: 16 May 2019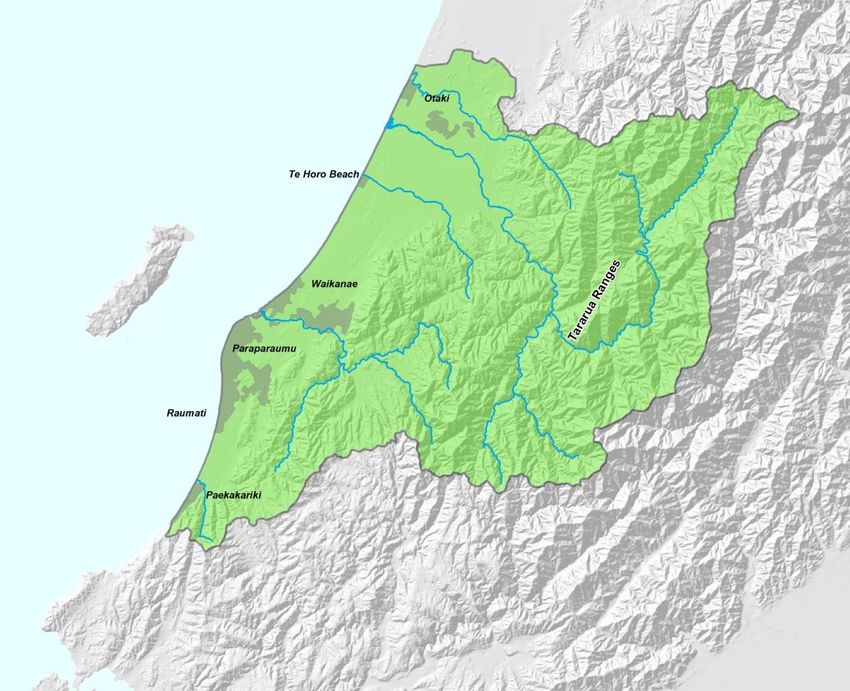
Contents

Sea Surface temperature anomalies showing above normal water temperatures in red, and below
normal water temperatures in blue. A marine heatwave is shown by the large red areas in the Tasman
Sea, and around New Zealand. We can see the conditions on the 1st Jan 2018 when New Zealand
had the hottest summer on record (left), in comparison to the same day this year (right). As the
comparison shows, a similar marine heatwave prevailed for the second consecutive year. Marine
heatwaves have a direct impact on the weather patterns affecting our region, providing warmer
temperatures and additional energy for storms and floods (refer to global climate drivers discussion
chapter in this report). Source: NIWA.

In this report you will find:
                                              Regional overview
                                              Global climate drivers
                                              Outlook update
                                              Whaitua summaries
                                              Summary tables and graphs

More information
For more information on monitoring sites and up-to-date data please visit http://www.gw.govt.nz/environmental-science/.
Several climate sites are operated by NIWA and/or MetService, and GWRC is grateful for permission to present the data in
this report.

Disclaimer
This report has been prepared by Environmental Science staff of Greater Wellington Regional Council (GWRC) and as such does not constitute Council policy.

In preparing this report, the authors have used the best currently available data and have exercised all reasonable skill and care in presenting and interpreting
these data. Nevertheless, GWRC does not accept any liability, whether direct, indirect, or consequential, arising out of the provision of the data and associated
information within this report. Furthermore, as GWRC endeavours to continuously improve data quality, amendments to data included in, or used in the
preparation of, this report may occur without notice at any time. GWRC requests that if excerpts or inferences are drawn from this report for further use, due
care should be taken to ensure the appropriate context is preserved and is accurately reflected and referenced in subsequent written or verbal communications.

Any use of the data and information enclosed in this report, for example, by inclusion in a subsequent report or media release, should be accompanied by an
acknowledgement of the source.
Report release date: Nov 2018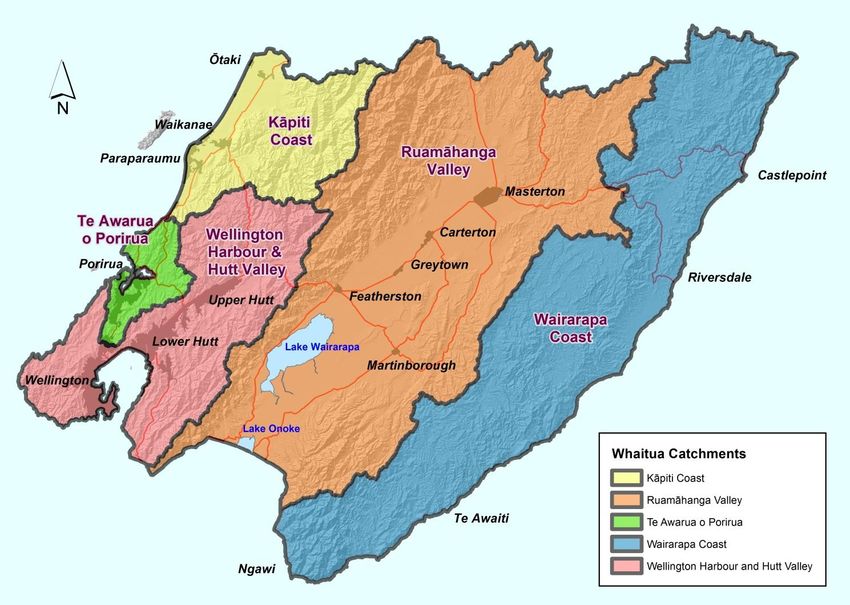
Regional overview                                                   Warm Season 2018/19

Total rainfall over the warm season from November 2018 to April 2019 was higher than normal in
most places. However, a closer look into the rainfall patterns (see next page) shows that the rainfall
anomaly varied widely from month to month.

Rainfall (November to April)
The map to the right shows rainfall
recorded during the entire
November 2018 to April 2019
period as a percentage of the
long term average.

Total seasonal rainfall
was higher than average
across most of the
region, including the
Wairarapa, Hutt
Valley and
Wellington area.
The Tararua
Range and
Kapiti Coast were
around normal.
                                                                                 November 2018 to April 2019
However, individual monthly totals                            total recorded rainfall as a percentage
                                                              of the long-term average rainfall
show some big contrasts (see the
following page for monthly rainfall
percentage maps). For example, the
Wairarapa was exceedingly wet in November and December and then exceptionally dry in January
and March.

Analysis of the number of days that it rained is interesting. If more than 1mm of rain is recorded in a
day this is called a ‘Rain Day’ and if there is more than 25mm this is termed a ‘Heavy Rain Day’.

The table below shows that the number of Rain Days was lower than normal everywhere. However,
the number of Heavy Rain Days in lowland areas was higher than normal everywhere except the
Kapiti Coast (and is probably the main driver of the overall pattern of seasonal rainfall totals).

Number of Rain Days and Heavy Rain Days during November to May across the region (long-term average in brackets.)

                                  Kāpiti Coast       Porirua     Hutt Valley &           Ruamāhanga             Eastern
                                                                  Wellington                                   Wairarapa

                              Lowland      Hills     Lowland Lowland      Hills      Lowland        Hills

 Rain Days (>1mm)              48 [70]    86 [104]   47 [66]   45 [69]   72 [96]      54 [66]     90 [115]      55 [69]
 Heavy Rain Days(>25mm)         3 [3]     20 [24]     7 [5]     6 [5]    11 [13]       6 [3]      23 [34]        7 [5]

                                                                                                                PAGE 1 OF 22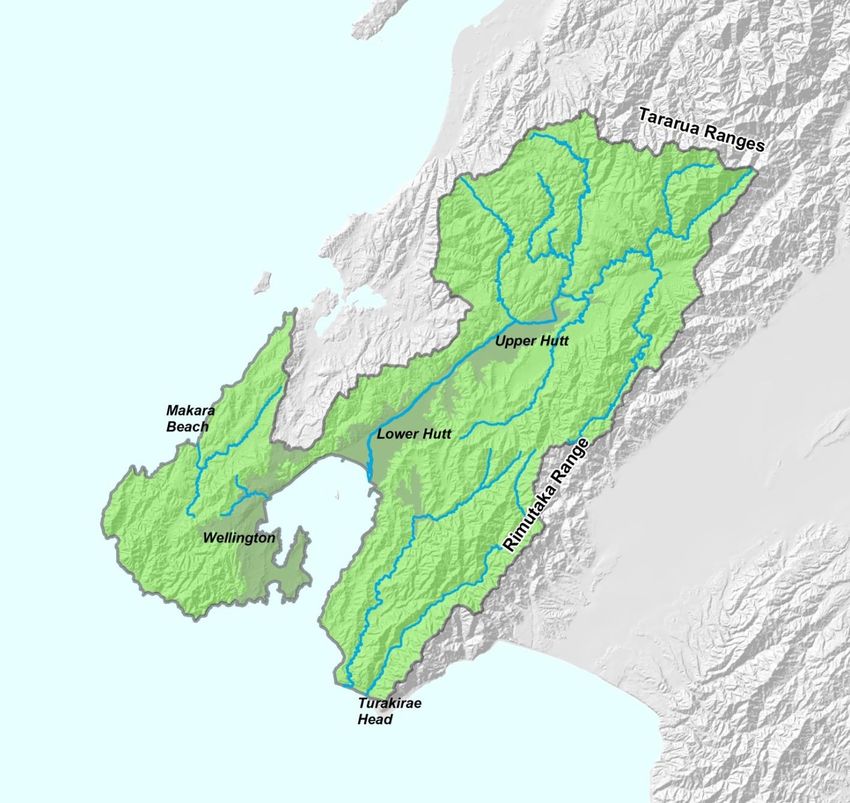
Regional overview                                          Warm Season 2018/19

Rainfall by the month
The maps below show monthly rainfall as a percentage of average for each month of the warm
season (November 2018 to April 2019). The contrast between the shoulder months of the season
(Nov, Dec, Apr) and mid-summer months is clear to see. The pattern of extreme fluctuations from wet
to dry in the Wairarapa, especially in the eastern hills, is one that has been highlighted in past
seasonal reports.

November

                                                                                 December

 January

                                                                                 February

 March

                                                                                 April

                    Monthly rainfall as a percentage of the long-term average

                                                                                          PAGE 2 OF 22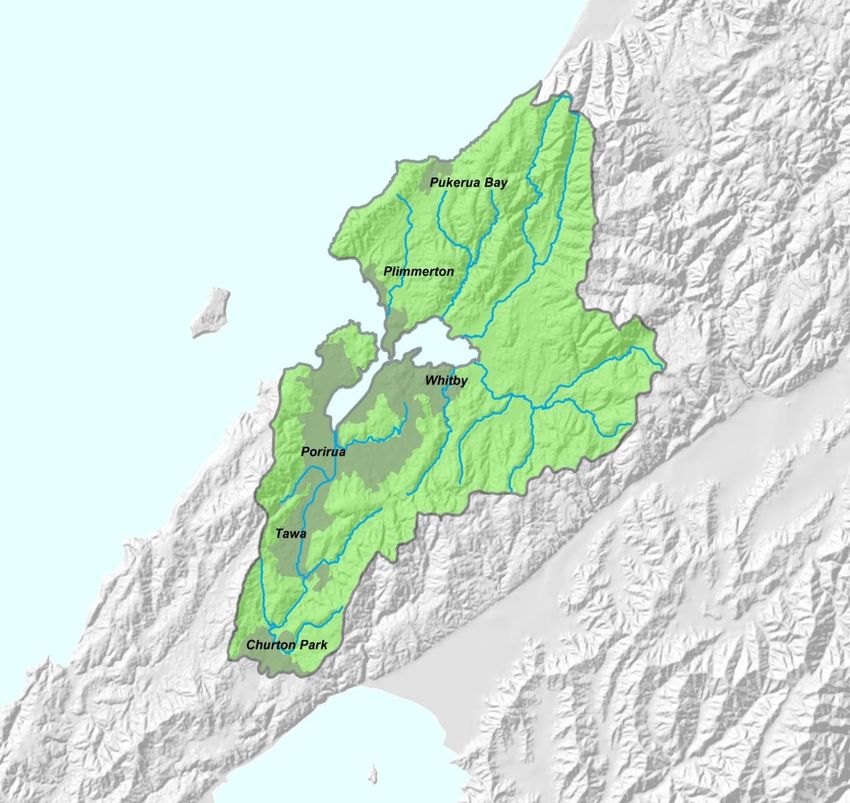
Regional overview                                          Warm Season 2018/19

River flow
The map below shows the average river and stream flow conditions between November 2018 and
April 2019, for various monitored catchments, as a percentage of the long-term average flow over this
period.

The general pattern was one of lower than average flows in the west and in the larger catchments fed
primarily by the Tararua Range, and near average to above average flows in the south and east and
foothill or lowland catchments. The largest flow anomaly was for the Pahaoa River catchment in the
eastern Wairarapa hill country where average flow was almost twice (188%) the long-run normal for
the warm season. This statistic was driven by an exceptionally wet November and December in
eastern Wairarapa; average flow in the Pahaoa River for these months was more than five and eight
times the respective norms. Interestingly, January and February were exceptionally dry for this
catchment with flow less than 15% of the normal.

More detail on river flow statistics for each catchment can be found in the Appendix of this report on
page 18.

                                                                                             PAGE 3 OF 22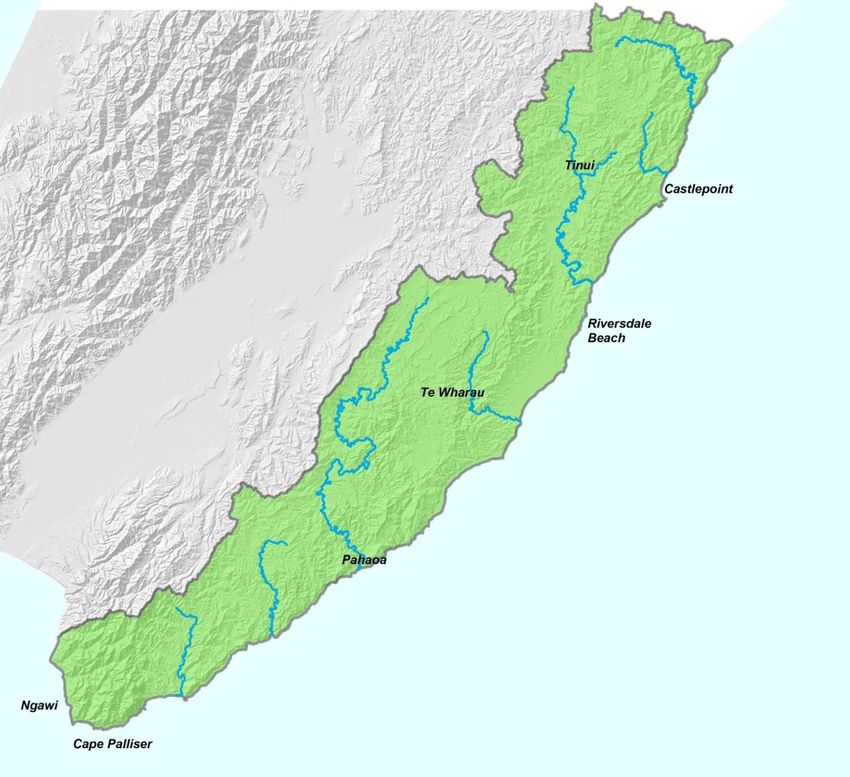
Regional overview                                                    Warm Season 2018/19

Air temperatures
Air temperature is measured at a number of meteorological monitoring sites across the region. It is
useful to look at the anomalies (i.e., departures from normal) in average temperatures month by
month, in order to understand the climate anomalies.

The graphs below show the monthly average daytime maximum and average nighttime minimum
temperature anomalies (i.e., based on every day of the month) for Kelburn (upper panel) and
Masterton (lower panel). We can see that the warm season overall was much warmer than normal,
except for April which had below average daytime temperatures. Masterton had cold nights in
February likely as a result of dry conditions, as the soil moisture decreased after record low rainfall in
January. On the 29th of January Kelburn had the hottest temperature ever measured on that site (for
all months), with 30.3oC (see global climate drivers and extreme weather events section below for
further comments). In Kelburn, records started in 1927.

     Average daytime and nighttime temperature anomalies for Kelburn (top) and Masterton (bottom) for the warm
     season period. Most of the period has been warmer than average, except April. In Masterton, there has been a
     predominance of cold nights in February, likely due to clear skies and dry conditions.

     SOURCE: Data from MetService meteorological stations.
                                                                                                             PAGE 4 OF 22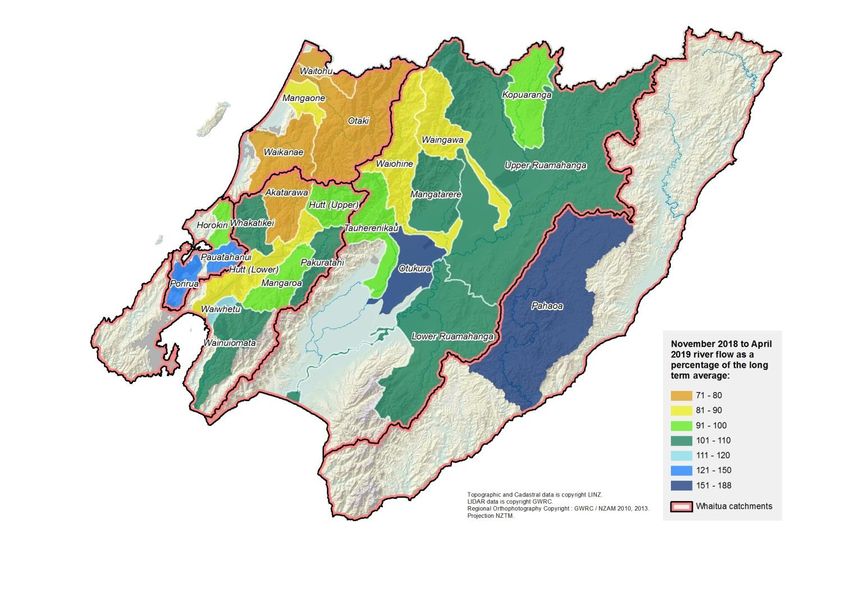
Regional overview Warm Season 2018/19
Global climate drivers
Climate variability and climate change
People often ask if the variable weather patterns in our region are a result of climate change. While
natural climate variability has always been quite pronounced in our region, weather extremes are
expected to get extremer as a result of human-induced climate change and “global warming” caused
by greenhouse gas emissions (http://www.gw.govt.nz/climate-change/). This means that the
imbalance in the atmosphere is growing (http://www.gw.govt.nz/assets/Climate-change-
2/PresentationPezza27March2019.pdf.)
Some key observations about climate variability and change in our region during the period
November 2018 to April 2019 are:
The six-month period was warmer than normal, with large variability in month to
month rainfall anomalies (e.g. three times the average rainfall in December, followed
by record dry in January);
The sea surface temperatures (following page) have gone once again from average
to much warmer than average over summer, characterising the second consecutive
warm season dominated by marine heatwave conditions;
High pressure anomalies east of New Zealand, associated with the positive phase of
the Southern Annular Mode, helped produce stronger onshore winds on the eastern
coast. The synoptic patterns were very mixed, oscillating between westerlies and
easterlies;
Global climate data for 2018 reveals that the global oceans continue to warm in the
upper 2000 m layer, with 2018 being the hottest year on record for this parameter.
Deep layer measurements of oceanic heat content are one of the most reliable ‘global
warming’ indicators available, due to the high stability of the oceanic system.
Change in 0-2000m Ocean Heat Content from 1958 to 2018. Each bar shows the annual mean relative to a 1981-
2010 baseline (positive in red and negative in blue). Source: IAP ocean analysis, Cheng et al. 2019.
PAGE 5 OF 22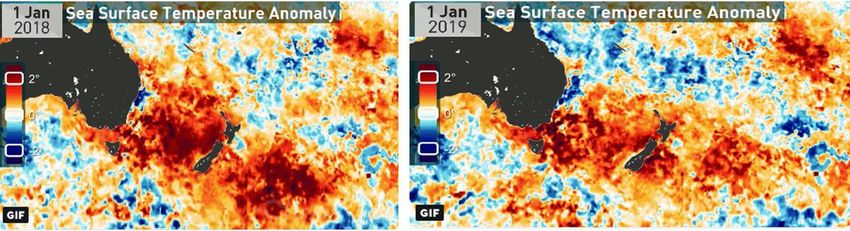
Whaitua summaries                                                        Warm Season 2018/19

Global climate drivers and extreme weather events

Climate drivers are global mechanisms that can influence the weather in our region. The El
Niño/Southern Oscillation1 (ENSO) phenomenon is currently experiencing a weak El Niño phase
(depending on which threshold is being used to define it). This is seen by the warm sea surface
temperature anomalies in the Equatorial Pacific throughout the season. The sea ice extent (in white)
has been well below average, and is currently at similar levels to what was observed last year
(bottom panel). In the Northern Hemisphere, sea ice has been significantly declining and this has
been shown to be connected to an imbalance leading to more extreme weather events. This
includes, paradoxically, the recent severe cold waves on the eastern US coast (due to the
weakening and meandering of the polar jet stream).

The marine heat wave around New Zealand is seen at the end of the season (as of 29 April) on the
right panel. This warm water pattern provides more energy for severe weather events, and a
sustained backdrop for unseasonably mild temperatures.

      Sea surface temperature anomalies on 1stNov 2018 (left), and 29th Apr 2019 (right). We can see that the equatorial
      Pacific remains warmer than average, in a weak El Niño state. The waters remain warmer than normal around and
      east of New Zealand, after a cooler pattern early in the season gave way to marine heatwave conditions (see
      contents page). Source: NOAA/USA.

                                                        Sea ice extent anomalies for 29 April
                                                        2019. The actual extent of the sea ice is
                                                        shown in white, compared to the 1981-
                                                        2010 average marked by the orange
                                                        line. While sea ice melting doesn’t
                                                        directly contribute to sea level rise,
                                                        recent research shows that Antarctica
                                                        will become severely vulnerable to
                                                        climatic changes if the sea ice coverage
                                                        that surrounds the continent starts to
                                                        decline.

                                                        Source: NSIDC (USA).

1   https://en.wikipedia.org/wiki/El_Ni%C3%B1o%E2%80%93Southern_Oscillation

                                                                                                                  PAGE 6 OF 22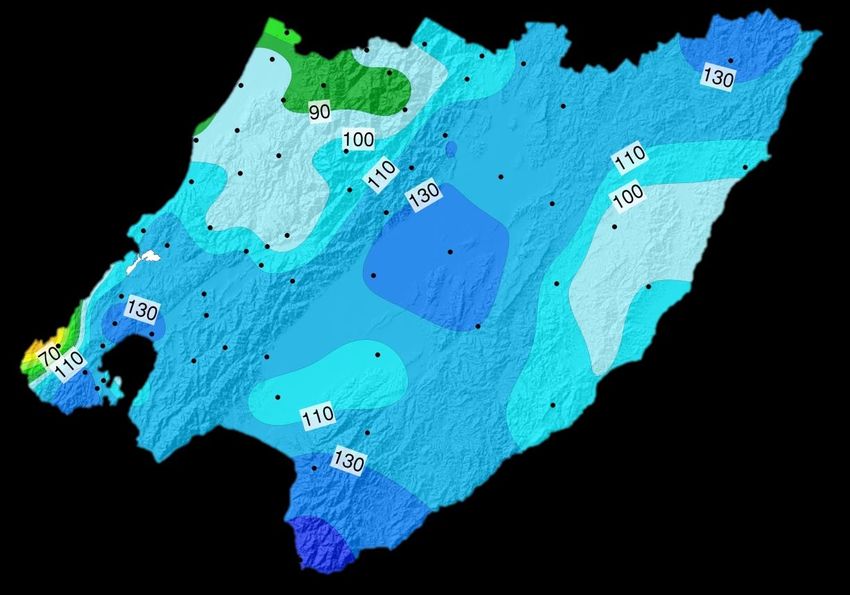
Whaitua summaries                                          Warm Season 2018/19

The pressure anomalies over the six month period show a series of low pressure centres around
Antarctica (marked as L), and a blocking high pressure east of New Zealand (marked as H). This
condition was connected to the positive phase of the Southern Annular Mode (SAM), helping bring
easterly winds on the eastern coast of the North Island. The wind regime was quite variable, which
helps explain the rainfall variability from month to month. The blocking high wasn’t strong enough to
prevent the westerlies and fronts to come through from the Tasman Sea, and so the intra-seasonal
regime has frequently oscillated between westerlies and easterlies, with an overall tendency for
lower than average wind speeds (or wind run) due to the position of the blocking.

                                                                    Mean sea level pressure anomaly for
                                                                    Nov to Apr 2018-2019.

                                                                    We can see that conditions were
                                                                    dominated by low pressure around
                                                                    Antarctica and high pressure east of
                                                                    New Zealand, which is characteristic of
                                                                    the positive phase of the Southern
                                                                    Annular Mode. The blocking high east of
                                                                    NZ meant a tendency towards stronger
                                                                    onshore winds on the eastern coast.

                                                                    Source: NOAA (USA).

Depending on the position of the blocking high shown above, there was an alternation between
conditions favourable for atmospheric heatwaves and periods of cooler weather. The strongest heat
wave of the season formed later in January, with 30.3oC on the 29th of January in Kelburn. This was
the highest temperature ever measured on that site for all months (records started in 1927). What is
more impressive about that record, is that the day started quite cool (overnight minimum of 16.6
degrees), taking a long time to warm up due to marine fog on coastal areas. If such a long-term
record can be broken even when conditions were not necessarily ideal for maximum heating, we
can be confident that even higher temperatures will be measured in future years, as climatic
changes continue to worsen.

Seasonal climate outlook update
The variable rainfall over the last six months is a pattern that has been persisting around the
Wellington Region for at least two years now. The warming of the oceanic temperatures around New
Zealand is injecting more energy into the atmosphere, creating stronger swings in weather patterns.
We have been consistently oscillating between very wet and very dry months, not infrequently with
the resultant seasonal accumulation being near average. As the marine heatwave is still ongoing
around New Zealand, this erratic pattern is expected to continue. At the same time, as the climate

                                                                                                 PAGE 7 OF 22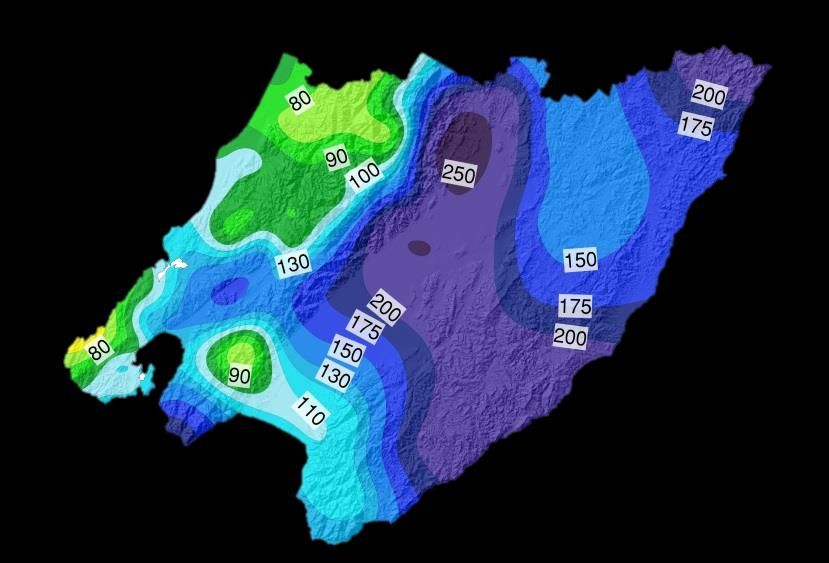
Whaitua summaries Warm Season 2018/19
imbalance associated with anthropogenic emissions continues to worsen, it is likely that this extreme
behaviour, or swings in weather extremes, could become the new norm.
The ENSO phenomenon is expected to remain borderline between neutral and weak El Niño before
returning to normal later in the year (see figure below). The sea surface temperature anomalies
around New Zealand are predicted to remain above normal, although not as strongly as they have
been during the warm season.
ENSO predictions as of 27 April 2019, showing that a currently weak El Niño (positive phase) is
expected to return to neutral conditions over the winter months. Source: BOM (Australia)
The following points summarise the expected pattern over the remaining of autumn, and beginning
of winter:
ENSO likely remaining borderline between El Niño and neutral;
Westerly regime likely becoming stronger;
Warm Sea Surface Temperature continues around New Zealand;
Normal to above average temperatures, large oscillations between extremes;
Highly variable month to month rainfall;
High chance of extreme rainfall events, with possible flooding, as the cold season
advances
The full updated climate outlook for winter will be released with our regular seasonal briefing by mid-
June.
PAGE 8 OF 22Whaitua summaries Warm Season 2018/19
What happened in each whaitua catchment?
Climate and water resource summaries are provided in the following sections for each of the five
Wellington region whaitua catchment areas (as shown below). The whaitua catchments provide an
important sub-regional basis for environmental management in the Wellington region2, and roughly
coincide with the different climate and water resource zones.
Click the following links for November 2018 to April 2019 summaries for:
Wellington Harbour and Hutt Valley
Te Awarua-o-Porirua
Kāpiti Coast
Ruamāhanga Valley
Wairarapa Coast
Map of the five whaitua catchment areas in the Wellington region. Each whaitua roughly coincides with a
climatic zone, expressing the marked east-to-west contrast that we experience in our region.
2 http://www.gw.govt.nz/whaitua-committees/
PAGE 9 OF 22Whaitua summaries Warm Season 2018/19
Wellington Harbour and Hutt Valley climate summary
Wetter (high total rainfall accumulation, but swinging between extremes monthly).
Warmer (well above average temperatures)
Hot nights:
Wellington Airport: 19.9C on
March 27th (equal second hottest
on record, data since 1972))
Fog:
Wellington Airport affected
by fog on 24 April
Very Wet: Flooding:
Three times the monthly average rainfall in Surface flooding in Eastbourne on 6-7 April
Kelburn in April, with impressive 247 mm due to heavy rainfall
(4th highest monthly total for April on
record, for data since 1928).
Want to look at the summary tables and graphs?
Rainfall
River flows
PAGE 10 OF 22Whaitua summaries Warm Season 2018/19
Te Awarua-o-Porirua climate summary
Wetter (high total accumulation, but swinging between extremes month to month).
Warmer (well above average temperatures)
Very wet:
Almost three times the
average rainfall in April
around Porirua
Very dry:
Total rainfall only about 30-
45% of the normally
expected in January and
February
Want to look at the summary tables and graphs?
Rainfall
River flows
PAGE 11 OF 22Whaitua summaries Warm Season 2018/19
Kāpiti Coast climate summary
About normal accumulated rainfall, but swinging between extremes month to month
Warmer (much above average temperatures)
Very dry:
Only 13 mm of
rain in
January in
Paraparaumu.
That was the
3rd lowest on
record, for
data available
since 1945
Want to look at the summary tables and graphs?
Rainfall
River flows
PAGE 12 OF 22Whaitua summaries Warm Season 2018/19
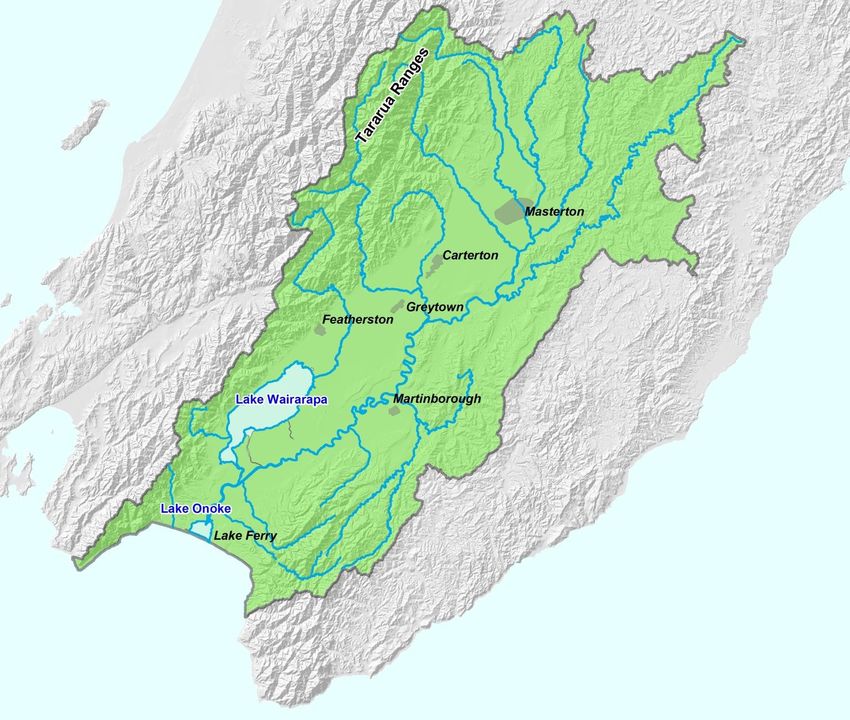
Ruamāhanga Valley climate summary
Wetter (high total accumulation, but swinging between extremes month to month).
Warmer (much above average temperatures)
Very wet: Very dry:
6mm in Masterton in
74 mm in Masterton on the 21st January was the
of November. This was the lowest January
second highest 24 hour rainfall rainfall since 1919.
for Masterton since 1926
Flooding in Carterton on Dec 3rd
and in Carterton and
Martinborough on November
26th, due to heavy rainfall. The
3rd of December case was Warm:
associated with a severe 2nd hottest mean
isolated thunderstorm temperature on record
in Martinborough
during January
(records started in
1986)
Hot nights:
20.1C in Martinborough on the 27th of
March was the second hottest night
since 1986.
Want to look at the summary tables and graphs?
Rainfall
River flows
PAGE 13 OF 22Whaitua summaries Warm Season 2018/19
Wairarapa Coast climate summary
Wetter (high total accumulation, but swinging between extremes month to month).
Warmer (much above average temperatures)
Very wet:
Total rainfall accumulation over
two times the average in
November and December, mostly
associated with an onshore,
easterly flow
Very dry:
Total rainfall accumulation less
than 20% the average in March,
with conditions dominated by a
high pressure with weak north-
easterly flow
Want to look at the summary tables and graphs?
Rainfall
Soil moisture
PAGE 14 OF 22Summary tables and graphs Warm Season 2018/19
Rainfall statistics
Rainfall was variable over the individual six months in the Nov to Apr period, but ended up slightly less or near average in
the west (Kapiti Coast) and high altitude Tararuas but above average elsewhere. Seasonal totals were especially high
(relative to norms) in the south around the Wellington peninsula area and eastern hills of Wainuiomata.
Nov Dec Jan Feb Mar Apr Nov-Dec
Whaitua Location
% % % % % % (mm) %
Wellington Kaitoke 117 100 47 102 58 137 924 95
Harbour & Hutt
Valley Lower Hutt 154 101 61 29 99 207 551 110
Click to see Wainuiomata 235 91 86 48 54 217 938 127
cumulative rainfall Karori 197 114 38 45 121 274 720 138
plots
Wellington 214 132 39 45 155 274 589 147
Te Awarua-o- Battle Hill 202 119 45 60 165 152 665 124
Porirua
Click to see Whenua Tapu 148 115 35 31 146 199 500 111
cumulative rainfall
plots Tawa 174 106 51 38 132 253 560 125
Kāpiti Coast Otaki 26 22 109 265 193 152 458 95
Click to see Waikanae 26 30 78 239 136 152 518 89
cumulative rainfall
plots Paekakariki 184 93 23 51 107 135 507 98
Tararua (Otaki
131 101 84 110 58 133 2423 104
headwaters)
Ruamāhanga Masterton 303 247 17 109 25 92 446 120
Click to see Featherston 203 217 48 70 52 165 603 129
cumulative rainfall
plots Longbush 234 220 31 107 46 139 486 131
Tararua (Waiohine
114 97 84 86 53 89 1741 88
headwaters)
Wairarapa Coast Tanawa Hut 367 203 85 69 12 131 697 136
Click to see
cumulative rainfall
Ngaumu 226 126 12 52 26 127 397 94
plots
Click the following links to return to climate summaries for:
Wellington Harbour & Hutt Valley
Te Awarua-o-Porirua
Kāpiti Coast
Ruamāhanga
Wairarapa Coast
PAGE 15 OF 22Summary tables and graphs Warm Season 2018/19
Cumulative rainfall plots
Cumulative rainfall totals for the November to April 2019 period are detailed for various rain gauges sites across the regional
whaitua areas, as denoted by the blue trace on the following plots. November to April 2018 period is denoted by the red
trace and the black trace represents the long-term average rainfall accumulation.
Wellington and Hutt Valley
The plots highlight that the rainfall accumulation during the November to April 2019 period was a little above average in the
Hutt Valley and more significantly so in Wellington.
Periods of highest rainfall accumulation are evident on both shoulders of the season and the contrast with the previous year
for the Nov-Dec period is particularly notable.
Porirua Harbour
The plots show that the pattern of rainfall accumulation over the November to April 2019 period at the two sites within the Te
Awarua-o-Porirua whaitua area were quite similar, with notably higher than average rainfall occurring throughout the
season. Again, the beginning of the season (Nov-Dec) contrasts starkly with the previous year.
Rainfall for the period was around 25% greater than average.
PAGE 16 OF 22Summary tables and graphs Warm Season 2018/19
Kāpiti Coast
Rainfall accumulations on the Kapiti Coast were very close to normal in terms of both the pattern of accumulation (steady
and consistent) and the eventual seasonal totals.
Ruamāhanga
Rainfall accumulations in the Ruamahanga Valley were quite notable. Accumulations were very high in Nov and Dec
(opposite to the previous year) and then steadied to a more normal pattern with seasonal totals well above (100-200mm)
normal.
Wairarapa Coast
The Tanawa Hut rain gauge in the eastern Wairarapa hills
showed quite an exceptional pattern of rainfall.
Accumulations were so high in Nov and Dec that the
average seasonal total had been more or less reached by
the new year. While Jan and Feb were relatively dry the
seasonal total wound up being about 30% higher than
usual.
PAGE 17 OF 22Summary tables and graphs Warm season 2018/19
River flows - averages
The average river flows over the November to April period were within 20-30% of normal at most sites. Kapiti Coast stood
out as having lower than normal seasonal flows and the eastern Wairarapa coast for having much higher seasonal flows
than normal. Individual months were very variable with a general pattern of higher than normal flows early in the season
(November especially) and lower than normal later in the season (February especially).
Flow as a percentage of average
Whaitua River Nov Dec Jan Feb Mar Apr Nov-Apr
Hutt River - Kaitoke 127 87 59 67 52 121 90
Hutt River - Taita Gorge 124 87 50 48 50 103 83
Wellington Akatarawa River 98 66 48 51 60 103 74
Harbour & Hutt
Valley Mangaroa River 148 128 64 41 52 91 98
Waiwhetu Stream 132 143 95 54 80 167 116
Wainuiomata River 176 99 65 46 50 172 110
Porirua 154 131 98 60 116 225 137
Te Awarua-o-
Pauatahanui 153 231 97 53 91 127 136
Porirua
Horokiri 150 104 50 24 103 138 98
Waitohu 95 53 67 65 84 106 76
Otaki 106 50 56 66 59 83 71
Kāpiti Coast
Mangaone 83 57 73 80 118 110 82
Waikanae 122 71 49 41 46 77 73
Kopuaranga 152 194 65 30 31 35 91
Waingawa 114 139 72 52 38 65 85
Waiohine 114 99 67 69 47 81 84
Ruamāhanga Mangatarere 160 256 63 35 19 62 108
Tauherenikau 118 141 65 63 45 113 96
Otukura 181 333 151 85 86 80 165
Ruamāhanga 143 181 82 51 36 57 100
Wairarapa Coast Pahaoa 520 888 90 14 6 47 188
Click the following links to return to climate summaries for:
Wellington Harbour & Hutt Valley
Te Awarua-o-Porirua
Kāpiti Coast
Ruamāhanga
Wairarapa Coast
PAGE 18 OF 22Summary tables and graphs Warm Season 2018/19
River flows – lowest
Minimum river and stream flows recorded during the Nov to Apr 2019 period. Flows did not get particularly low this season
and no significant or record events occurred.
Minimum Flow
Whaitua River
Flow (m3/s) Date Comment
Hutt (Kaitoke) 1.167 15-February
Hutt (Taita Gorge) 3.312 15-February
Wellington Harbour
Akatarawa 1.27 8-February
& Hutt Valley
Mangaroa 0.345 15-February
Wainuiomata 0.179 1-March
Porirua 0.191 28-February
Te Awarua-o-
Pauatahanui 0.138 15-February
Porirua
Horokiri 0.089 28-February
Waitohu 0.109 19-February
Otaki 5.487 8-February
Kāpiti Coast
Mangaone 0.193 8-February
Waikanae 0.987 20-March
Kopuaranga 0.332 17-February
Waingawa 1.154 15-February
Waiohine 3.38 15-February
Mangatarere 0.123 20-March
Ruamāhanga
Tauherenikau 1.184 8-February
Otukura 0.123 26-March
Ruamāhanga (Upper) 2.067 14-February
Ruamāhanga (Lower) 7.679 15-February
Wairarapa Coast Pahaoa 0.144 26-March
* Analyses have been completed on provisional data which may be subject to change once it is processed and archived .
Click the following links to return to climate summaries for:
Wellington Harbour & Hutt Valley
Te Awarua-o-Porirua
Kāpiti Coast
Ruamāhanga
Wairarapa Coast
PAGE 19 OF 22Summary tables and graphs Warm season 2018/19
River flows – highest
Maximum river and stream flows recorded during the Nov to April 2019 period. The estimated return period is given for each
event. Most peak flows were well under those expected to occur on average at least once a year. The only exception was a
relatively significant event in the Pahaoa catchment on 27 November 2018 when a peak flow with an return period of about
five years occurred.
Maximum Flow
Whaitua River
Return Period
Flow (m3/s) Date
(years)
Hutt (Kaitoke) 104 9 NovemberSummary tables and graphs Warm season 2018/19
Soil moisture content
Wairarapa Coast
November to April 2019 soil moisture content at monitoring sites at Tanawa Hut in north-east Wairarapa (Wairarapa Coast
whaitua) and Tauherenikau racecourse (Ruamāhanga whaitua) are plotted below.
Soil moisture was well above normal at both sites late in 2018, especially so at Tanawa Hutt where moisture levels were at
historical highs during December. As conditions dried out in the new year moisture levels reduced to those more typically
seen in summer months but remained well above historical lows.
Tanawa Hut (North-eastern Wairarapa hill country) Historical min and max range
60
Long-term average
7-day mean Soil Moisture Content (%)
2017/18
50 2018/19 Field capacity
(estimate only)
40 Stress point
(estimate only)
30
Permanent wilting point
(estimate only)
20
10
Nov Dec Jan Feb Mar Apr May
40
Tauherenikau Racecourse 2016/17
2017/18
7-day mean Soil Moisture Content (%)
2018/19
30
20
10
0
Nov Dec Jan Feb Mar Apr May
Drought monitoring
GWRC maintains a drought check webpage with regional anomaly maps and links to live data across the
region:
http://www.gwrc.govt.nz/drought-check/
Climate Briefings
Additionally to the extended water resources reports, the Environmental Science department, GWRC, also
produces seasonal updates specifically targeting the farming community. Those can be accessed from the
main Climate and Water Resource webpage:
http://www.gw.govt.nz/seasonal-climate-and-water-resource-summaries-2/
PAGE 21 OF 22Summary tables and graphs Warm season 2018/19
Environmental data
GWRC maintains a comprehensive online environmental data server feeding real time, live data across the
region for several climatic and hydrological variables
http://graphs.gw.govt.nz
Interactive Climate Change Mapping
The Environmental Science department at GWRC has produced one of the first comprehensive climate
change mapping tools publicly available in New Zealand. The online mapping tool is fully interactive and
easy to understand, allowing users to plot over twenty different variables, projected over every available
IPCC scenario for both mid and late century
https://mapping1.gw.govt.nz/gw/ClimateChange/
Sea level Rise Mapper (New)
The Environmental Science department at GWRC is also making available a comprehensive sea level rise
(SLR) mapper for the whole region. The tool allows users to have a view of sea level rise impacts, for values
between zero and 5m SLR, including the effects of storm surge for selected heights. We encourage
community and stakeholders to use this tool as a first screening of likely impacts that the region will be
dealing with, as sea levels continue to rise.
https://mapping1.gw.govt.nz/GW/SLR/
PAGE 22 OF 22Summary tables and graphs Warm Season 2017/2018
PAGE 23 OF 22You can also read


