Climate Change in Baden-Württemberg - L Facts - Impacts - Perspectives
←
→
Page content transcription
If your browser does not render page correctly, please read the page content below
Climate Change in Baden-Württemberg
         L Facts – Impacts – Perspectives

                                                                                       2
                                            MINISTRY OF THE ENVIRONMENT, CLIMATE PROTECTION
                                                        AND THE ENERGY SECTOR
Contents
    PreFace

    meteOrOlOgical data                               Page
         Global climate change                           4
         Regional climate change                         6
         Looking to the future                           8
         Extreme events                                 10

    climate imPacts
         Human health                                   12
         Water management                               16
         Soil conservation                              20
         Agriculture                                    24
         Forestry                                       28
         Nature conservation and species protection     32
         Tourism                                        36
         The economy                                    40

    OutlOOk                                             44

    Further inFOrmatiOn                                 46
3
what aspects of our society will be directly       tural resources and environment safeguard pro-      manageable proportions. However, it is now
                                                   affected and to what extent?                       gramme (BWPLUS) research plan and in                clear that coping with the effects of climate
                                                                                                      projects undertaken by the State Institute for      change will demand a major commitment of
                                                   These are the questions which this climate         Environment, Measurement and Nature Con-            resources. The summary of the latest state of
                                                   booklet is intended to address.                    servation (LUBW). The current research pro-         knowledge about climate change in Baden-
                                                                                                      gramme on climate change and the modelling          Württemberg provided in this booklet is an
                                                   The State of Baden-Württemberg began study-        of adaptation strategies in Baden-Württemberg       important contribution to this endeavour,
                                                   ing climate change and its consequences at a       (KLIMOPASS) were launched in 2011. Both ba-         particularly in terms of informing the people
                                                   very early stage and launched a collaborative      sic and applied research projects will be under-    who live in Baden-Württemberg. The Cabinet
                                                   project with the Free State of Bavaria and the     taken in the framework of this programme.           has also decided to draw up a strategy for
                                                   German Meteorological Service on climate           With KLIMOPASS the State Government is              adaptation to the unavoidable consequences of
                                                   change and the consequences for water man-         pursuing its aim of promoting research into the     climate change for Baden-Württemberg. This
                                                   agement (KLIWA) back in 1999. The objective        regional impact of climate change and of clo-       strategy will be substantially based on currently
                                                   of KLIWA is to enhance our understanding of        sing gaps in current knowledge. The next step       available scientific evidence.
                                                   the potential impact of climate change on the      will be for researchers to deliver an even more
                                                   regional water balance in the period 2021 to       detailed description of the regional and local

Our climate                                        2050 and to use the findings to develop corre-
                                                   spondingly adaptive water management mea-
                                                   sures.
                                                                                                      scale and impact of climate change and to redu-
                                                                                                      ce uncertainties further.

Everyone is talking about the nature and im-                                                          These many different activities are the focus of    Franz Untersteller
pact of climate change. Most people are aware      The “Climate change – impacts, risks, adaptati-    this climate booklet. They enable us to make        Minister of the Environment,
that climate change is a global problem which      on” (KLARA) study investigated areas other         fairly accurate predictions today about regional    Climate Protection and the Energy Sector
will pose a huge challenge to the world com-       than water management in 2001 and the re-          climate change and its likely impact in Baden-
munity in the course of this century. Far fewer    search programme on the Challenge of Climate       Württemberg. They also make it possible to
people realise that the regional effects of cli-   Change in Baden-Württemberg was performed          identify areas in which adaptive measures may
mate change will also be felt in Germany as        from 2006 to 2010. In 2006 Baden-Württemberg       be required.
well as by all of us here in Baden-Württemberg.    published the Baden-Württemberg climate
                                                   atlas, which describes the climate and changing    The findings show that climate change is al-
What specific impact has climate change al-        weather patterns over a 30-year period from        ready a reality. Intensive climate change mitiga-

                                                                                                                                                                                                                  PreFace
ready had in Baden-Württemberg or will it have     1971 through to 2000. Various aspects of cli-      tion measures are necessary in order to limit
in the future? What regions of our country and     mate change were also studied as part of the na-   the extent of climate change and reduce it to
                                                                                                                                                                                                              3
The temperature is
                 going up and up
                 Average global temperatures increased by around 0.7°C

                 between 1900 and 2005; about 0.6°C of this increase has

                 occurred in the last 50 years. Temperatures in northern

                 Europe may even rise by more than 6°C by the year 2100.

                 The United Nations and the World Meteorolo-        other countries have already reduced emissions
                 gical Organization (WMO) established the           in a number of areas, these have not been
                 Intergovernmental Panel on Climate Change          enough to compensate for overall increases in
                 (IPCC) in 1988 to investigate the threat of cli-   global emissions. Current mitigation policy
                 mate change. In its most recent report, issued     efforts are not enough to stop climate change in
                 in 2007, the IPCC concluded that climate           the decades ahead. Because the climate system
                 change may take on more dramatic proportions       is sluggish, temperatures would continue to rise
                 than previously assumed. The IPCC found that,      even if emissions were eliminated entirely and

Global
                 in the last 50 years alone, global temperatures    immediately. More needs to be done given that
                 rose almost twice as fast as in the previous       in many countries the effects of global warming
                 hundred years. Numerous climate models show        will alter and in some cases threaten the natural
                 that if current CO2 emission levels persist        resources on which life itself depends as well as

climate change
4
                 average temperatures will rise even further.
                 While wide-ranging climate change mitigation
                 policies adopted in Germany, Europe and many
                                                                    the continued existence of many plants and
                                                                    animals.
tOday’s climate also a growing problem. In 2003 the whole of increases in glObal surFace temPeratures (1900–2100)
Greenhouses gases, such as carbon dioxide and Europe suffered for a number of weeks from a
water vapour, warm the earth by absorbing heat heat wave in which temperatures went up to
thema
which would otherwise be radiated by the pla- 40°C. Mean global temperatures of 12.7°C in
6.0
Model-based projections derived from
emission scenarios developed by the
net back into space. The more of these gases January 2007 were the highest ever measured Intergovernmental Panel on Climate
Increases in global surface temperatures (°C)
5.0 Change (IPCC) reveal the potential global
there are in the atmosphere, the thicker the for this month. Globally, 2009 was the second warming trends on our planet.
greenhouse “glass” around the earth becomes. warmest year since 1880, and Germany was no 4.0
Scenario with regionally oriented
exception: the previous decade was the warmest 3.0 economic development (A2)
KLIWA Scenario with high economic growth
Zeithorizont
In its 2007 report the IPCC concluded that glo- in 130 years. based on a balance across fossil and
2.0
bal greenhouse gas emissions have increased non-fossil energy sources (A1B)
1.0
Globally sustainable economic devel-
continuously since the late eighteenth century. tOmOrrOw’s climate
A1B
opment (B1)
B1
A2
Constant year 2000 concentration
The largest increase occurred between 1970 and IPCC climate models are carefully evaluated
meteOrOlOgical data – glObal climate change
0.0
20th century
2004. Pre-industrial CO2 concentrations in the against extensive historical records. The IPCC -1.0
Source: IPCC 2007: AR4-WGI
atmosphere were relatively constant at around assesses current atmospheric CO2 concentration
1900
2000
2100
280 ppm (parts per million). The combustion at just below 400 ppm – an increase of about 30
of fossil fuels (coal, oil and gas) is continuing to per cent since the year 1750. The IPCC and the
push these values and average temperatures up- Federal Government’s Advisory Council on
wards. Global Change (WBGU) calculate that CO2 temPerature change in eurOPe (2080–2099)
Since the turn of the century in 1900 almost all concentrations of over 450 ppm would push
measurements show a worldwide rise in tem- up average global temperatures by more than
°C Simulated temperature changes for the
perature of 0.7°C. Extreme weather is also a 2°C. Ultimately, reducing greenhouse gases 10 late 21st century (2080–2099) compared
70°N
7
growing problem. In 2003 the whole of Europe will be essential. While climate models may not with the period 1980–1999. The simula-
5
tion is based on emission scenario A1B.
suffered for a number of weeks from a heat be crystal balls, they do enable us to estimate 60°N
4
3,5
Temperature trend °C
Source: IPCC 2007: AR4-WGI
wave in which temperatures went up to 40°C. future changes. These models make future 3
2,5
Mean global temperatures of 12.7°C in January projections in scenarios which combine me- 50°N
2 Climate Change 2007: The Physical
1,5 Science Basis. Working Group I Contribu-
2007 were the highest ever measured for this teorological computer models with different 1 tion to the Fourth Assessment Report of
40°N
month. Globally, 2009 was the second warmest assumptions about population growth, eco- 0,5 the Intergovernmental Panel on Climate
Change, Figure 11.5. Cambridge Universi-
year since 1880, and Germany was no exception: nomic development, the use of resource- ty Press
30°N
the previous decade was the warmest in 130 efficient technologies and greenhouse gas
10°W
0°O
10°O
20°O
30°O
40°O
years. Since the turn of the century in 1900 emissions. All the calculations used in the
almost all measurements show a worldwide rise IPCC scenarios point towards further rises in
in temperature of 0.7°C. Extreme weather is temperature in the future. 5
Climate change in
                 Baden-Württemberg
                 Baden-Württemberg will not be spared the effects of

                 climate change: in fact temperatures have already risen

                 noticeably, particularly in winter. This trend will become

                 stronger – with all the consequences.

                 The State of Baden-Württemberg is already ex-       developments in Baden-Wurttemberg have also
                 periencing the impact of changes in the climate     been produced. The findings show that the
                 which will very likely accelerate even further in   mean temperature in Baden-Württemberg rose
                 the future. Thanks to the KLIWA (Climate            significantly in the course of the 20th century.
                 change and the consequences for water ma-           Temperatures will also continue to rise in the
                 nagement), KLARA (Climate change – impacts,         future – with all the effects on the weather,
                 risks, adaptation) and the Challenge of Climate     flora, fauna and human beings which this
                 Change in Baden-Württemberg research pro-           entails. The first decade of the new millennium

Regional
                 grammes financed by the state, a great deal of      was the warmest in Germany for at least 130
                 data is already available. Over 250 meteorologi-    years. Mean temperatures in Baden-Württem-
                 cal stations and around 40 stream gauges have       berg have risen by over 1°C compared with
                 already been evaluated for KLIWA alone. As          around 0.7°C worldwide (IPCC comparison

climate change
6
                 well as collecting data, scenarios of future        period 1906–2005).
climate change nOw mean annual temPerature in baden-württemberg (1901–2011) climate change in the Future
Climate change is well underway in Baden- Calculations based on all the climate scenarios
Württemberg. The mean annual temperature 10,5
for Baden-Württemberg show that tempera-
has risen from 1901 to the present day from 10 tures will continue to rise up to the year 2050
around 8°C to over 9°C. The biggest increase 9,5 by 0.8 to 1.7°C. Hot days (on which tempera-
has taken place over the last 30 years since 9 tures are at least 30°C) will occur at least twice
1980. One example illustrates the effects of this 8,5 as frequently. At the same time there will be a
apparently minor change. Temperatures in 8 Annual mean substantial reduction in the number of frost
°C
Linear regression
Karlsruhe are now the same as they were in 7,5
In comparison: 30-year mean value and ice days.
climatic normal period for Germany
Lyon, France 75 years ago. Over the last 30 7
(1961–1990) 8.2°C
years maximum winter precipitation levels have 6,5
30-year mean value climatic normal The Rhine Plain will be affected particularly se-
meteOrOlOgical data – regiOnal climate change
6
period for Baden-Württemberg
risen by 35 per cent, as have the number of (1961–1990) 8.1°C
verely. The number of summer days in Karls-
5,5
flood events. On the other hand, summers tend 1900 Data: DWD, 2011 ruhe, for example, will increase from just under
1910
1920
1930
1940
1950
1960
1970
1980
1990
2000
2010
to be drier than in the past. The number of 60 now to over 80 days by the middle of the
days on which lower-lying areas are covered in century. Winter precipitation will increase by
snow has decreased by an average of 30 to 40 up to 35 per cent in some regions. This will be
per cent. Evaluations by the State Institute for accompanied by an increased risk of flooding.
Environment, Measurement and Nature Con-
servation (LUBW) of measurements taken over annual number OF summer and ice days in karlsruhe (1878–2011) In the case of the Neckar, for example, studies
a period of many years at selected meteorologi- show that, up to the year 2050, the most drama-
cal stations in Baden-Württemberg also confirm tic floods could involve a 15 per cent higher
120
the climate change trends. In 1953, for example, 110 volume of water than has been the case to date.
100
Stuttgart still had 25 ice days (on which tempe- 90 This means that new flood protection schemes
80
ratures remained below 0°C) and an equal need to be built on a much larger scale or exist-
Number of days
70
60
Summer day ( 25 °C )
number of summer days (highest temperature 50 Ice day (< 0 °C ) ing works upgraded to meet requirements. The
40 Linear (summer day) (> 25°C)
of at least 25°C). By 2009 the number of sum- Linear (ice day) (< 0°C)
number of violent thunderstorms is also pro-
30
mer days in Stuttgart had risen to 45, while the 20 jected to increase and consequently to
10 Data: DWD weather station data up
number of ice days had fallen to just 15. 0
to 2008; IMK/KIT data since 2010 threaten smaller rivers and streams with flood-
1870
1880
1890
1900
1910
1920
1930
1940
1950
1960
1970
1980
1990
2000
2010
ing. Overall, there are likely to be more and
longer periods of drought during the summer
months.
7
Predicting the future with
             climate simulations
             Global climate models are not capable of forecasting cli-

             matic impact at the local level. Higher resolution simula-

             tions can reduce uncertainty and offer higher quality data.

             The Institute for Meteorology and Climate Re-      more accurately the kind of impact they can
             search at the Karlsruhe Institute for Technology   expect climate change to have in their areas.
             (KIT) has performed a series of regional cli-      This also means that it is possible to consider
             mate simulations for the recent past (1971 to      and plan possible adaptation strategies, such as
             2000) and the future (2011 to 2040) as part of     flood protection measures, with much greater
             the Challenge of Climate Change in Baden-          precision.
             Württemberg research programme. In this
             context researchers used the COSMO-CLM re-
             gional climate model, with a seven kilometre

Looking to
             resolution, for the first time. Compared with
             other climate models this enables much better
             regional forecasts to be made. Although models
             of this type only describe hypothetical future

the future
8
             scenarios, they do enable the responsible local
             authorities or district offices to assess much     Fire fighters building a flood barrier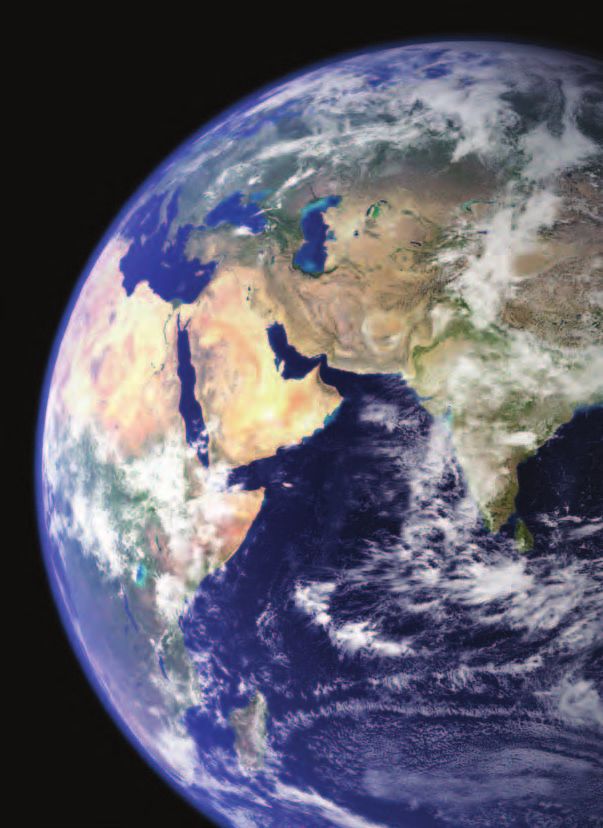
warm summers, mild winters                             number OF summer days                                    Rhine Valley. In the period 2011 to 2040 global     heavy rainFall in the summer
From 1971 to 2000 the Rhine Valley had 50                                                                       warming will reduce the number of frost days
                                                           +22
summer days a year, while the middle and                                                                        by around 10 days a year in the Rhine and             Decrease

   thema
                                                           +20
higher ranges of the Black Forest and the                  +18
                                                                                                                Neckar Valleys as well as around Lake
Swabian Alb experienced just 10 summer days.               +16                                                  Constance and by around 15 to 20 frost days in
                                                           +14                                                  higher areas. In relative terms the fall will be
                                                           +12
In the future (2011 to 2040) the number of                                                                      more dramatic in lower-lying areas which al-
                                                           +10                                                                                                        Increase
summer days (maximum temperatures of at                    +8
                                                                                                                ready experienced fewer frost days in the past.
least 25°C) will increase, albeit at different rates
according to region. The number of summer                                                                       less Frequent but heavier rain-
days in the Rhine and Neckar Valleys as well as                                                                 Fall
Lake Constance will increase by 15 to 20 days a                                                                 The Karlsruhe Institute of Technology (KIT)

                                                                                                                                                                                                                                          meteOrOlOgical data – lOOking tO the Future
year; in higher-lying areas by just under 10 days.                                                              has also studied the probability of an increase
While this means an increase of “just” 40 per                                                                   in heavy rainfall in Baden-Württemberg in the
cent for the Rhine Valley, these figures imply         Change in the number of summer days (≥25°C), 1971–2000   future. In order to make predictions with more      Probability of decrease or increase in heavy summer rainfall in
                                                       and 2011–2040. Source: IMK-TRO/KIT, 2010                                                                     the period 2011–2040 compared with the period 1971–2000.
twice as many summer days in parts of the                                                                       confidence the KIT has developed the world’s        Source: IMK-TRO/KIT, 2010

Black Forest and the Swabian Alb. What is              number OF FrOst days                                     first high resolution ensemble method by per-
more, the KLARA research programme shows                                                                        forming and statistically evaluating a series of    same throughout the course of the year, the in-
                                                           -7
that some of the lower-lying areas of Baden-               -9
                                                                                                                simulations which use different boundary con-       cidence of rainfall will be distributed different-
Württemberg in particular, such as the Upper               -11                                                  ditions. The findings reveal that flooding fol-     ly. Years with particularly wet and dry periods
                                                           -13
Rhine Valley, will have up to 15 more hot days                                                                  lowing heavy rainfall, landslides or erosion        will become more probable in the future. Over-
                                                           -15
(maximum temperatures of at least 30°C) in the                                                                  poses a real danger in low mountain ranges in       all there will be an increase in extreme weather
                                                           -17
period 2046 to 2055 than they did between                  -19
                                                                                                                particular. The map shows that, in the future,      events in Baden-Württemberg.
1951 and 2000.                                                                                                  there is a greater probability of some regions of
                                                                                                                Baden-Württemberg being hit by more fre-
A similar picture – in reverse – emerges for                                                                    quent and more intensive heavy precipitation
frost days: to date the medium and higher alti-                                                                 (blue areas) during the summer months. Preci-
tudes of southern Germany’s low mountain                                                                        pitation levels will remain unchanged in some
ranges experienced over 120 frost days (lowest                                                                  areas and will decrease in only a very few. The
temperatures of under 0°C) in the period 1971                                                                   climate simulations suggest that while the total
                                                       Change in the number of frost days, 1971–2000 and
to 2000 compared with less than 80 days in the         2011–2040. Source: IMK-TRO/KIT, 2010                     amount of precipitation will remain much the
                                                                                                                                                                                                                                      9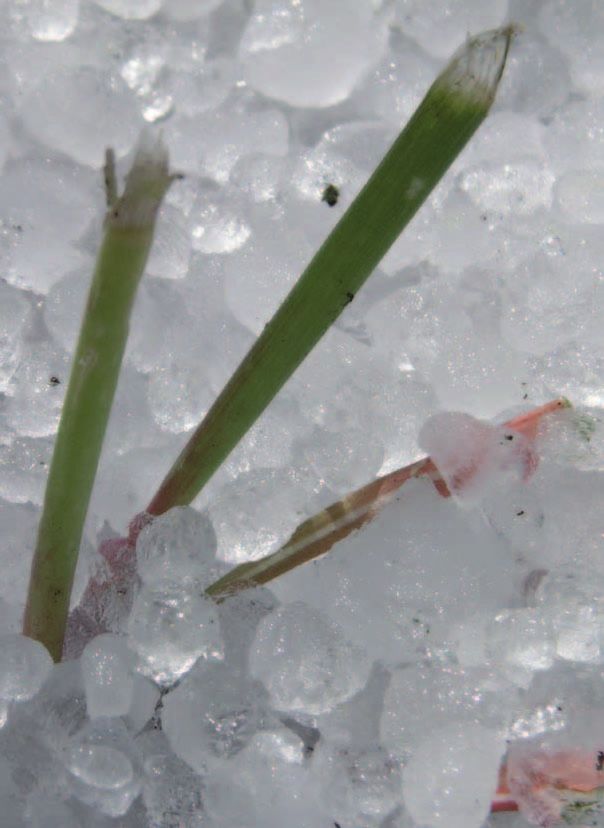
Heavy storms and
                 more frequent hail
                 Extreme weather events can cause serious damage. Will

                 there be more frequent and intense storms, hail and thun-

                 derstorms in the future?

                 There is still no conclusive proof that the in-   shown that gust speeds at valley stations have
                 crease in the frequency of extreme weather        risen somewhat in the past in contrast to speeds
                 events is linked to climate change. However,      measured at mountain stations. The frequency
                 there have been far more severe winter storms     and intensity of hailstorms have also increased.
                 over the last 20 years which have also hit Ba-    Building insurance data for Baden-Württem-
                 den-Württemberg. Examples include the winter      berg show that there was a substantial rise in
                 storms Daria (1990), Vivian and Wiebke (1990),    insurance claims between 1986 and 2008. The
                 Lothar (1999), Kyrill (2007) and most recently    number of days on which claims for hail dam-
                 Xynthia (2010). Gust speeds during these          age were made rose from around 10 a year in
                 storms reached 150 km/h in lower areas and        the 1980s to 20 days a year in the 1990s and is
                 over 200 km/h in regions with low mountain        now between 30 and 40 days. The economic
                 ranges.                                           and social benefits associated with improved
                                                                   knowledge about potential changes in the

Extreme events
10
                 An evaluation performed at various meteoro-
                 logical stations in Baden-Württemberg has
                                                                   frequency and intensity of extreme events are
                                                                   substantial.
the cOsts OF hail and stOrms where will dangerOus winds
Severe hailstorms can cause massive damage to blOw?
buildings, vehicles and fields. In Baden-Würt- The storm hazard map shows the wind speeds
thema
temberg hail is responsible for almost 40 per which can be expected on average every 50
cent (approximately 50 million euros) of all years. High wind speeds tend to be most fre-
damages to buildings caused by natural events. quent at higher altitudes and over terrain with
The total costs of one-off winter storms are highly structured surfaces, such as the Black
even higher. According to figures produced by Forest or the Swabian Alb. However, there is
reinsurers Munich Re, the damage caused by only a risk of damage where there are vulnera-
More thunderstorms and heavy rain Forest damage following the winter storm Lothar in 1999.
the hurricane-force storm Lothar alone totalled ble buildings or trees susceptible to wind
8.64 billion euros for southern Germany, breakage.
northern France, Switzerland and Austria. stOrm hazard maP stOrm damages in FOrests
Half of these damages were insured. Storms The RESTER (Strategies to Reduce the Storm
km/h Probability
with high winds generate disproportionately Risk of Forests) joint research project has ex-
220
Low
high costs. amined large areas of tree damage in the forests
meteOrOlOgical data – extreme events
200 Moderate
of Baden-Wurttemberg resulting from the win-
180 High
Research undertaken by the interdisciplinary ter storms Wiebke (1990) and Lothar (1999) to
160
Center for Disaster Management and Risk 145
calculate storm damage probabilities for Baden-
Reduction Technology (CEDIM) shows that a 125
Württemberg’s entire forest area. Assuming a
storm with wind speeds just 10 per cent faster 110 maximum gust speed of over 126 km/h, storm
than those recorded during Lothar would cause 90 damages are most probable in areas of co-
three times more damage. Studies suggest that niferous forest at highly exposed locations with
the storm climate will not change significantly wetdry soils on new red sandstone. Areas which
in Baden-Württemberg by 2050. However, we are threatened by storm include the mountain
should continue to expect storms of similar ridges of the northern Black Forest and the eas-
severity to that of Lothar in the future. Higher tern parts of the Odenwald range.
temperatures and humidity exacerbate the
potential for thunder and hailstorms.
The map shows the areas in Baden-Württemberg which are Susceptibility of forests to damage in Baden-Württemberg based
threatened by storm. Source: Heneka et al., Nat. Hazards Earth on the winter storms Wiebke and Lothar. Source: Meteorological
Syst. Sci., 2006; Hofherr and Kunz, Clim. Res., 2010 Institute, University of Freiburg
11The human health risks of
climate change
More heat waves and sultrier weather are particularly
stressful for the elderly. Climate change may also bring
new diseases and allergy-producing plants with it.
Up to now we have been very lucky here in is particularly true of south-west Germany. As
Baden-Württemberg. According to the State Baden-Württemberg becomes hotter more
Statistical Office the population of Baden- people may become ill and die earlier than at
Württemberg has a very high life expectancy. present. In order to produce more precise
On average women live to the age of 83.3 and figures on this risk the KLARA research project
men to 78.6. This means that life expectancy in has also investigated the impact of climate
Baden-Württemberg is among the highest in change on temperature-related mortality in
the EU. Baden-Württemberg.
However, studies undertaken by the Intergov- Our health may soon be threatened by disease-
ernmental Panel on Climate Change (2007) as carriers from warmer climes. Ticks are becom-
well as the findings of the KLARA and KLIWA ing more prevalent. New species of fauna and
studies do show that people living in central flora are migrating. In the worst possible case
Human health
12
Europe will have to contend with even hotter
days and longer heat waves in the future. This
we may even have to cope with tropical dis-
eases such as chikungunya and dengue fever.sheep tick (Dermacentor marginatus) is com- Common ragweed (Ambrosia artemisiifolia), a
plicit in the spread of Q fever, a serious in- strong allergen, is also spreading rapidly, par- OPPOrtunities and
fectious bacterial disease. The Q fever pathogen ticularly in the Upper Rhine region and in and
Facts risks FOr health
is first transmitted by ticks to livestock, such as around Stuttgart. Concentrations of Ambrosia
cows, sheep and goats, and can infect humans pollen are still fairly low. However additional
who inhale contaminated dust. In the future we wind-dispersed pollen from France may cause
must expect an increase in tick-borne infections problems for people with allergies.
such as Mediterranean spotted fever.
OPPOrtunities
heat and dangerOus Organisms tOtal mOrtality Per 100,000 inhabitants, 2002–2003 • Fewer days with cold stress
Human beings prefer a balanced climate. Dur-
• Decreased cold-related morbidity
ing the extremely hot summer of 2003 around
and mortality
2000 mainly elderly and infirm people in Ba-
Mrt
den-Württemberg died as a result of the heat! EV
The causes of these deaths included heart at- Simulated
data
tacks, cardiovascular disease, kidney diseases,
respiratory diseases and metabolic disorders.
mortality
Total mortality in Baden-Württ-
climate imPacts – human health
emberg, 2002–2003 (mortality:
statistically registered; EV: ex-
The number and proliferation of organisms pected value)
Source: Potsdam Institute for
risks
which may transmit or cause disease increase as
Climate Impact Research (PIK),
average temperatures rise. In 2008, sand flies 2005: KLARA • More days with heat stress
were shown to have colonised nine new loca-
tions in Baden-Württemberg, for example. • Increased heat-related mortality
These blood-sucking insects are known to be
potential vectors of the tropical parasitical in- • New and more infectious diseases
fection leishmaniasis, which to date has only
• New allergy-producing plants
been encountered in Mediterranean areas of
Europe. Ticks which can transfer lyme borrelio- • Fall in labour productivity
sis or TBE (tick-borne encephalitis) are already during heat waves
very common in Baden-Württemberg. The
13show that people over 75 are particularly sensi- tiger mosquito may also spread diseases such as
tive. By multiplying the number of people in chikungunya and dengue fever in Baden-Würt-
imPact/ this age group with the frequency of thermal temberg. In order to assess future infection
PersPectives stress it is possible to derive the vulnerability of risks it is extremely important that the distribu-
the population to hot or cold stress. As the tion and development of vector populations
population of Baden-Württemberg is becoming and pathogens are recorded. Action must also
increasingly older, the vulnerability of the be taken to combat the spread of common rag-
population will increase by an average of 20 per weed, which was mainly introduced to Baden-
cent. This means that by 2055 an additional 180 Württemberg in contaminated bird food and
to 400 additional heat-related deaths may be which is able to profit from the favourable cli-
mOre heat-related deaths in expected to occur throughout Baden-Württem- matic conditions here. The widespread pro-
baden-württemberg berg unless adaptation measures are taken. This liferation of invasive species such as these can
Researchers at the Potsdam Institute for Cli- increase will not be compensated for by the only be suppressed at a very early stage.
mate Impact Research working on the KLARA positive effects of fewer days of cold stress.
project have assessed how many people in Ba- An engorged tick
den-Württemberg may die as a result of the learning FrOm extreme events
health effects of climate change. They have Bearing these developments and the lessons
done this by comparing the estimated weather- learned from the extreme year 2003 in mind, the imPact OF thermal stress On the human bOdy
related deaths in an underlying scenario (1951– adaptation measures must be taken as a matter
2000) with those in a second climate scenario of urgency. The first step has been taken by
class Perceived thermal thermophysiological stress
(2046–2055). These two scenarios show that setting up a heat/health warning system which temperature °c perception
there will be a substantial increase in the num- notifies around 1,400 nursing homes in Baden- -4 < - 39 Very cold Extreme cold stress
-3 - 26 to - 39 Cold Strong cold stress
ber of days causing heat stress at all altitudes up Württemberg alone about the imminent arrival
-2 - 13 to - 26 Cool Moderate cold stress
to the year 2055. This will be accompanied in of extreme weather events. In the long term
-1 0 to - 13 Slightly cool Slight cold stress
most districts by a fall in the number of days town planners and architects will have to plan
0 0 to + 20 Comfortable Comfort possible
inducing cold stress, although not by the same and build climate-adapted urban settlements 1 + 20 to + 26 Slightly warm Slight heat load
degree as the increase in the number of hot and buildings. 2 + 26 to + 32 Warm Moderate heat load
days. 3 + 32 to +38 Hot Strong heat load
4 > + 38 Very hot Extreme heat load
We will probably suffer from more infectious
Researchers have also drawn on mortality data diseases as well as heat in the future. Disease-
to determine how sensitively the population bearing ticks are becoming more prevalent. Tro- Thermal stress classes based on a perceived temperature which takes account of physiological strain on the human organism
14 reacts to heat and cold stress. The findings pical and subtropical pests such as the Asian (based on Association of German Engineers [VDI], 1998). Source: Potsdam Institute for Climate Impact Research (PIK), 2005: KLARAragweed gains grOund in the
west maP shOwing the sPread OF
Surveys and evaluations undertaken by the rag-
regiOnal imPact cOmmOn ragweed
weed unit at the State Institute for Environ-
ment and Nature Conservation (LUBW) show
that there are three regions in which the allergy-
causing Ambrosia artemisiifolia occurs more
mannheim
frequently. Stands of several tens of thousands
of plants can be found between Rastatt and
Mannheim in particular, as well as in and
the higher uP yOu live, the better around Freiburg and Stuttgart. karlsruhe
The scenarios show that in the lower-lying and
consequently warmer parts of Baden-Württem-
stuttgart
berg more people may die as a result of the
heat-related effects of climate change than in
higher areas. At altitudes of between 0 and 400 ulm
metres an average of 2.4 to 3.6 additional heat-
related deaths may be expected per 100,000 in-
climate imPacts – human health
habitants every year. The lower-lying regions of
northern Baden-Wurttemberg and the districts Freiburg
of Emmendingen and Freiburg may be expected
to be hit particularly harshly. At altitudes of be-
konstanz
tween 400 and 800 metres an average of 1.6 to
2.4 additional deaths per 100,000 inhabitants
may be expected every year – a somewhat bet-
ter figure than in the lower-lying regions. In the No information
< 10 specimens
scenarios presented here the fewest additional 10 to 100 specimens
>100 to 1,000 specimens
deaths may be expected upwards of 800 metres
>1,000 specimens
– a “mere” 1.6 to 2 deaths per 100,000 inhabi- Abundance 2009. Source: State Institute for Environment and Smaller stands
Nature Conservation (LUBW) Larger stands
tants. These projections only apply, however, if
no adaptation measures are taken. The allergy-producing ragweed plant is spreading
15Low water levels in summer,
flooding in winter
First the good news: our groundwater will continue to
supply us with drinking water for a long time to come.
Nonetheless, climate change will have a tangible effect on
the water balance.
Baden-Württemberg is well endowed with directly as drinking water and for agricultural
groundwater and will continue to be so in the irrigation, or indirectly as a coolant for power
future. Climate scientists do not believe that stations and a medium for transport by ship,
there will be any major change in the volume they also influence the ecological status of
of annual rainfall. What will change, however, is bodies of water themselves and of water quality.
the distribution of precipitation. The summers
are already drier and winters wetter than in the Baden-Württemberg is a partner in the KLIWA
past. This is due to the increased prevalence of (climate change and the consequences for wa-
Water
westerly weather patterns and associated rain- ter management) collaborative project. The ob-
fall during the winter months. This is also the jective of KLIWA is to study the consequences
reason for the more frequent occurrence of of potential climate change on the water bal-
flooding in the last 30 years. ance of particular river basins, to identify -
management
16
Changes in the water balance not only have an
immediate impact on the way water is used
impacts and make recommendations for water
resource planning.1.7°C. Thermometers may even measure in- However, it is not just inland navigation which
creases in temperature of up to 2°C in the suffers from low water levels. Agriculture and OPPOrtunities and
months from December to February. This me- the energy industry also struggle with the effects
Facts risks FOr water
ans that more of the abundant precipitation of dry periods. The economic costs of the hot
brought by weather patterns from the west will and dry summer 2003 were higher than those management
fall as rain rather than snow. As a result rivers for the catastrophic floods along the Rhine,
will probably burst their banks more often. Oder and Elbe. Drought periods affect much
larger stretches of land – and consequently the
While some regions can expect up to 35 per water balance as well as flora and fauna – for
cent more precipitation in the winter, water much longer periods of time than do floods. OPPOrtunities
increasing Frequency OF levels will fall in summers, which are expected
extreme water levels to be up to 10 per cent drier. The probability of • Baden-Württemberg continues
to have plentiful groundwater
The climate simulations performed in the a very dry growing season has increased six fold
framework of the KLIWA project show that by since 1985.
2050 temperatures may have increased by 0.8 to
climate imPacts – water management
risks
• Damage caused by more floods
• Higher flood protection costs
• Low water levels impede inland navigation
• Water shortages can result in a lack
of cooling water for nuclear and
conventional power stations
Danube flood in Riedlingen in 1990. Low water level on the River Murg in 2006.
17flood prevention measures are also particularly from Karlsruhe to Wertheim and by 25 to 50 and temporary bottlenecks in water supplies.
important. per cent longer north of this line. However, this A number of measures will have to be taken to
imPact/ is not the worst case. If the temperature rises deal with these supply shortages, including
PersPectives FOrced hOlidays FOr inland more than expected, low water discharges and continuing the development of networked
waterway carriers? periods might develop even more adversely. regional and supra-regional solutions and more
While the danger of flooding in the winter will The low water management forecasts produced efficient methods of agricultural irrigation.
become more acute, rivers will have much less by the State Institute for Environment and Na-
water from June to November. The drop in ture Conservation (LUBW) can already be used In the winter, on the other hand, longer phases
water levels will be particularly marked in the for low water management purposes. of continuous rain may lead to higher ground-
south-west and south-east of Baden-Württem- water levels in the future – a factor which
One FactOr in climate change berg. Lower water levels are caused by long dry the water under Our Feet might need to be taken into account when
Flood barriers are often built on a scale de- periods. Lack of precipitation will be exacerba- As annual precipitation is not expected to designating building areas which may be sus-
signed to cope with exceptionally severe floods ted by water losses from higher evaporation as change dramatically in the near future (2021– ceptible to water logging.
which, statistically, only occur about once a a result of higher air temperatures. This means 2050), only small deviations in average annual
century. High-resolution climate models show that low water periods during the summer groundwater recharge are anticipated. Nonethe-
that the levels of almost all rivers rise owing to months will last for longer in most regions: less, longer dry periods during the summer
flood discharges in winter. This is taken into more than 50 per cent longer south of a line months may, as is already the case, lead to local
account in the dimensioning of new flood
barriers. The impact of climate change is taken
into account in calculations in the form of a climate change FactOrs
climate change load condition. In the event of a An addition factor to the once-in-a-century
“once-in-a-century” flood in the period up to flood discharge in the dimensioning of flood
barriers takes account of the potential im-
2050, for example, around 15 per cent more pact of climate change. The spillway crest
helps to prevent flood barriers being
water would flow along the Neckar. This water
breached by wave and wind build-up.
flow volume is calculated into the dimension-
ing of new building structures with the factor
1.15. Bridges will also be built on a much larger
scale if required and dams and embankments
planned in a way which allows them to be
raised in the future. Alongside strategies for
action to provide technical flood protection,
18There are already signs that the temperature of
surface water has risen as average air tempera- develOPment OF winter PreciPitatiOn tO
tures have gone up. This could have serious
regiOnal imPact implications for the complex relationships
2050
within the ecological system of the lake. As
winters become increasingly milder surface
water will no longer able to cool down enough
mannheim
to be able to penetrate through to the deepest
parts of the lake. This will impair the oxygena-
tion of deeper waters, which is important for
stable layers in lake cOnstance the lake’s ability to support life at these depths karlsruhe
Lake Constance, Europe’s largest reservoir of and which also influences the breaking down of
potable water, supplies over four million nutrients in the sediment.
stuttgart
people with drinking water. A KLIWA project
has studied the impact of climate change on the
hydrophysical processes in Lake Constance, in-
climate imPacts – water management
ulm
cluding temperatures, thermal layering and ver-
tical circulation.
water and air temPeratures in and On lake cOnstance (1962–2010)
Freiburg
13
Temperatures of near-surface water
measured in the middle of the lake and
konstanz
air temperatures measured by the Kon-
12
stanz meteorological station. Source:
KLIWA Monitoring Report, 2011
11
Percentage change in total
Degrees centigrade
Air temperature near Konstanz precipitation
10
Trend 1962 to 2010 2.1 – 5.0
Trend 1947 to 2010
9 5.1 – 10.0
Mid-lake water temperature at a 10.1 – 20.0
9 depth of approximately 0.5 m Percentage change in total winter (Nov-Apr) precipitation. 20.1 – 30.0
Lakes
Trend 1962 to 2010 The period 2021 to 2050 was simulated with reference
Rivers 30.1 – 50.0
7 to 1971 to 2000. Source: LUBW, 2007: KLIWA
1945
1950
1955
1960
1965
1970
1975
1980
1985
1990
1995
2000
2005
2010
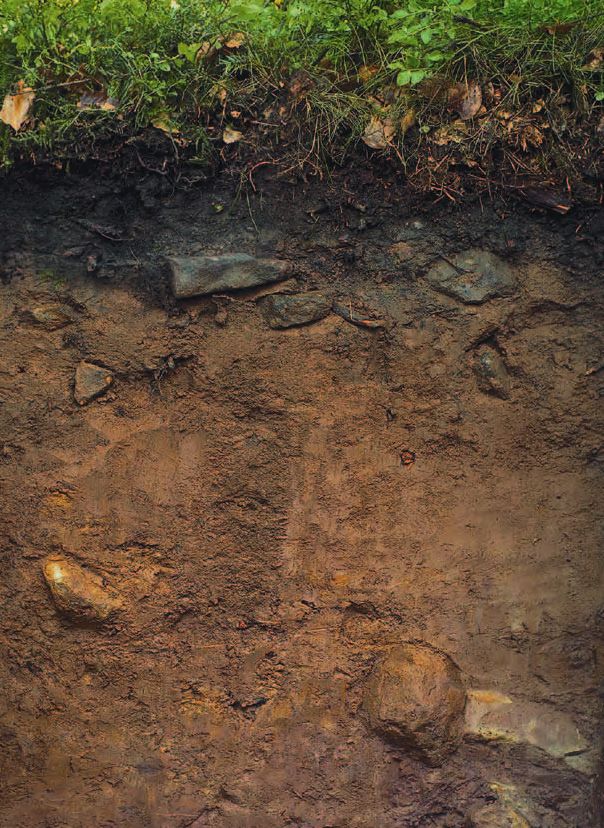
19The interplay of soil
and climate
Soil conservation and climate change mitigation are
closely connected. There is a real danger, however, that
increasingly heavy rains will literally wash top soils
down the drain!
Soils play an important role in climatic pro- can lead to more than fifty years of soil form-
cesses. Soils are directly affected by future cli- ation being lost in one fell swoop. Losses of soil
mate changes. At the same time, however, cli- material damage soil fertility, cause agricultural
mate-related changes in the material and energy losses and harm the environment as con-
cycles in the earth in turn influence the climate siderable quantities of humus and nutrients are
itself. Soils can also respire or sequestrate cli- lost with eroded soil. Damage is also caused
mate-relevant gases. Bog habitats and other away from erosion areas. Bodies of water can be
soils with high concentrations of organic matter polluted with nutrients and contaminants.
are especially sensitive to changes in use and Mitigating climate change is therefore one way
climate. of helping the soil. And vice versa, protecting
soils and bog habitats in particular is also a way
It takes a long time for soil to form – in fact, at of mitigating climate change.
Soil conservation
20
most 0.1 millimetres of new soil is created every
year. An extreme precipitation event, however,it would also have to be possible to use crops gas (N2O), which has an around 300-fold more
grown on grassland, for example. Bog habitats powerful greenhouse effect than CO2, escapes OPPOrtunities and
are a special case: these wetlands are considered from soils, for example. The tilling of grassland
Facts risks FOr sOils
to be all but climate neutral. Bog habitats into arable land releases nitrogen reserves and
which are drained and intensively cultivated nitrous oxide into the atmosphere as tilling
release the carbon which was previously stored breaks down the humus. The extent to which
in peat as CO2. nitrous oxide is released depends on a number
OPPOrtunities
sOil as a carbOn sink
Soils are our planet’s second largest natural • Increased biological activity
reservoir of carbon after the world’s seas and
• Faster soil warming in spring
oceans. Around 450 million tonnes of organic
matter and with it 1,651 million tonnes of CO2
are stored in depths of up to one metre in the
climate imPacts – sOil cOnservatiOn
soils of Baden-Württemberg. The way soils are
used and cultivated can have an influence on Bog lake in the Black Forest
the role of soils in the carbon cycle. Just by risks
switching to no-till farming or converting from Flat lowland moors are the most common type of factors, such as soil compaction or soil water
arable land to grassland would increase the hu- of bog habitat in Baden-Württemberg. A study content. Soils which have been particularly • Potential decrease in humus concentration
mus content of soils up to an equilibrium status of the Donauried fluvial topography has shown intensively fertilized with organic or mineral
and with it carbon dioxide, at least in the upper that drainage and agricultural use has resulted matter with a high nitrogen content are most • More erosion from heavy rain
soil layers. For example, it is estimated that zero in average peat extraction of 7.2 mm a year from likely to produce much higher emissions of
• Washing of nutrients and pollutants into
tillage would trap 1.3 tonnes of carbon dioxide lowland moors during the measurement period nitrous oxide. Nitrogen fertilisation tailored
bodies of water and other ecosystems
per hectare and year, and that conversion to of 1951 to 1990. This is equal to the release into to the real needs of crops enables farmers to through erosion
grassland could sequester around 4.9 tonnes of the atmosphere of around 23 tonnes of CO2 per reduce the amount of nitrogen being released.
carbon dioxide in every hectare of soil. How- hectare every year, twice as much as annual per
ever, there are limits to how far these measures capita CO2 emissions in Germany. How-
can be applied in practice. Continuing sustain- ever, soils are important not only for the carbon
able land management would be essential and cycle, but also for the nitrogen cycle. Laughing
21continues throughout the cold season. Initial which land is put. For this reason work is
estimates suggest that global warming of two underway as part of a KLIMOPASS research
imPact/ degrees would reduce humus stocks under project on developing a way of studying the
PersPectives grassland and forests by 20 per cent. In bogland impact of both factors on the volume and
habitats such as the Donauried the destruction quality of humus.
of peatlands may be accelerated by climate
change. Other BWPLUS and KLIWA research projects
will examine the climate relevance of wetlands
research and actiOn FOr the in Baden-Württemberg as well as the future
sOil impact of soil erosion caused by heavy precipi-
the declining PrOductivity OF The humus content of soils is influenced not tation.
sOils only by climate factors, but also by the use to
The impact of climate change on soils in Ba- Erosion damage after heavy summer rain
den-Württemberg can only be described in
qualitative terms at present. No precise figures
or local projections are available, although the
effects described in the following may probably
be expected.
If there is more rainfall in the future, suscep-
tible soils in areas such as in the Kraichgau
region will suffer from greater water erosion.
The loss of humus and nutrient-rich top soils
will also lead to soil degradation. The humus
content may also fall. Dry summer periods will
affect soils influenced by groundwater and/or
perched water in particular. Organic substances
which were previously conserved by excluding
air (inundation) decompose faster when ex-
posed to air. Warmer and damper winters may
mean that this mineralisation process even Lowland moorland put to agricultural use Eroded earth on agricultural track
22Whether and to what extent the effects des-
cribed will actually materialise can only be sOil erOsiOn atlas
determined on the basis of precise information
regiOnal imPact about soils, their use and the relevant climate
influences. Erosion, for example, does of course
affect very large areas which are already suscep-
tible. These include parts of northern Baden in
particular, such as Kraichgau or the mid and
south-eastern Upper Rhine lowlands. Earlier
studies measured soil losses in Kraichgau of
kraichgau lOsing grOund over 80 tonnes per hectare and year. Whether
The impact of climate change differs both heavy rains will fall more frequently in these
regionally and locally. It is particularly impor- areas in the future and whether this will
tant in the case of soils that consideration be heighten the danger of erosion is the subject
given to the different effects of climate change of current research work.
from one location to the next.
climate imPacts – sOil cOnservatiOn
Area-weighted soil erosion on arable land. Erosion in 0.0 - 1.0 4.1 - 5.0
tonnes per hectare and year 1.1 - 2.0 5.1 - 15.0
Source: Gündra et al., 1995: Soil erosion atlas of Baden-
2.1 - 3.0 > 15.0
Württemberg, Agrarforschung in Baden-Württemberg,
3.1 - 4.0 Mean inclination on
Volume 24, Stuttgart.
arable land > 12 degrees
Extensive soil erosion
23Global warming winners
and losers
A glance into a hotter future: less winter wheat, more
maize and – unfortunately – more pests and diseases as
well.
Highly-industrialised Baden-Württemberg is to some extent damper or, in places, drier, this
still agricultural in character. Forty-one per cent will have a dramatic impact on the agricultural
of the land is used by farmers, gardeners and sector. Ultimately, of course, plant growth
winegrowers. Of this land 58 per cent is used depends crucially on warmth and water. Even
as arable land and 38 per cent as grassland. small increases in temperature can make entire
Vineyards, vegetables and fruit are grown on crops wilt or flourish.
just four per cent of farmland. However, it is
these specialty crops which promise the biggest The State of Baden-Württemberg has tasked
profits. the KLARA project with studying probable
changes in agriculture drawing on the example
With average annual temperatures of over 9°C of important crops. Maize generally thrives at
in the last decade and a vegetation period of higher temperatures, wheat needs more water,
170 days, the south-west is already one of the fruit and wine may be threatened by pests.
Agriculture
24
warmest parts of Germany. If the climate in
Baden-Württemberg becomes even warmer andinsect pests. The effect of warm weather on the experiments involving treating wheat and
main pest, the codling moth, has been simu- potatoes with higher CO2 concentrations OPPOrtunities and
lated for the Lake Constance area. The codling showed that while yields improved, the quality
Facts risks FOr agriculture
moth’s larvae eat their way through apples and deteriorated. This is because the protein con-
other pomaceous fruit. The greatest damage is tents of harvested products declines. Higher
inflicted by the second generation of maggots protein contents are especially important in
in the year, which is more likely to appear as baking-quality wheat and determine how much
temperatures rise. In southern Europe the moth farmers can get for their produce.
even has three generations a year.
OPPOrtunities
the aPPle will struggle The cultivation of late-ripening varietals was
• It is also possible to grow maize
Apple scab is one of the most dangerous still restricted to small areas along the Upper in higher areas
diseases affecting fruit growing. This fungus Rhine Valley and in Württemberg up until the
reduces yields by up to 70 per cent and leads 1960s. These areas grew in area during the • Late-ripening varietals thrive
to brown lesions on the fruit which make it 1990s.
• Cultivation of new strains and
unmarketable. As with most types of fungus, species of crop
apple scab likes warm and damp weather. As As the atmospheric concentration of CO2
well as an increase in regional fungal attacks, has increased, so has the photosynthesis per- • Higher yields from some types of crop
fruit growers will also have to cope with more formance of some crops. The first field-grown Adaptation of wheat varieties may reduce crop losses
climate imPacts – agriculture
generatiOnal develOPment OF the cOdling mOth in the lake
cOnstance regiOn
risks
3rd generation • Heat/dryness may reduce yields from
Change in the generational sensitive crops (such as winter wheat)
development of the codling moth
2nd generation (Cydia pomonella) in the Lake • Pests may occur several times a year and
Constance area (the size of the
new pests establish themselves
symbol corresponds to the
frequency of climatically advanta-
Oviposition
1st generation Hatching geous years for the development • Better conditions for certain types
Imago
of the phenological stage) of fungal diseases
Development stages (1951-2000) Source: Potsdam Institute for Cli-
Previous year’s generation Development stages (2001-2055)
mate Impact Research (PIK),
2005: KLARA
May June July August September October
Date
25aubergines or artichokes, in the open air. On the
other hand, fruit growers will have to contend
imPact/ with significantly more scab disease (Venturia
PersPectives inaequalis) as the danger of infection with fun-
gal spores is much higher in the damper spring
months. Flourishing fungi may also prove pro-
blematic for grape vines. Higher temperatures
favour the development of several generations
of pests. The codling moth, for example, may be
expected to produce a second generation of Maize fields will also thrive at higher altitudes in the future
maize yields may rise even maggots in two of every three years instead of in
Further one of every five as has been the case to date. to adapt their growing activities to climate prohibited from using synthetic pesticides are
Global warming could bring about an increase change much faster. This will not only demand likely to be particularly hard hit and will have to
in the amount of maize grown in south-west 2003: the shaPe OF things tO more work on breeding new varieties of plants invest in the selection of pest-resistant crops.
Germany and result in this feed and energy crop cOme? but also adaptations in crop rotation, sowing,
flourishing in areas which were previously too The extremely hot summer of 2003 may well fertilisation, tillage and pest control. Valuable
cold or high. In contrast, the findings for the re- have given us a glimpse of what the future crops will also need more watering and irriga-
gions modelled in KLARA show that winter holds in store. The Augustenberg Agricultural tion to secure yields and quality.
wheat yields will fall by an average of 14 per Technology Centre has evaluated yields right
cent. However, the KLARA research project across Baden-Württemberg and come to the higher Plant PrOtectiOn cOsts
does not take account of the potential CO2 conclusion that harvests declined from the Farmers may be able to compensate for lower
impact of fertilisation. The extreme summer of previous year according to crop by between winter wheat yields by sowing more baking-
2003 demonstrated that the assumed competi- twelve per cent (winter wheat) and almost quality wheat, in other words crop plants with
tive advantage of maize can only be realised if thirty per cent (sugar beet). The only crop higher protein content. A similar picture
sufficient water supplies are available. which produced higher yields was summer emerges when switching from silage maize
barley. The findings vary according to crop and (feedstuff) to grain maize (food). All in all,
Crops such as soya and sunflowers, which prefer region. The impact of the hot summer was farmers – and not just fruit growers – will have
warmer climes, may be planted more exten- much greater in the typically warm district of to do more to protect plants from an anticipat-
sively, whereas sugar beet cultivation will de- Karlsruhe than in the cooler and rainier district ed increase in insect pests and plant diseases
cline. It should be possible to grow certain types of Heidenheim, for example. This means that and will therefore have to budget for correspon- Invasive fruit crop pests encouraged by climate change. Droso-
phila suzukii (“spotted wing drosophila”)
of vegetables, such as red or green peppers, farmers working land in warmer areas will have dingly higher costs. Organic farmers who are
26north east in particular. Viticulture will probably
be least affected by climate change. The Huglin the viticulture POtential OF wine-grOwing
index shows where different types of vine deve-
regiOnal imPact lop and grapes ripen best. Specifically, the index
regiOns uP tO 2030
measures the sum of mean and maximum warm
temperatures in the period from April to Sep-
tember. As a rule, the higher the temperature is,
mannheim
the more late-ripening varieties growers are able
to cultivate. While a variety such as Müller-
Thurgau can cope with a Huglin index of 1500, a
the sOuth and nOrth-east will Merlot needs 1900.
beneFit; winegrOwers may be
least aFFected Yields have been stable since the 1990s with
Water shortages will probably result in reduc- relatively little fluctuation from one year to the
tions in yields of winter wheat and maize in the next. These low crop losses are due in part to
central Rhine Graben. In contrast, harvests in fewer bud-damaging winter frosts as well as the
southern and north eastern parts of Baden- improved wood maturity which comes from
Württemberg are likely to improve (maize) or at higher overall temperatures. This trend is likely
least only be marginally reduced (wheat). More to continue through to 2030. Winegrowers can
climate imPacts – agriculture
grain maize will probably be cultivated in the rely more on late-ripening varieties in the future.
huglin index
2000
The Huglin index is the sum of mean temperatures between 1900
April and September. The index helps to classify the viticulture
1800
potential of various regions
Source: Potsdam Institute for Climate Impact Research (PIK), 1700
2005: KLARA 1600
Winegrowers benefit from climate change: Late-ripening varieties can be grown over much wider areas
27The changing face of
Germany’s forests
Hot and dry summers as well as recurrent storms will
put the adaptability of trees and forest habitats to a
severe test.
With around 1.4 million hectares of forest – Climate change is already apparent in the forest:
or 38 per cent of its total land area – Baden- trees and plants shoot, flower and bear fruit
Württemberg is the state with the second earlier. In damp areas this results in rampant
largest expanse of forestland in Germany. growth with more wood, whereas in other areas
Woodland in the south-west of the country tree species, such as spruce in warm and dry
is correspondingly valuable, both ecologically regions, are being forced back. Whether storms
and economically. In an age of climate change are likely to become more frequent and pests
forests play an invaluable role in storing carbon more prevalent as the climate changes cannot
by absorbing CO2 from the atmosphere and (yet) be proven with absolute scientific certain-
sequestering it in wood. At the same time, ty. There are still many issues which need to be
global warming is also having a powerful impact clarified. The facts are important, bearing in
on our forests. This is because, in addition to mind that forest owners in particular need to
other factors, the climate also determines be able to think and plan over the long term.
which species of tree can flourish and spread.
Forestry
28
But which species of tree will be particularly
suitable for the climate of the future here in
Baden-Württemberg?You can also read