Climate Change in Spain: Friend and Foe -Causes, Consequences and Response- WP 26/2008 Lara Lázaro-Touza - AdapteCCa
←
→
Page content transcription
If your browser does not render page correctly, please read the page content below
Climate Change in Spain: Friend and Foe –Causes,
         Consequences and Response–

                Lara Lázaro-Touza

                    9/6/2008

                   WP 26/2008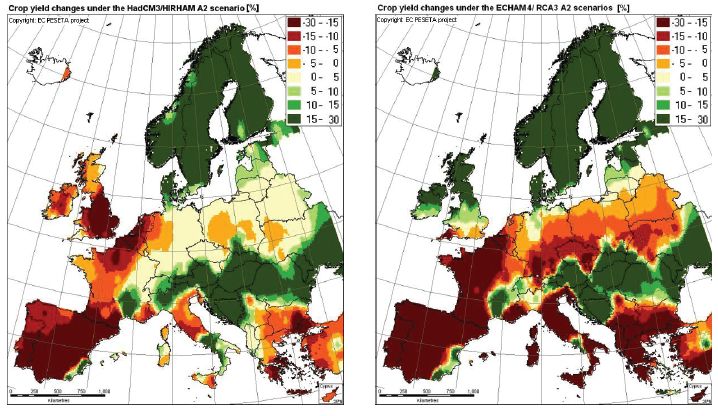
Climate Change in Spain:                             Friend        and       Foe       –Causes,
Consequences and Response–
Lara Esther Lázaro Touza

Summary
Climate change is unequivocal and Spain is one of the most vulnerable countries within
the EU. The consequences of global warming will bring about higher temperatures,
average sea level rises and a reduction in water availability, among others. The
consequences for the Spanish economy will vary depending on the sector analysed.
Tourism, the construction sector and the insurance sector stand to lose if mitigation and
adaptation are further delayed.

Spain’s international commitments in the fight against climate change after the
UNFCCC, and more so after ratifying the Kyoto Protocol, have spurred a host of
institutional responses. These responses are depicted along with the key opportunities
and challenges for the post Kyoto period.

Available cost estimates of climate change are presented. Mitigation and adaptation
costs are also analysed, highlighting the preliminary nature of current studies and the
need to broaden the knowledge of the economic costs of our actions.

Introduction
Climate change can be loosely defined as the alteration in climate patterns. According to
the UNFCCC1 this phenomenon ‘means a change of climate which is attributed directly
or indirectly to human activity that alters the composition of the global atmosphere and
which is in addition to natural climate variability observed over comparable time
periods’ (UN, 1992, p. 3). The complexity of the climate system and the limitations in
modelling imply that predictions are necessarily uncertain to an extent. There exists,
however, a broad scientific consensus regarding the unequivocal warming of the earth.
Global warming and its associated damages bring about the need to limit the
concentration of greenhouse gases (GHG) in the atmosphere in order to minimise the
possibility of a dangerous interference with global climate stability. The EU’s
recommendation is to limit GHG concentrations in the atmosphere to 550ppm2 and limit
temperature increases to 2ºC, as global average temperature increases above this will
most likely imply irreversible effects (Abanades García et al., 2007). The Stern Review
states that this stabilisation target will imply allowing GHG emissions to peak in the
next decade or two and then ensuring a decline in GHG emissions of between 1% and
3% per year.3

Climate change has both positive and negative consequences.4 The developed countries
located in the North might benefit from higher agricultural yields (harvesting plant
varieties that had hitherto been unable to grow in colder areas), reduced heating

1
  UNFCCC is the acronym for United Nations Framework Convention on Climate Change.
2
  Ppm means parts per million.
3
  For additional information see Lara Lázaro (2007), ‘Climate Change: Cherry-picking Alarmists or Time
to Eat at the Table?’, ARI nr 72/2007, Elcano Royal Institute.
4
  For a limited temperature increase (2-3ºC).

                                                                                                     2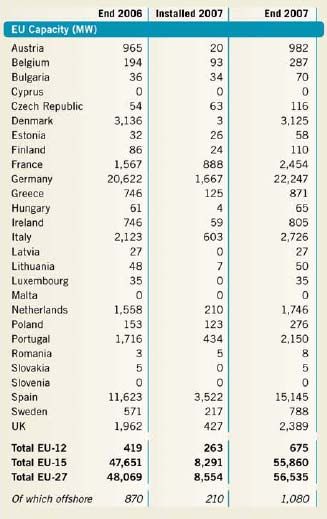
demands and a reduction in the number of cold-related deaths, among others. These
countries are nevertheless exposed to temperature increases and sea level rises that can
alter ecosystems, human health and economic activities. Damages from climate change
will not be evenly distributed among countries. Developing countries and some
developed countries located in the South of Europe such as Spain will suffer the
consequences of more severe and more frequent extreme weather events, reductions in
rainfall, increases in heat-related illnesses and deaths plus the displacement or decline of
certain economic activities. Eastern and Mediterranean Europe is expected to suffer
more floods and more frequent and severe droughts (EEA, 2007). Overall, the greater
the rise in temperatures the more severe the consequences of global warming will be.

The problem we face is a global one in need of broad and deep international agreements
that take into account each country’s responsibilities and damages. Countries will
therefore have to make individual efforts to mitigate GHG emissions according to the
principle of shared but differentiated responsibilities. Additionally, all countries will
adapt to global warming to a greater or lesser extent depending on the damages caused
to their territory and on their adaptation capabilities. This paper focuses on the causes
and consequences of climate change in Spain as well as the actions taken and planned to
mitigate and adapt to one of the greatest threats of the 21st century. The analysis will
conclude with a presentation of the latest guidelines for the post-Kyoto negotiations.

Causes of Climate Change and the Main Consequences for Spain

In a nutshell, the process of anthropogenic climate change originates from human
activities in the form of production, consumption and distribution processes and
population growth. Human activity entails emitting greenhouse gases which trap heat,
thus warming the Earth. In Spain, the main activities that contribute to GHG generation
and accumulation in the atmosphere are mainly related to the production and use of
energy, agriculture, stockbreeding and industrial activity. Graph 1 shows the breakdown
of the main sectors’ contributions to GHG emissions.

Graph 1. Spain’s GHG emissions in 2006 by sector

            Energy and non-energy emissions in % (Spain
                              2006)

                           2,9
                      11                           Energy

                7,6
                                                   Industry (Non-combustion)

                                                   Agriculture and
                                                   stockbreeding
                                                   Waste
                                    78,5

Source: data from Nieto and Santamarta (2007).

The main sectors that contribute to energy derived emissions are: electricity (24.04%),
road transport (21.66%), industrial energy consumption (16.33%), residential uses (6%),
oil refining (3%) and services (2.8%).

                                                                                          3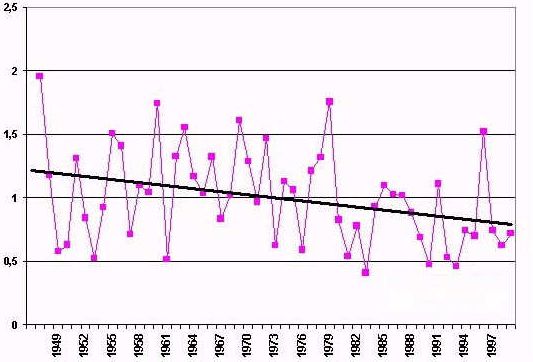
The consequences of climate change in Spain are being analysed by a growing number
of institutions. To date, the most comprehensive study5 is the one developed by Moreno
et al., (2005) and the following analysis draws on this assessment as well as on the
IPCC’s 4AR,6 Martín Vide (2007), the EEA (2007), Abanades García et al., (2007), and
others. The overall impact of climate change throughout the 21st century will be
increasing temperatures and average sea level rises. Temperature increases will be more
severe during the summer and inland. Rainfall trends are harder to predict, but both past
trends and projections show a reduction in expected rain and lower water availability
that will be discussed below. Temperature anomalies will become more common with
more days reaching maximum temperatures. These tendencies will be exacerbated the
higher the concentration of GHG in the atmosphere. Different ecosystems and activities
will be affected in Spain. The main consequences can be summarised as follows:

Terrestrial Ecosystems
According to the IPCC (4AR), the resilience of many ecosystems is likely to be
exceeded during the 21st century. Ecosystems will experience alterations in periodic
and seasonal plant and animal behaviour (eg, birds will alter their migration habits). For
example, in Spain, Catalonia has recorded tree leaves unfolding 20 days earlier
compared with their sprouting period 50 years ago. The extent to which affected species
will be able to adapt is uncertain. Changes in the interaction of species will take place
and we can expect increases in plagues and invasive species which cause biodiversity
losses (as invasive species can appropriate the niche of native species and thereby
displace them). These effects will be more severe in previously vulnerable isolated areas
and islands, among others. Given that preserving these ecosystems can run against the
development of other economic activities (eg, preserving forests can run against land
use planning decisions, for instance), the recommendations are to implement holistic
management schemes in which competing interests are taken into account. The long-
term follow-up of terrestrial ecosystems from a multidisciplinary stance is
recommended, along with determining tolerance levels with regards to climate change.

Aquatic Ecosystems
Both inland and marine aquatic systems will be affected by climate change. Lakes,
rivers, coastal wetlands and lagoons will be among the most severely affected. In
coastal areas the expected sea level rise is projected to be between 10cm and 68cm by
the end of the century, with a 50cm average sea level rise as a reasonable forecast
(Moreno et al., 2005). The main areas affected by floods include the Cantabrian Coast
and the deltas of the Ebro and Llobregat and the coast of Doñana among others.
Buildings and infrastructures in these areas will suffer the consequences of the expected
rise in the sea level.
The productivity of certain commercial varieties is expected to decline, especially
boreal species. Additionally, species such as the jelly fish are expected to become more
frequent, especially in Catalonia, Mar Menor and the Canary Islands. Both warmer sea
temperatures and increases in organic nutrients in the water are suspected to favour this.
The effects of having more jelly fish in our beaches are as yet impossible to know with
any degree of certainty but the phenomenon is expected to reduce tourism in the
affected areas. On a brighter note, subtropical species such as the marlin will increase,
partly offsetting the decline in other species.
5
 To the author’s knowledge.
6
 IPCC (4AR) is the acronym for the Intergovernmental Panel on Climate Change Fourth Assessment
Report.

                                                                                                 4
Water Availability
Reductions in water resources and a greater variability in the availability of water are
both expected throughout the century. Simulations made by Moreno et al., (2005) tell us
that for a 1ºC increase in temperature there will be a 5% drop in rainfall which will
mean a reduction in water availability of between 5% and 14% by 2030. This reduction
in water resources can grow to 20% by the end of the century. The Canary Islands and
the Balearic Islands will be the most affected regions along with the Guadiana,
Guadalquivir, Júcar and Segura river basins. Uncertainties in regional precipitation
projections are still significant according to the IPCC (2007) and to Martín Vide (2007)
and further research and modelling should emerge from ongoing research to provide
better estimates in this area. In any case, the available data for Spain from 1875 to the
end of the last century points to a drier south, no significant change in the central part of
the peninsula and a slight increase in rainfall in the North-West (see Map 1).

Source: translated from Martín Vide (2007, p. 23).

Data from the National Meteorology Institute depict a statistically significant decrease
in winter rainfall in Spain (which is the main component of our rainfall according to
Ayala Carcedo, 2004) in the last half of the XX century (see Graph 2).

Graph 2. Annual winter rainfall in Spain in the last half of the 20th century

Source: Ayala Carcedo (2004).

The expected trend throughout the 21st century will entail a reduction in annual rainfall,
particularly during the latter part of the century and during the spring. The area to be
most affected will be the South-Eastern part of the Iberian Peninsula. This tendency is

                                                                                           5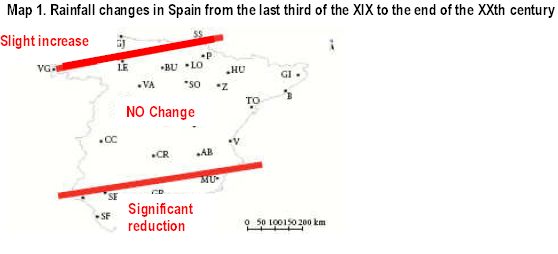
however reversed in the North-West, where rainfall is expected to increase. Reduced
rainfall and droughts have already caused damage to the Spanish economy, costing over
€3 billion in losses in 1999 (EEA, 2007).

Biodiversity
Although there are many definitions, according to the Convention on Biological
Diversity (CBD, 1992, article 2) biodiversity is ‘the variability among living organisms
from all sources including, inter alia, terrestrial, marine and other aquatic ecosystems
and the ecological complexes of which they are part; this includes diversity within
species, between species and of ecosystems’. Spain has a large share of the EU’s plant
diversity and it is also considered to be the richest in terms of animal diversity.
Moreover, we also have a significant proportion of endemic species. Spain’s
biodiversity losses are therefore relevant in terms of a wider geographical scope
especially because of the phenomenon’s irreversible nature. The effect of less water
availability and changes in rainfall patterns will lead to a more Mediterranean North and
a more arid South in Spain. Forests in the South, mountain vegetation and coastal
vegetation are among the most vulnerable. In addition to these effects, changes in
migration and reproduction patterns are expected. This will affect different species in
different ways thus leading to declining numbers in the most vulnerable species and to
the displacement of other species towards the North.

Soil Resources, Forests and Agriculture
The expected consequences of climate change in this area will include an increase in
desertification (which already affects 31.5% of our territory, Abanades García et al.,
2007), erosion, salinisation, changes in forest species and a higher risk of fires. The
presence of organic carbon in our soils (essential to soil fertility) is expected to decrease
between 6% and 7% for every degree in temperature increase, especially in more humid
areas such as the North of Spain and in forests. Tree mortality is also expected to
increase as the temperatures rise (EEA, 2007).

The agricultural sector presents a mixed picture with higher agricultural yields, due to
greater photosynthesis in the North of Spain, and reductions in agricultural yields in the
South. For higher emission scenarios, however, Spain’s agricultural yields are projected
to exhibit significant reductions in most parts of our territory. According to EEA (2007),
crop yields are expected to record reductions of between 15% and 30% for most parts of
the country (see Map 2).

                                                                                           6
Map 2. Simulated crop yield changes by 2080 relative to 1961-90 according to IPCC’s A2 scenario
Source: PESETA project in EEA (2007), p. 48.
The Energy Sector
Temperature increases of 3ºC are said to cause a 10% variation in energy consumption
(Lloyd’s, 1999, in Moreno et al., 2005). Climate change is expected to lead to increases
in the demand for electricity, oil and gas in Spain. Temperature increases and the
reduction in water availability will reduce the production of hydraulic energy and
biomass. Solar energy, which is said to hold the greatest potential, will furthermore be
boosted by more hours of sun. Wind energy, that has seen the greatest growth in recent
years, can also benefit from expected stronger winds. The EU’s determination to move
towards a greater use of renewable energy and Spain’s vast potential in wind capacity
make this strategic sector an attractive one. Table 1 compares the installed wind power
across the EU.
7Table 1. Installed wind power in the EU in 2007
Source: EWEA, in Rodríguez Ruiz & Martínez Palacio (2008), p. 53.
Renewable energies, such as onshore wind power, are cleaner (compared with oil or
gas, for example) in terms of GHG emissions. No energy source, however, is free from
problems. For instance, onshore wind power has faced opposition due to the impact on
certain bird species such as the Griffon Vulture. According to experts from CSIC7 the
overall impact on birds from onshore wind power is of low to medium intensity
compared with the number of deaths caused by road collisions, for example. This,
however, seems unsurprising given the lower number of wind generators compared with
the number of roads and their length in kilometres. The design of models to predict
which areas are used by the most vulnerable species, plus the search for scientific
consensus and action protocols to help decide which areas should be avoided when
planning wind power installations, is paramount to minimise the opposition to this
renewable energy source.
The Tourist Sector
Given the strategic economic relevance of the tourist sector for the Spanish economy
(10.8% of Spain’s GDP in 2006)8 it is important to be aware of the main consequences
of climate change in this area. Global warming will entail changes in tourist activities
mainly for ‘sun and sand tourism’ and for ‘snow-based tourism’. Climate change will
7
CSIC is the Spanish acronym for Higher Scientific Research Centre.
8
Data updated by Spain’s National Statistics Institute (INE in its Spanish acronym) on 20 December
2007.
8mean more mountain trekking and less skiing, especially for resorts located below 2,000
metres. It will also bring about relative increases in inland stays versus coastal tourism.
In Madrid, for instance, the data available from one of the weather stations in
Navacerrada show a significant reduction in the number of days it snowed between the
1970s and the end of the last century. This will affect the quantity and the quality of
snow and is therefore expected to lead to a reduction in this type of activity.
Graph 3. Annual number of days in which snow was recorded in Navacerrada (Madrid)
Source: Ayala Carcedo (2004).
The peak tourist season might be altered and more tourists might arrive during shoulder
seasons (spring and autumn) and during the low season. Potential droughts and water
supply problems, especially on the Mediterranean coast, the Balearic Islands and the
Canary Islands, plus flooding of coastal areas, might hinder growth in this sector and,
unfortunately, risk and sensitivity maps are still part of our collective wishful thinking
in planning tourist and urban infrastructures. Overall, however, the picture is mixed –as
it has been for other areas of analysis– since the damages to more vulnerable areas
might be partially offset by the development of other tourist destinations. Protected
natural areas, the Northern part of Spain and different activities such as inland sports
and river sports may become increasingly attractive for tourists.
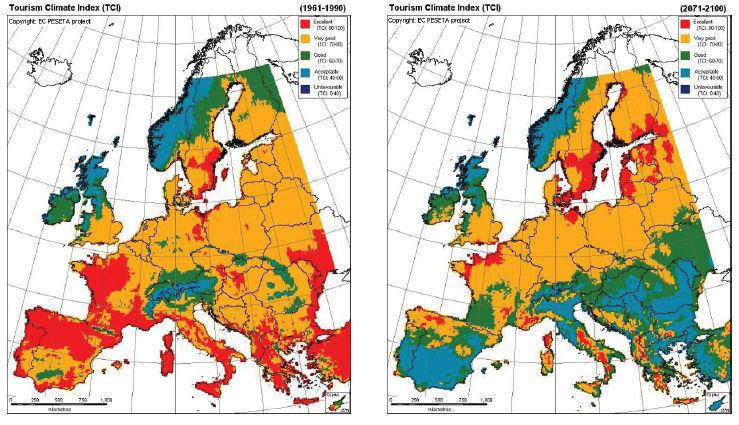
In any case, under high-emission scenarios, compared to other European tourist
destinations, greenhouse emission increases and their related consequences are expected
to reduce Spain’s attractive tourist profile in favour of Northern destinations. The
PESETA project9 estimates that high-emission scenarios will imply a worsening of
tourist conditions for the last third of the present century. These would deteriorate from
excellent (in red in Map 3 below), very good (in yellow) and good (in green) to mainly
acceptable (in blue).
9
The PESETA project is devoted to developing projections of the economic impact of climate change in
sectors of Europe based on a bottom-up analysis.
9Map 3. Simulated conditions for summer tourism in Europe for 1961-90 (left) and 2071-2100 (right)
according to a high-emissions scenario (IPCC A2); map prepared by EC JRC/IES
Source: http://peseta.jrc.es/docs/Tourism.html.
The Insurance Sector
According to insurance companies and IPCC reports, both the frequency and extent of
losses derived from climate-related events have increased. The data for Spain in this
area are limited according to Moreno et al. (2005) and thus both the information
presented and the conclusions drawn are to be taken with caution. Extreme weather
events such as floods, storms, rain, hail, high wind and damages caused by the sea have
been the most frequent occurrences in Spain in the data analysed. Of these events, 80%
are caused by floods and 40% of the damage has occurred in Valencia and Vizcaya,
with an even spread of the damage between the two areas. Mitigation efforts and the
adaptation of urban planning decisions to avoid particularly sensitive areas are
recommended in order to limit future increases in insurance premiums and
compensation payments. Despite other factors influencing the insurance sector, climate
change is expected to increase potential losses. The European Environment Agency
provides estimates of climate-related losses in 2004 and of expected losses for the EU,
the US and Japan (see Table 2).
10Table 2. Expected climate-related insurance losses
Projects Organisation Findings/Policy relevance
Assessed major property insurance markets and
the major weather perils affecting these markets:
US hurricane, Japanese typhoon and European
windstorm. Found that 2004 was the costliest year
A changing climate
Association of British for typhoon damage in the last 100 years. By 2080
for insurance (2004)
Insurers (ABI) by Climate the following are estimated:
Risk Management in • 65% increase in world-wide costs of major storms
Financial risks of
Cooperation with • 75% increase in costs of insured damage in a
Climate Change
Metroeconomica severe hurricane season in the US
(2005)
• 65% increase in costs of insured damage in a
severe hurricane season in Japan
• 5% increase in wind-related insured losses from
extreme European storms
Sigma study on
Found that in 2004:
natural catastrophes
• US$123bn total economic losses due to natural
and man-made
catastrophes and man-made disasters
disasters. Swiss Re Group
• US$120bn economic losses due to natural
Opportunities and
hazards
risks of Climate
• US$49bn insured losses
Change
Found that 2004:
• Was most expensive natural-catastrophe year in
Annual Review: insurance history to date.
Natural Catastrophes Munich Re Group • US$145bn economic losses due to natural
2004 hazards
• US$95bn economic losses due to wind storms
• US$44bn insured losses
Predicts climate change has the potential to
Climate Change and significantly alter and intensify destructive weather
Insurance: An patterns (US) with increased flooding, forest fires
Allianz Group and WWF
Agenda for Action in and storm damage. These changes could make
the United States insurance unaffordable for customers in high-risk
areas
Source: EEA (2007), p. 43.
Health
According to Moreno et al., (2005, p. 707), ‘Climate changes can specifically affect
temporal and spatial distribution, as well as the seasonal and interannual dynamics of
pathogens, vectors, hosts and reservoirs’. Atmospheric pollution, heat waves and cold
spells are related to higher rates of respiratory diseases, heart episodes and climate-
related deaths. Pregnant women, young children, poor people and the elderly are
considered the most vulnerable groups. According to the IPCC 4AR, with temperature
increases of 3ºC or more, the expected burden on health services will rise. Examples of
heat waves such as the one suffered in Europe in August 2003, which caused thousands
of deaths, will become more frequent and intense. Added to these, some disease vectors
such as dengue fever, malaria, West Nile encephalitis and ticks could increase, although
other factors such as increased travel to areas where these illnesses are more common
will also favour their spread. The preliminary nature of the analysis of the effects of
climate change on Spain again calls for caution in the interpretation of the data
presented above. The need for more research and more primary data seems to lie at the
heart of good policy making in this area in order to minimise the most damaging
consequences of climate change.
According to the EEA (2007), the development of information on the costs of climate
change is still at an early stage and the figures presented below are likely to provide the
lower bound estimates of the damages of global warming as many unquantifiable
damages are left out of the analyses. This is due to the fact that accurately estimating the
impacts of climate change is a complex endeavour. This is coupled with the difficulty in
11valuing these consequences in monetary terms, especially when non-use values, that can
only be captured by stated preference techniques, are large. Simplified climate models
and simplified ‘impact relationships’ lead to partial and uncertain outcomes. There are
damages that are not adequately captured by the models, there is uncertainty about the
exact damages and there may be losses that we are currently unable to predict. This
wealth of limitations and uncertainties plus the different assumptions made by
researchers might explain the disparity in the costs of climate change that are published
in different academic and policy papers.
Tol (2005) reviewed the literature on estimates of the marginal damage costs of CO2
emissions and concluded that they are unlikely to exceed US$50/tC.10 This figure
contrasts with the Stern review that estimates the marginal damage of a ton of carbon at
US$312/tC. The IPCC (2007) presents the figures for the social cost of carbon11 to vary
between US$-3 to US$95 per tonne of CO2 with an average value, among the peer-
reviewed estimates analysed, of US$12. Differences in parameters and assumptions
yield wide-ranging estimates and we are still far from a scientific consensus regarding
the cost of emitting GHG. Regional differences in exposure to climate change and
adaptation capabilities will imply damages are unevenly distributed and regional
estimates are therefore vital in order to understand the full extent of the consequences of
climate change for a given region.
At a global scale, the costs of inaction if temperatures rise above 2º-3ºC are expected to
damage almost all countries. For rises in temperatures above 4ºC, global GDP losses are
estimated at between 1% and 5% according to the IPCC. The costs of inaction on a
global scale for the Stern review are significantly larger, causing an indefinite drop in
global consumption ranging from 5% to 20% depending on the assumptions made.
According to the Spanish Office for Climate Change, there are no overall cost estimates
of climate change for Spain at present.12
Actions and the Cost of Actions for Spain
This subsection will present Spain’s most noteworthy actions to limit GHG emissions,
the main adaptation actions and the expected cost of these actions whenever the data is
available. The potential impact of climate change as well as the preliminary costs
presented above are a powerful call for action. Spain agreed to be part of the
international efforts to curb global warming. This commitment was put forth through its
membership of the United Nations Framework Convention on Climate Change
(UNFCCC), which was the first multilateral milestone in the fight against global
warming, and though its ratification of the Kyoto Protocol (KP). The KP was approved
by the third Conference of Parties (COP) in 1997 and entered into force on 16 February
2005 after Russia’s ratification in November 2004. At a global scale, the KP’s goal is to
reduce GHG emissions by 5.2% by the first commitment period (2008-12). As part of
the EU bubble that agreed to reduce its GHG emissions by 8% of its 1990 emissions,
Spain was allowed to increase its emissions by 15% for the first KP commitment period.
10
According to EEA (2007, p. 18), 1tC = 3.664tCO2, so a value of 100GBP/tC would be equivalent to
GBP27/tCO2.
11
Defined as the global discounted net economic damages of emitting GHG.
12
Current references on the latest estimates, although partial and uncertain, are in
http://www.ingurumena.ejgv.euskadi.net/r49-
435/es/contenidos/nota_prensa/markandya/es_prensa/indice.html (for estimates of the cost of climate
change in Bilbao) and the PESETA project (http://peseta.jrc.es/index.htm).
12The evolution of GHG emissions in Spain from 1990 to 2006 shows a significant
increase, well above its KP goal. The rise in GHG emissions has been coupled with an
increase in economic growth. The trend in Spain’s GHG emissions started to change in
2006 and a 4.1% decrease in GHG emissions was reported along with a drop in primary
energy consumption of 1.3% despite a 3.9% increase in economic growth (MMA, 2007,
and Nieto & Santamarta, 2007). Graph 2 illustrates historical emissions in Spain as
percentage increases compared to 1990 as well as the goal to be achieved by Spain
according to its KP commitments. Except for a decline in 1993, 1996 and 2006, GHG
emissions have soared, reaching 48.1% above 1990 levels. Population and economic
growth, an increasing energy demand and changing lifestyles have all contributed to this
trend.
Graph 4. Annual percentage growth in GHG emissions in Spain (1990 baseline) and KP goal
Source: Abanades García (2007), p. 23.
Spain’s response to climate change has been articulated by multiple institutions. The
former Ministry of the Environment was the institution in charge of developing and
implementing climate change policies at the state level. Since March, the Ministry has
been restructured. It now includes rural and marine environments within its
competences at the central government level. The change has not altered the fact that
nation-wide climate change policies will be dealt with by the Ministry. More
specifically, the Spanish Office for Climate Change13 is in charge of developing climate
change policies and providing administrative and technical support for the National
Climate Council.14 The latter was established in 1992 to provide information about the
potential effects of climate change in Spain, promote research in this area, provide
policy guidance for the government on climate policies and develop the National
Climate Plan. A further institution is the Coordination Commission for Climate Change
Policies,15 whose main task is to coordinate climate change initiatives between the
central government and the autonomous communities (regions). Finally, the Inter-
cabinet Group for Climate Change16 was designed as a coordinating institution within
the central government sphere. Its main task is to develop preparatory work for the
government’s delegate commission for economic affairs.17
13
The Spanish acronym is OECC (Oficina Española de Cambio Climático).
14
The Spanish acronym is CNC (Consejo Nacional del Clima).
15
The Spanish acronym is CCPCC (Comisión de Coordinación de Políticas de Cambio Climático).
16
The Spanish acronym is GICC (Grupo Interministerial de Cambio Climático).
17
For further information on the specific goals and tasks of the above institutions see www.mma.es.
13According to the Spanish Office for Climate Change (OECC, Pers. Comm., 2008) there
are currently no final estimates of the cost of mitigating or of adapting to global
warming in Spain. The costs of the latter are only expected to be available once
adaptation measures are well under way. On a global scale, the IPCC acknowledges
‘much less information is available about the costs and effectiveness of adaptation
measures than about mitigation measures’ (IPCC, 2007, p. 56). In what follows the
main initiatives to mitigate and adapt to climate change will be explored and cost
estimates will be offered when available according to official data published by the
institutions in charge of climate change policies or by academic research when
appropriate. These estimates will depend on the assumptions made (eg, expected
economic growth, emissions growth, the evolution of the energy sector, the discount
rate used, the policy instruments used, etc.) and therefore figures should be taken with
caution.
Mitigation will be more costly the higher the emission scenarios from which we decide
to reduce emissions and the more stringent targets we set. The IPCC’s Fourth
Assessment Report estimates that the cost of reducing a tonne of CO2 equivalent ranges
from slightly negative to US$100. A more wide-ranging summary of the costs of action
under different stabilisation targets is provided in Table 3 below.
Table 3. IPCC’s (2007) estimates on the costs of stabilising GHG concentrations
World GDP loss (%)
Concentrations (ppm CO2-eq) Temperature increase
2030 2050
590 - 710 3.2 - 4.9 -0.6 – 1.2 -1 – 2
535 – 590 2 - 3.2 0.2 – 2.5 0–4
445 - 535 2- 2.8Mitigation can be achieved both by internal measures (national GHG reduction
measures plus the use of carbon sinks) and by the use of the KP’s flexibility
mechanisms (Clean Development Mechanism, Joint Implementation and Emissions
Trading System). As described by Abanades García et al., (2007), along with the
National Allocation Plan 2008-12, in which emission rights were assigned to those
sectors allowed to participate in the ETS (ie, those that were contemplated in Directive
2003/87/CE), other measures are ongoing to ensure Spain meets its KP goal. The
measures and emissions reduction targets include:
(1) Using flexibility mechanisms by the government and the private sector. The
government is expected to buy carbon credits in the global market to cover 31.8
MTCO2-eq per year. The private sector receives a limited amount of credits
equal to 26.1 MTCO2-eq per annum.
(2) Carbon sinks are an additional tool to meet our GHG reduction goals and are
expected to be able to capture 5.8 MTCO2 –eq annually.
(3) Using additional measures to limit GHG emissions from diffuse sectors which
will mean reducing 37,6 MtCO2-eq annually.
(4) Plan of Urgent Measures with over 80 actions aimed at further reducing Spain’s
emissions. These measures are expected to reduce our GHG emissions by up to
12.2MTCO2-eq per year
(5) Autonomous communities are expected to further cooperate in implementing
regional and local measures in order to meet our KP goal. The expected
reduction of these measures is 15.03MTCO2-eq annually.
The Spanish Climate Change and Clean Energy Strategy19 (part of Spain’s recently
approved Sustainable Development Strategy) describes actions that are being
implemented and planned plus indicators that will help monitor future progress. The
strategy divides these actions into the climate change response and actions directed
specifically towards promoting cleaner energy and improving energy efficiency. The
main goals of this strategy include a further reduction of GHG emissions in order to
help us achieve our KP targets, increasing carbon sinks and promoting R&D. Within the
climate change actions being developed, the Spanish Climate Change and Clean Energy
Strategy describes the main initiatives in energy consumption. These are summarised in
Table 4.
19
Estrategia Española de Cambio Climático y Energía Limpia (EECCEL).
15Table 4. Examples of energy efficiency initiatives: goals, emission reductions and government
investment
Estimated CO2 Investment
Measure Goal
reduction (€ mn)
Action Plan for Energy Saving
Reduce energy consumption
and Energy Efficiency (E4) 32.5MtCO2 729
improving efficiency in processes
(2005-07)
Regulate energy consumption in
30%-40% in energy
new and restored buildings.
consumption
Technical Building Code Multiply by 10 the number of N/A20
40%-55% in CO2
solar panels installed in buildings
emissions
in 2010
Renewable energies = 12.10% in
21 2010
Plan for Renewable Energies
Electricity from renewable energy 76,9MtCO2 8,492
(2005-10)
= 30.3%
Use of bio fuels = 5.83%
Source: MMA (2007).
The Spanish Climate Change and Clean Energy Strategy also analyses the emission
trading system. According to MMA (2007), one of the basic pillars of the ETS is the
National Allocation Plan (NAP). Spain’s second NAP for 2008-12 was approved by
Royal Decree 1370/2006 of 24 of November and in it emission rights for the first
commitment period were assigned, limiting to +37% our GHG emissions compared to
the base year. The remaining reductions in GHG emissions, given that Spain is only
allowed to increase its emissions by 15% above 1990 levels in order to comply with
Spain’s KP commitment, will be obtained via carbon sinks (2%) and emission trading
(20%).
In Spain the National Allocation Plan22 (NAP) for the KP’s first commitment period
maintains the burden sharing effort between the sectors23 that are allowed to participate
in the ETS and the other sectors. The annual amount of emission permits assigned to the
sectors allowed to participate in the ETS is equal to 152,673 million tonnes, which are
allocated for free.24 This implies a 16% reduction with regards to the previous NAP
(2005-07). The main goal of the current NAP is to help achieve the KP objective, to
preserve Spain’s competitiveness and employment and to ensure economic and
budgetary stability.
Within the remaining flexibility mechanisms, the CDM is considered a priority for
Spain and particularly so in Latin America, where Spain is promoting projects to boost
renewable energy development. Although the basic goal is to reduce GHG emissions
within our national boundaries, the CDM is seen as an efficient facilitator to lead to a
low carbon future and as a way of promoting growth in developing countries that host
these projects. Table 5 below illustrates the main CDM programmes in which Spain is
participating.
20
Not Available.
21
According to Abanades García et al. (2007) the breakdown of the contribution of the different energy
sources to Spain’s energy demand in 2006 was: 48.5% oil, 20.8% gas, 14.4% coal, 10.3% nuclear energy
and 5.9% renewable energy.
22
http://www.cne.es/cne/doc/legislacion/RD1370_2006-PNA(1).pdf.
23
These currently include the refinery sector, iron and steel, cement and lime, ceramic industry, glass,
paper and cardboard.
24
This free allocation will apply in principle to all permits distributed. Auctioning may only be
considered for those permits that are reserved to new entrants to the market.
16Table 5. CDM projects and carbon funds
Investment
Institution Programme Quantity (MTCO2) reduced
(€ mn)
Spanish Carbon Fund
BioCarbon Fund
World Bank 40 205
Community development carbon
fund
ADC25 LCI26 9 47
27 28
EIB and EBRD Multilateral Carbon Credit funds N/A 35
Asian Development
Asia Pacific Development Fund N/A 30
Bank
Source: MMA (2007).
A further strategic area for Spain in the climate change challenge is its involvement in
international cooperation projects. One of the most significant landmarks in this area
was the development of the Latin American Network of Climate Change Offices29 as
well as the Latin American programme on Impacts, Vulnerability and Adaptation to
Climate Change.30 The main goals of these initiatives have been to provide assistance in
understanding the potential threats of climate change for Latin American countries as
well as the development of strategies for dealing with it. Additional initiatives including
bilateral climate change agreements included the Araucaria XXI programme to promote
sustainable development in Latin America, reforestation projects in Latin America and
Spanish cooperation programmes in the Mediterranean basin, among others.
With regards to multilateral aid, Spain has also contributed to projects designed to help
developing countries adapt to climate change, foster technology transfer initiatives, help
with the integration of developing countries in the global carbon markets and participate
in CDM projects. Spain’s efforts in this area have included the contribution of more
than €9 million in various projects, including the Carbon Finance Assist initiative, the
UNDP-UNEP initiative (mainly directed to African and Latin American countries), the
Fund for Less Developed Countries and the Special Fund for Climate Change.
According to the former Ministry of the Environment, an estimate of the overall cost of
using the flexibility mechanisms will range from €445 million to €613 million per year.
Efficient actions towards limiting GHG emissions will also bring about ancillary
benefits, that again are hard to quantify. These benefits might well partially offset some
of the GHG mitigation costs (IPCC, 2007). Co-benefits include improvements in air
quality, that will reduce respiratory diseases, the reduction in Spain’s energy
dependence, increases in competitiveness for those firms that innovate in the renewable
energy sector and the creation of new employment niches. The agricultural sector and
the tertiary sector are both expected to reap the economic opportunities brought about
by an economy which is less carbon intensive.
Some climate change, as we have seen, is already under way. No matter how much we
reduce GHG emissions in the future, we will suffer the damages resulting from past
emissions, ie, from past inaction. Vulnerability to climate change depends on the level
of exposure, sensitivity and adaptability (IPCC, 2007). Adaptation is a damage
minimising strategy that has been used throughout human history, and more realistic
25
ADC is the acronym for Andean Development Corporation (CAF Corporación Andina de Fomento).
26
LCI is the acronym for Latin American Carbon Initiative (ICC Iniciativa Iberoamericana de carbono).
27
EIB is the acronym for European Investment Bank.
28
EBRD is the acronym for European Bank for Reconstruction and Development.
29
Red Iberoamericanas de Cambio Climático.
30
Programa Iberoamericano de Impactos, Vulnerabilidad y Adaptación al Cambio Climático.
17projections include this behaviour in their analyses. Adaptation has come to the
forefront of international climate talks and will remain among the higher priorities on
the climate policy agenda as the consequences and damages of climate change become
increasingly visible.
Global warming will hit poorer people the hardest, affecting those that are already under
stress due to floods, droughts, food shortage and diseases, among others. Helping
vulnerable people to adapt is an issue of inter- and intra-generational equity that is on
the table.31 As necessary and inevitable as adaptation strategies might be, they will not
be able to cope with the consequences of unlimited GHG emissions. Designing a
balanced and efficient mix of mitigation and adaptation efforts is therefore the best
strategy to deal with global warming. Equity considerations in adaptation strategies are
therefore of paramount importance. Asymmetric responsibilities in past emissions
provide strong arguments to advocate for transferring funds from developed to
developing countries.
Stern (2008) suggests that funds to ensure aid could be raised by auctioning emission
permits rather than allocating them for free among polluters allowed to participate in
ETS. Even though this might be attractive in theory (in that an approach that ensures
that a polluter pays can serve to improve the industry’s public image), the stakeholders’
resistance and pressures might have to be overcome in order to implement this idea.
Although cost estimates for adaptation remain very uncertain, the UNFCCC estimates
the cost of adaptation for developing countries will be between US$28 billion and
US$67 billion annually by 2030. The UNDP’s estimates are higher, at around US$86
billion a year by 2015 (ibid.). On a global scale the main recommendations in terms of
adaptation according to the IPCC are summarised in Table 6 below along with the
policy framework in which adaptation will have to be integrated and the main
opportunities and barriers to implementation.
Spain is among the most vulnerable countries within the EU and therefore the following
part of this subsection will briefly introduce the main areas and issues within Spain’s
adaptation strategy.
Spain’s planned response to adaptation has been to develop the National Adaptation
Plan. The main goals of our adaptation strategy include: to provide information and
guidance; to design mechanisms to cope with change that is already under way; to
gather information on regional and sector-wide impacts; to determine the most pressing
needs in R&D; and to include all stakeholders in the information and decision-making
framework plus to evaluate the measures implemented.
The main areas in which the adaptation plan is to thrive are biodiversity, the agricultural
sector, water availability, coastal areas and marine ecosystems, forests and mountain
areas, the fishing sector, transport, health, tourism, energy, the insurance sector and the
building industry. These sectors are the same as those analysed earlier, on the impact of
climate change for Spain and, once again, the main source in the development of our
adaptation strategies is Moreno et al., (2005). A concise and insightful summary of the
main adaptation strategies to be followed in Spain is presented by Abanades García et
31
See IPCC (2007), Stern (2006) and the main conclusions and recommendations agreed at the Bali
conference in December 2007 which resulted in the Bali Roadmap:
http://unfccc.int/files/meetings/cop_13/application/pdf/cp_bali_action.pdf.
18al., (2007). Accurate information on the assets at risk is lacking in many areas. Research
and development efforts need to be decisively advanced. Valuation studies are still at an
early stage and there is an increasing need for information if we want to allocate scarce
funds optimally.
19Table 6. IPCC’s selected examples of adaptation strategies by sector
Key constraints and opportunities to
Sector Adaptation option/strategy Underlying policy framework
implementation
National water policies and
Expanded rainwater harvesting; water storage Financial, human resources and physical
integrated water resources
Water and conservation techniques; water reuse; barriers; integrated water resources
management; water-related hazards
desalination; water-use and irrigation efficiency management; synergies with other sectors
management
R&D policies; institutional reform;
Adjustment of planting dates and crop variety; Technological and financial constraints;
land tenure and land reform; training;
crop relocation; improved land management, eg, access to new varieties; markets; longer
Agriculture capacity building; crop insurance;
erosion control and soil protection through tree growing season in higher latitudes;
financial incentives, e.g. subsidies
planting revenues from ‘new’ products
and tax credits
Relocation; seawalls and storm surge barriers;
Infrastructure Standards and regulations that Financial and technological barriers;
dune reinforcement; land acquisition and
& settlement integrate climate change availability of relocation space; integrated
creation of marshlands/wetlands as buffer
Including considerations into design; land-use policies and management; synergies with
against sea level rise and flooding; protection of
coastal zones policies; building codes; insurance sustainable development goals
existing natural barriers
Heat-health action plans; emergency medical Public health policies that recognise Limits to human tolerance (vulnerable
services; improved climate-sensitive disease climate risk; strengthen health groups); knowledge limitations; financial
Human health
surveillance and control; safe water and services; regional and international capacity; upgraded health services;
improved sanitation cooperation improved quality of life
Appeal/marketing of new attractions;
Integrated planning (eg, carrying financial and logistical challenges; potential
Diversification of tourism attractions and
capacity; linkages with other adverse impact on other sectors (eg,
Tourism revenues; shifting ski slopes to higher altitudes
sectors); financial incentives, eg, artificial snow-making may increase energy
and glaciers; artificial snow-making
subsidies and tax credits use); revenues from ‘new’ attractions;
involvement of wider group of stakeholders
Integrating climate change Financial and technological barriers;
Realignment/relocation; design standards and
considerations into national transport availability of less vulnerable routes;
Transport planning for roads, rail and other infrastructure to
policy; investment in R&D for special improved technologies and integration with
cope with warming and drainage
situations, eg, permafrost areas key sectors (e.g. energy)
Strengthening of overhead transmission and National energy policies, regulations,
Access to viable alternatives; financial and
distribution infrastructure; underground cabling and fiscal and financial incentives to
technological barriers; acceptance of new
Energy for utilities; energy efficiency; use of renewable encourage use of alternative
technologies; stimulation of new
sources; reduced dependence on single sources sources; incorporating climate
technologies; use of local resources
of energy change in design standards
Source: IPCC (2007), p. 57.
20Ecosystems and biodiversity at risk are said to have limited adaptation capabilities and therefore the
advice is to try to reduce the pressure exerted by activities such as construction, infrastructure
development, livestock, water pollution, overfishing, etc. Designation of new protected areas plus
ensuring there are enough resources to manage these areas is also recommended in order to increase
ecosystem resilience.
Analysing adaptation options for water resources is considered essential for Spain. The main
recommendation in order to adapt our water resources is to ensure we have adequate management
systems that take into account climate change in their planning and implementation. Efficiency in
the use of water and clear priority setting in the use of water resources are believed to be profitable
long-term goals. For coastal areas such as the Cantabrian Sea and the Canary islands the main
recommendation is to increase the weight of docks between 10% and 25% to ensure their stability.
Additional measures would also entail considering vacating areas that will be flooded and building
coastal defences as part of broader adaptation strategies.
With regards to agriculture, the main adaptive strategy is to tailor sowing, cultivation and
harvesting to the new climate patterns. Stockbreeding is also seen as a threat to pastures and
reducing its pressure to ensure higher quality grazing land is the main adaptation measure
recommended in order to minimise damages. Fisheries are also expected to see declining catch
numbers. Fishing businesses on the continental shelf are thus expected to take this into account in
the future, diversifying their activity or relocating to other areas. Forests are also at risk of more
frequent wildfires and the adaptation advice in this area is to avoid risky monocultures and to
ensure adequate maintenance.
Health adaptation strategies should include early warning messages and prevention programmes for
the Spanish population, especially those who are considered more vulnerable to climate-related
diseases. Finally, other adaptation strategies for the energy sector, the tourism sector and the
insurance industry are explored. The energy sector is encouraged to further increase its efficiency,
reduce demand and promote renewable energy, provided the government encourages a stable and
efficient regulatory framework. The Spanish tourism sector will inevitably see higher infrastructure
deterioration in certain areas, a shift in seasonal visitors and a decrease in traditional tourist
destinations and activities. To counteract this, civil engineering might alleviate infrastructure
damages. Complementary services such as SPA’s or funfairs can be encouraged as an artificial and
less vulnerable alternative. The environmental impacts of these artificial options might hinder their
widespread implementation. The insurance sector is expected to adapt to more adverse weather
conditions through increased preventive strategies, increases in risk premiums and possible
reductions in the coverage of damages.
The main criticisms to our adaptation plan as well as to Spain’s climate change strategy come from
various stakeholders and NGOs. These agents believe that Spain’s response is a somewhat vague
and shallow attempt to face climate change. According to these groups, Spain’s response is in need
of more information, further specific measures and benchmarks against which achievements can be
gauged. The specific measures suggested by these agents include: a long term and stable policy
framework to ensure renewable energies are continuously incentivised; further promotion of public
transport; a greater use of fiscal measures to ‘green’ production and consumption processes; the
increasing the use of production standards; and ensuring climate policies permeate across all
government departments. We still have a long way to go and future negotiations for the post-Kyoto
era are not going to be easier.
1Post-Kyoto: The New Global Deal
Sir Nicholas Stern has released a policy guidance paper in which the main challenges of the Post-
Kyoto era are unravelled and advice for the Copenhagen Conference of Parties (COP15) is put forth
(Stern, 2008). Future efforts in the quest for a stable climate are going to be greater than those
required by the Kyoto Protocol. This endeavour is expected to be significant but the positive
outlook provided is that it is achievable if action is taken now. The message that a greater effort is
needed first from the developed countries but soon after from the developing countries is similar to
that voiced by the IPCC in 2007 and by the Stern Review in 2006. Being prepared to face
forthcoming commitments is paramount if we are to ensure a bearable climate system. The present
subsection will present the main ideas discussed by Stern (2008) as well as the recommendations
for Spain in the post-Kyoto era.
The relevance of a stable and strong policy framework that builds on the existing institutional
setting is seen to lie at the heart of effective action in the climate-change arena. Achieving
environmental goals in a cost-effective manner plus taking into account how actions and policies
affect different groups of people is considered fundamental if we are to ensure we all walk towards
a tolerable climate scenario. Stern estimates this will require greater cuts in emissions to limit GHG
concentrations to a ‘critical threshold’ of 500ppm.
At a global scale, this more stringent target will require GHG emissions to be cut by 50% by 2050
compared with 1990 levels. Developed countries are expected to reduce by 80% their GHG
emissions by 2050, proving that decoupling growth and emissions is possible minimising harm to
the former. This should be accompanied by wide-ranging technology transfers and the provision of
adaptation funds for developing countries in order to provide them with adequate incentives to
engage in GHG emission limits. Developing countries are expected to agree to binding emission
cuts by 2020 if benefits of binding constraints outweigh the expected costs. These countries are to
reap the benefits of CDM in terms of technology transfer and lower emission paths in the
meantime. Additionally, sectors that are particularly exposed to international competition should
face equivalent regulatory requirements in order to minimise carbon leakage and competitiveness
concerns. On an individual basis, per capita emissions should be reduced drastically to 2 tonnes per
capita. Note that Spain’s per capita emissions were 9.59 tonnes per capita in 2006 (versus 11 tonnes
per capita in the EU in 2006 and countries such as the US reaching 20-25 tonnes per capita) and
that current KP commitments entail a reduction in per capita terms to 7 tonnes per capita (Nieto &
Santamarta, 2007).
The policy mix that has been developed world-wide to face climate change is also examined by
Stern (2008).32 Little new advice is given and further expansion of the emission trading system to
cover more sectors and countries is seen as the way ahead to ensure environmental goals are met,
costs of meeting our commitments are minimised and developing countries can benefit from lower
emission paths. Expanding the emission trading system could reduce costs by 70%. One of the
major players in the climate challenge, the US, is showing an increasing interest in the use of cap
and trade emission trading schemes. The presidential candidates support the future implementation
of this market-based instrument and thus it is highly likely that we will see a US scheme in the near
future.
Additional market mechanisms that put a price on carbon emissions and more traditional command
and control policies are also considered in the mix. The weight and implementation of these tools
will depend on the specific conditions of the country/sector analysed. International experience and
success stories can help develop these tools in different settings. In order to send the correct signals
to investors these tools are again expected to be implemented over the long run so that investors
face stable policy frameworks and incentives. Spain is, according to MMA (2007), considering the
32
See, for example, Lara Lázaro (2008), ‘Climate Change: Policy Mix for a Brave New Kyoto?’, ARI nr 12/2008,
Elcano Royal Institute.
2further use of green fiscal policy measures but stakeholder resistance, coupled with the current
economic outlook, might well delay or reduce the widespread development of this initiative.
On a more specific level, the report provides advice on halting deforestation. Biodiversity losses
and deforestation are at present inextricably linked. Tropical rainforests hold a high percentage of
the world’s remaining biodiversity and act as a global carbon sink. Deforestation is furthermore
acknowledged to potentially cause over 17% of GHG emissions world-wide. Halting deforestation
seems to be an attractive strategy in the struggle against global warming. All efforts in this area are
welcome, but the geographical location of forests brings equity issues again to the forefront of the
analysis. Less developed countries hold a wealth of species and a high percentage of remaining
forests. They also have access to these resources and incentives to reduce forest cover according to
immiserisation and frontier model explanations (Hanley et al., 2001). In order to provide incentives
to halt deforestation, Stern (2008) advocates an annual payment of US$15 billion and extending
carbon trading to fully account for forest services. It seems that time to compensate developing
countries for the opportunity cost of forest preservation is here to stay and this will mean a push for
international initiatives such as the Global Environmental Facility (GEF).33
A further step towards a low carbon future is the development, adoption and diffusion of new
technology. Carbon capture and sequestration (CCS) is presented as one of the main future
alternatives due to the increasing energy demand and the abundance of highly polluting coal. Safety
concerns in terms of large-scale leakage and the current cost of capturing and storing carbon are the
main concerns with this technology.
Renewable energy sources such as solar, wind and second generation bio fuels are considered to
hold a great potential in the future global energy mix. Adequate incentives can ensure that countries
like Spain retain a significant share of the renewable pie. Spain’s climate makes it one of the best
locations for investing in renewables. This value is demonstrated and captured by our energy
companies who have thrived in this competitive field. We are the second-largest wind energy
producer, with our energy companies leading the wind power market world-wide. Solar power is
also a blooming business in Spain. In 2007 we were second in Europe in the use of solar power.
These energy sources are believed to be able to reduce GHG emissions by 10GT by 2030. This is a
significant amount given that in 2005 world-wide emissions were estimated at 45GT and the goal
proposed by Stern (2008) is to emit 20GT by 2050 and to halve that figure in the following decades
in order to stabilise GHG emissions.
The final milestone is the institutional setting in which the post-Kyoto agreement will develop. In
the absence of a World Environmental Organisation, agreements will happen under the auspices
and using the research potential of various institutions such as the UNFCCC, UNEP, the IPCC, the
EEA, NGO’s, universities, etc. The scope and depth of climate change could, however, lead to the
development of an ‘International Climate Change Organisation’ (Stern, 2008). In any case, no
matter the exact setting in which future climate plans thrive, the fundamental goal seems to be to
ensure the provision of a stable, proactive, flexible and efficient setting for action.
IPCC experts agree that citizen involvement in all the above mentioned initiatives can contribute to
meeting climate change goals (IPCC, 2007). For Spain, the good news in this area comes from the
survey conducted by the Centre for Sociological Research (CIS in its Spanish acronym) in
November 2007. According to the results obtained in this survey the majority of the people in Spain
would be willing to change their lifestyle and habits if this can help fight climate change. These
changes may come from choosing energy providers with greater investments in renewables,
walking and using bicycles for short distances, using public transport whenever this option is
feasible, keeping car tyres properly inflated, buying energy efficient appliances, separating waste so
it can be adequately recycled, buying local products, etc. Warm glow effects and other biases aside,
whether these intentions are good predictors of behaviour remains to be seen especially if we have
33
For an insightful analysis of market creation initiatives to preserve environmental assets see Pearce (2004).
3You can also read