Climate Change Strategy - A strategy to guide the Wellington Regional Council's climate change response

Page created by Alfredo Jensen
 
CONTINUE READING
Climate Change Strategy - A strategy to guide the Wellington Regional Council's climate change response
Attachment 2 to Report 15.470

Climate Change Strategy
A strategy to guide the Wellington Regional
Council’s climate change response
October 2015
Climate Change Strategy - A strategy to guide the Wellington Regional Council's climate change response
Contents
1.       Executive summary                                                                                                           2

2.       Introduction                                                                                                                3
          2.1 Background                                                                                                             3
          2.2 Purpose and scope                                                                                                      4
          2.3 Planning context                                                                                                       4

3.       Regional context                                                                                                            4
         3.1 Greenhouse gas emissions in the Wellington region                                                                       4
          3.2 Projected climate changes and key risks for the Wellington region                                                      4
          3.3 GWRC’s role in addressing climate change                                                                               7

4.       Greater Wellington Regional Council’s strategic approach                                                                    8
         4.1 Vision                                                                                                                  8

                                                                                                                                         A strategy to guide the Wellington Regional Council’s climate resilience activities
         4.2 Overarching objectives                                                                                                  9
         4.3 Implementation principles                                                                                              11
         4.4 Policies                                                                                                               12

Appendix 1 Wellington region greenhouse gas emission projection scenarios                                                           13

Cover photos:
Top left – Waves battered the Wairarapa Line between Petone and Ngauranga, washing away the sea wall and badly damaging the track
during the June 2013 storm event
Top right – A Wairarapa line train between Petone and Ngauranga at peak time
Bottom – Young children in native forest
                                                                                                                                                                                  1
Climate Change Strategy - A strategy to guide the Wellington Regional Council's climate change response
1. Executive summary                                                      
                                                                                                    partnerships. A further aim is to help strengthen
                                                                                                    information-sharing and integration across the
                                Climate change is often described as the biggest
                                                                                                    Greater Wellington Regional Council’s (GWRC)ȱ
                                               
                                                                                                    departments, between councils, with central
                                climate change carry tough economic and social
                                                                                                    government, and with the community. The
                                implications for central government, councils and
                                                                                                    Strategy is intended to act as a guide for climate
                                            
                                                                                                    resilience activities across GWRC, and to provide
                                infrastructure and ecosystems from rising seas,
                                                                                                    clear strategic direction on GWRC’s intentions and
                                   
                                                                                                    priorities in this respect.
                                While local government faces a number of
                                                                                                    The Climate Change Strategy sets three
                                limitations in addressing climate change,
                                                                                                    overarching objectives that should guide GWRC’s
                                there is strong and growing recognition both
                                                                                                    climate change actions into the future. See Table 1.
                                internationally and within New Zealand, of the
                                crucial role that councils can play in increasing
                                                                                                               
                                climate resilience.
                                                                                                    the strategic objectives. Œ’˜—œȱ˜ȱŠŒ‘’ŽŸŽȱ‘Žȱ
                                                                                                    œ›ŠŽ’Œȱ˜‹“ŽŒ’ŸŽœȱŠ—ȱ™˜•’Œ’ŽœȱŠ›Žȱ˜ž•’—Žȱ’—ȱŠ—ȱ
                                The purpose of this Greater Wellington Climate
                                                                                                     –™•Ž–Ž—Š’˜—ȱ•Š—ȱ‘Šȱ ’••ȱ‹Žȱ›ŽŸ’Ž ŽȱŠ—ȱ
                                Change Strategy is to provide an overarching
                                                                                                    ž™ŠŽȱ˜—ȱŠ—ȱŠ——žŠ•ȱ‹Šœ’œǯ The Implementation
                                document to align and coordinate climate change
                                                                                                    Plan will ensure that the high-level vision,
                                actions across GWRC’s responsibilities and
                                                                                                    overarching objectives and policies outlined in the
                                operations. It aims to build on work programmes
Draft Climate Change Strategy

                                                                                                    GWRC Climate Change Strategy translate into
                                already underway, raise awareness of climate
                                                                                                    tangible, measurable actions over 
                                change drivers and impacts, and help co-ordinate
                                                                                                      

                                Table 1

                                 Objective 1                                  Objective 2                             Objective 3

                                 Greater Wellington will act to reduce        Risks from climate change-related       Community awareness of climate
                                 GHG emissions across all its areas of        impacts are managed and resilience      change mitigation and adaptation
                                 influence, including its own operations,     is increased through consistent         solutions increases and organisations
                                 helping to create the conditions for a       adaptation planning and actions based   and individuals know what they can do
                                 smart, innovative, low-carbon regional       on best scientific information          to improve the long term resilience and
                                 economy                                                                              sustainability of the region

                                 Aerial view of Wainui River in flood, 2004

2
Climate Change Strategy - A strategy to guide the Wellington Regional Council's climate change response
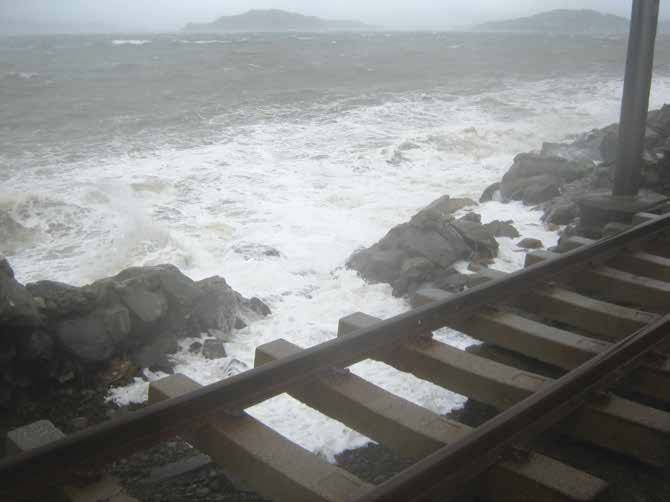
2. Introduction                                                            At the same time as posing major challenges,
                                                                           addressing climate change presents us with many
                                                                           ##    $!     
2.1 Background
                                                                           low carbon economy creates a real opportunity
Climate change is often described as the biggest
                                                                           to invest in a safe and prosperous future where
environmental challenge we face.1    
                                                                                       
climate change carry tough economic and social
                                                                             #  !     
implications for central government, councils and
                                                                                     
            
                                                                           reduced vehicle congestion, and more livable cities.
infrastructure and ecosystems from rising seas,
   
                                                                           While some of the impacts of climate change are
                                                                           now inevitable due to the accumulation of past
Analysis from the World Bank, the New Zealand
                                                                           and current greenhouse gas emissions in the
Treasury and others indicates that the longer we
                                                                           atmosphere, the speed and magnitude of impacts
delay reducing emissions, the harder and more
                                                                           in the longer term will be decided by how quickly
expensive it will be.2 The IPCC’s Fifth Assessment
                                                                           countries – including New Zealand – reduce
report states that without additional mitigation
                                                                           greenhouse gas emissions. At the national level,
          
                                                                           New Zealand has two key opportunities to move
of severe, widespread and irreversible impacts
                                                                           towards a low-carbon economy in 2015: First,
globally” and that while mitigation involves risks,
                                                                           the Government will decide on New Zealand’s

                                                                                                                                                   A strategy to guide the Wellington Regional Council’s climate resilience activities
these risks are not as great as those from climate
                                                                           commitment to reducing emissions as part of
change.
                                                                           negotiations for a new international climate
                                                                           agreement. Second, the Emissions Trading Scheme,
As a coastal region, hemmed in to the east, west
                                                                           central government’s principal climate change
and south by the sea, the impact of even a small
                                                                           policy tool, is scheduled for review.
      !   "#
for some landowners across the Wellington
                                                                           At the local government level, there have been
region. Storms occurring on top of a higher sea
                                                                           increasing calls for central government to provide
    #        
                                                                           clearer direction and support for councils in
transport networks and stormwater systems, as
                                                                           addressing climate change in their communities.
well as private homes and other buildings. In
                                                                           While there in no clear legal mandate for local
   $#      
                                                                           government in New Zealand to undertake climate
on increased protection alone will become
                                                                           change mitigation (emission reduction) activities,
progressively less feasible.3 Options such as
                                                                           many councils have put in place policies that
managed retreat will need to be considered.
                                                                           contribute to emissions savings across council
                                                                           operations and in the community. Councils do
As discussed in an Insurance Council of New
                                                                           have clear legal obligations to undertake climate
Zealand position paper,4 the New Zealand Climate
                                                                           change adaptation planning, though council
Change Centre promotes retreat from areas at
                                                                           actions to plan and prepare for the impacts of
greatest risk from natural hazards in its summary
                                                                           climate change are often highly controversial and
 % &  !    '**
                                                                           open to ongoing challenge and contestation from
report.5
                                                                           the community, particularly among those who are
                                                                              6
1 E.g. Parliamentary Commissioner for the Environment. 2014. Changing
  climate and rising seas: understanding the science.                      While local government faces a number of
2 The Wold Bank. 2015. Climate Change Overview http://www.                 limitations in addressing climate change,
  worldbank.org/en/topic/climatechange/overview#1                          there is strong and growing recognition both
   NZ Treasury 2014 Briefings to Incoming Ministers Information Release    internationally and within New Zealand, of the
   http://www.treasury.govt.nz/publications/briefings/2014-climate-        crucial role that councils can play in increasing
   change/bim-14-climate-change.pdf
                                                                           climate resilience.7
   2014 Whitehouse Report ‘The Cost of Delaying Action to Stem Climate
   Change’ https://www.whitehouse.gov/sites/default/files/docs/the_cost_
   of_delaying_action_to_stem_climate_change.pdf                           +          # 
  2006 Stern Review on the Economics of Climate Change                     as it’s on their door step – whether there is a global
  http://siteresources.worldbank.org/INTINDONESIA/                         agreement between national governments or not.”8
  Resources/226271-1170911056314/3428109-1174614780539/
  SternReviewEng.pdf
3 New Zealand Climate Change Centre. 2014. Climate change IPCC Fifth       6 A recent example is when Kapiti Coast District Council put coastal
  Assessment Report New Zealand findings.                                    erosion risk on the Land Information Memorandum (LIM) reports of
4 Insurance Council of New Zealand. 2014. Protecting New Zealand from        1,800 houses in Paekakariki.
  Natural Hazards. An Insurance Council of New Zealand perspective on      7 Pew Center on Global Climate Action. 2011. Climate Change 101:
  ensuring New Zealand is better protected from natural hazards.             Understanding and Responding to Global Climate Change – Local
5 New Zealand Climate Change Centre. 2014. Climate Change – IPCC             Action. http://www.c2es.org/docUploads/climate101-local.pdf
  Fifth Assessment Report: New Zealand findings.                           8 ICLEI Local Governments for Sustainability. 2010. Press release: UN
                                                                             refers to cities as key governmental stakeholders supporting global
                                                                             climate action. http://www.iclei-europe.org/cop16/

                                                                                                                                                                                            3
Climate Change Strategy - A strategy to guide the Wellington Regional Council's climate change response
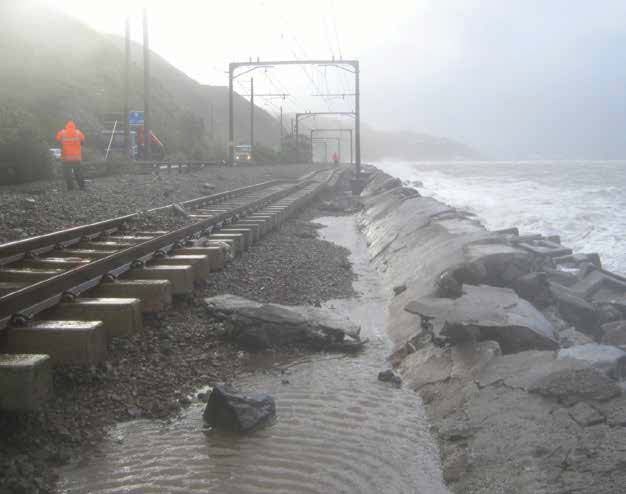
2.2 Purpose and scope                                                        the region.10 Figure 2 (p.6) demonstrates the
                                The purpose of this draft Greater Wellington                                 contribution of individual emission sources to the
                                Climate Change Strategy is to provide an                                     total regional gross emissions11 for the 2012/13
                                overarching document to align and coordinate                                 !      #    
                                climate change actions across GWRC’s                                         approximately 37% of the total gross emissions,
                                responsibilities and operations. It aims to build                            with petrol use for road transport contributing
                                on work programmes already underway, raise                                   about 18%. Agricultural emissions contribute about
                                awareness of climate change drivers and impacts,                             33% of the emissions, with most of these resulting
                                   # $                                            from enteric fermentation from animals. Emissions
                                collaboration and partnerships. A further aim                                from electricity consumption are responsible for
                                is to help strengthen information-sharing and                                around 14% of the regional gross emissions.
                                integration across GWRC departments, between
                                councils, with central government and with the                               The dominant contributors of emissions to the
                                community. The Strategy is intended to act as                                  #!     # 
                                a guide for climate resilience activities across                             agriculture and energy sectors and the Strategy
                                GWRC, and to provide clear strategic direction on                            contains policies that aim to address emissions
                                GWRC’s intentions and priorities in this respect.                            from those sectors where they are within the scope
                                                                                                             of GWRC’s planning and operational functions.
                                  #   /    !          
                                fall within GWRC’s current functions and spheres                             3.2 Projected climate changes and key risks for
                                     ;     /                                    the Wellington region
                                does not cover Council Controlled Organisations                              3.2.1 Dealing with uncertainty
Draft Climate Change Strategy

                                (CCOs) or other arms length organisations. Not                               Uncertainty about the exact extent and location
                                all GWRC climate actions will occur as a direct                              of future climate change impacts is sometimes
                                result of this Strategy; the Climate Change Strategy                                    #
                                serves as a means to codify GWRC’s response                                  to climate change risks and as a reason to delay
                                to climate change and helps to set the climate                               action. Just like any area of complex science,
                                platform for other plans and strategies to link with.                        uncertainty is a feature of climate science that will
                                                                                                             never go away. People and organisations make
                                2.3 Planning context                                                         decisions every day based on less than certain
                                This Strategy is a non-statutory document that is                            information.12
                                  !    #     
                                documents such as the draft Natural Resources                                The recommended approach for climate change
                                  =    /   +                                      planning and decision-making is one of risk
                                = +   #    $                                       management in the face of uncertainty. As
                                      #     #                                         '**@ =   
                                asset management plans, the proposed Regional                                is easier for nations, companies, and even
                                Natural Hazards Strategy, and GWRC’s Corporate                               individuals when the likelihood and consequences
                                Sustainability Action Plan. It takes a long term                             of possible events are readily understood. Risk
                                view but contains actions to be completed in the                             management becomes much more challenging
                                near-term and will be reviewed on a 3 yearly basis.                          when the stakes are higher or when uncertainty
                                                                                                             is greater. As the WGII AR5 demonstrates, we
                                Figure 1 (see the following page) illustrates                                know a great deal about the impacts of climate
                                connections and linkages between the Draft                                   change that have already occurred, and we
                                Climate Change Strategy and other key planning                               understand a great deal about expected impacts
                                documents, as well as the guiding legislation                                in the future. But many uncertainties remain, and
                                under which plans and strategies are produced.                               will persist. In particular, future greenhouse gas
                                                                                                             emissions depend on societal choices, policies,
                                                                                                             and technology advancements not yet made,
                                                                                                             and climate-change impacts depend on both the
                                                                                                             amount of climate change that occurs and the
                                3. Regional context                                                              #    "#
                                                                                                             and vulnerability. The real challenge of dealing
                                3.1 Greenhouse gas emissions in the
                                                                                                                        K 
                                     Wellington region
                                                                                                                       
                                In 2014, a consortium of councils in the Wellington
                                                                                                             where complete knowledge is impossible. This is
                                region9 commissioned a report, Greenhouse
                                                                                                             the essence of risk management.13
                                Gas Inventory for the Wellington Region, which
                                collected and presented data on the greenhouse                               10 URS New Zealand Ltd. 2014. Greenhouse Gas Inventory for the
                                   #!    ;                                       Wellington Region Report. http://www.gw.govt.nz/assets/About-GW-
                                and the individual cities and districts within                                  the-region/Wellington-GHG-Inventory-Report-Final.pdf
                                                                                                             11 Gross emissions excludes emissions and carbon sequestration from
                                                                                                                land use, land use change, and forestry.
                                9 Wellington City Council , Porirua City Council, Hutt City Council, Upper   12 Climate Outreach and Information Network. 2015. Communicating
                                  Hutt City Council, Kapiti Coast District Council, and Greater Wellington      Uncertainty in Climate Science. http://talkingclimate.org/guides/a-
                                  Regional Council.                                                             guide-to-communicating-uncertainty-in-climate-science/
                                                                                                             13 Intergovernmental Panel on Climate Change. 2014 Working Group II
4                                                                                                               AR5 Report: Impacts, Adaptation and Vulnerability. FAQs, p.96
Climate Change Strategy - A strategy to guide the Wellington Regional Council's climate change response
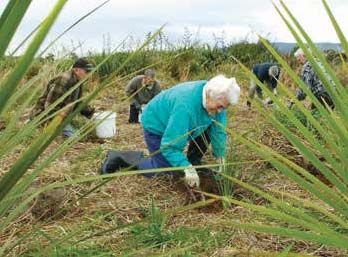
Figure 1: The relationship between the Greater Wellington Climate Change Strategy and other key regional planning documents

         Land Transport                                            Resource                    Soil Conservation and
        Management Act                                          Management Act                   Rivers Control Act

                                                                 Regional Policy                     Floodplain
            Regional Land
                                                                   Statement                        management
            Transport Plan
                                                                                                        plans

            Corporate                                   Regional Natural
           Sustainability

                                                                                                                              A strategy to guide the Wellington Regional Council’s climate resilience activities
                                                        Resources Plan*
            Action Plan

                                                                                                               Asset
                                                            Climate Change                                  management
                                                                                                               plans
            Infrastructure
               Strategy
                                                                Strategy

                                                                                                  Regional Civil
                                                                 Regional Parks
           Long Term Plan                                                                       Defence Emergency
                                                                 Network Plan
                                                                                                Management Plan

              Local                                                Reserves                  Civil Defence Emergency
         Government Act                                              Act                         Management Act

                 Statutory documents                                          Non-statutory documents
                 Documents, plans or strategies                               May be produced under a general mandate
                 required by legislation                                      provided by legislation but have no legal
                                                                              standing or regulatory power. For example
                                                                              the Resource Management Act and the Soil
                  Guiding legislation                                         Conservation and Rivers Control Act provide
                                                                              the general mandate for GWRC to produce
                                                                              and implement floodplain management plans

   * The proposed Natural Resources Plan for the Wellington
     Region had not been finalised at the time of publication

                                                                                                                                                                       5
3.2.2       Projected climate changes14                                                 1990 shows that relative sea level is currently
                                                                                                                        tracking towards a 0.8m rise by the 2090s or ~1m
                                Sea level rise – currently tracking towards a 0.8m
                                                                                                                        by 2115.16
                                rise by the 2090s or ~1m by 2115 compared to
                                1990.
                                                                                                                        Recent sea-level rise in Wellington (and in other
                                                                                                                        main ports in New Zealand) is consistent with the
                                The Wellington region has a more complicated                                            trajectory being taken by the global average sea-
                                #       # #                                                    level rise, which is tracking close to the upper end
                                sea-level rise than other parts of New Zealand                                          of the range of sea level rise projections published
                                due to its geographical position astride a complex                                      in the IPCC’s AR4 report.17
                                network of faults.
                                                                                                                        Wind – the frequency of extreme winds over this
                                These faults are associated with the convergence                                        century is likely to increase by between 2 and 5%
                                  L      !  #                                                     in winter, and decrease by a similar amount in
                                20-40km beneath the surface. Recently Wellington                                        summer.
                                city has been subject to slow-slip events that have
                                produced an average subsidence of 1.7mm per                                             The frequency of extreme winds over this century
                                year since 2000. Records over 6 years up to 2012                                        is likely to increase by between 2 and 5 per cent in
                                show subsidence varies across the region from                                           almost all regions of New Zealand in winter, and
                                around 1mm per year on the Kapiti coast up to                                           decrease by a similar amount in summer, and this
                                between 2 to 3mm per year along the Wairarapa                                           is especially the case for Wellington and the South
                                coast.15                                                                                Island. There is forecast to be an increase in the
Draft Climate Change Strategy

                                                                                                                               #   
                                Wellington Harbour has experienced an average                                           across New Zealand.18
                                rise in relative sea level of 0.2m in the last 100
                                years, which is relative to the inner-city land mass.
                                Sea level monitoring in Wellington Harbour since                                        16 National Institute of Water and Atmospheric Research Ltd (NIWA).
                                                                                                                           2012. Sea level variability and trends- Wellington region. Prepared for
                                                                                                                           Greater Wellington Regional Council.
                                14 Current climate change projections are based on the IPCC (Fourth                     17 Intergovernmental Panel on Climate Change. 2007. Climate Change
                                   Assessment) Report. These will be updated as soon as projections                        2007 – Impacts, Adaptation and Vulnerability. Contribution of Working
                                   in the latest IPCC (Fifth Assessment) Report are downscaled to the                      Group II to the Fourth Assessment Report of the IPCC.
                                   regional scale.
                                                                                                                        18 Ministry for the Environment. 2008. Climate change effects and
                                15 National Institute of Water and Atmospheric Research Ltd (NIWA).                        impacts assessment: A guidance manual for local government in New
                                   2012. Sea level variability and trends- Wellington region. Prepared for                 Zealand. http://www.mfe.govt.nz/publications/climate/climate-change-
                                   Greater Wellington Regional Council.                                                    effect-impacts-assessments-may08/index.html

                                Figure 2: Wellington region gross emissions – contribution of individual emission sources

                                    Energy Use

                                    Transport

                                    Waste

                                    Industrial processes and product use                                                        Electricity consumption*
                                                                                                                                      14.15%
                                                                                                                                                                               LPG
                                    Agriculture                                                                                                                               1.06%
                                    Forestry (not included in graph as it                                                                          Natural Gas                              Coal
                                    shows gross emissions, which                               Agriculture                                           5.63%                                 0.50%
                                    excludes emissions from land use,                           32.98%
                                    land use change, and forestry).
                                                                                                                                                                                         Biofuel use
                                                                                                                                                                                           0.17%

                                                          Industry , HFCs,                                                                              Petrol
                                                             PFCs, SF6
                                                               3.69%                                                                                    17.73%

                                                   Waste
                                                   Water
                                                   0.15%

                                                            Solid Waste                                                              Diesel
                                                              Disposal                                            Jet                10.23%
                                                               5.10%                                            Kerosene
                                                                         LPG                                     6.45%
                                                                        0.06%
                                                            Marine Diesel
                                                              Scope 1                                           Rail                       Bus Diesel
                                                               0.02%          Light                            Diesel                       0.18%                * Electricity consumption refers to electricity used
                                                                             Fuel Oil                          0.22%                                               in the Wellington region but imported from the
                                                                              1.52%         Marine                                  Bus elect.                     National Grid. This includes but is not exclusive
                                                                                            Diesel           Av Gas                  0.00%                         to electricity generated in the Wellington region.
                                                                                             0.01%            0.07%        Rail
                                                                                                                          electr.
                                                                                                                          0.09%
6
Precipitation – overall there is expected to be a                        (c)    Increased frequency of drought, placing
small increase in rainfall in the west of the region                            pressure on water resources and increasing
and a decrease in the east. Very heavy rainfall                                       !20
events are likely to become more frequent.
                                                                         3.3 GWRC’s role in addressing climate change
Rainfall will vary locally within the region. There                      GWRC is responsible for a range of roles and
is expected to be a small increase in rainfall in                        functions that relate to the climate change risks
Kapiti and Wellington city, and less rainfall in                          !   @
the Wairarapa. In Masterton, it is likely that there
             '                                • Natural hazards - avoidance and mitigation
Paraparaumu, average annual rainfall is likely to                        • Biosecurity - regional pest management
increase by 3% by 2090. Seasonal projections show                        • Maintaining indigenous biodiversity in the
that Wairarapa is likely to have much less rain in                         region
winter and spring, and more rain in summer and                           • Regional land transport planning and
autumn. Very heavy rainfall events are likely to                           contracting passenger services
become more frequent, especially in the Tararuas                         • }         
during north-westerly storms, and in Wellington                            land, air and coastal waters through Regional
city and south Wairarapa during southerly storms                           Policy Statements and Plans, and the issuing of
                                                                           consents
Temperature – average temperatures are likely to                         • Flood protection

                                                                                                                                                      A strategy to guide the Wellington Regional Council’s climate resilience activities
                                   • Soil conservation
by 2090, compared to 1990.                                               •           
                                                                           of hazardous substances
Based on research undertaken by NIWA and                                 • ' !        
projections contained in the 2007 IPCC report,                             land
temperatures in the region are likely to be around                       • Maintaining the infrastructure that provides
XY[*    \X]X  \^[*    \XYX                              bulk water supply to the region’s four cities
compared to 1990. By the end of the century                              • Managing parks and forests and promoting and
Wellington is projected to have about 15-45 extra                          facilitating recreational activities
days per year where maximum temperatures                                 • Promoting regional economic development
exceed 25 degrees, with around 10-20 fewer frosts
per year. Seasonal projected temperature changes                         Potential climate change impacts on GWRC’s
 \XYX    ^YYX    ^_[*                                operations and infrastructure across the region
 #    \\[* \^[*  \^[*                             include:21
summer, winter and autumn respectively.19
                                                                         Water supply and security
3.2.3     Key climate change risks                                       • Salt water intrusion into freshwater aquifers
`    ;     !                              could occur as a result of rising sea levels and
the Regional Policy Statement are:                                         storm surges
{ | /   "                                        • Regional droughts and changing rainfall
     coastal erosion and inundation and river                              #         
           #                               • Contamination of drinking water from storms
     storm surge                                                               
(b) Increased frequency and intensity of storm                           • Impacts on water storage e.g. extreme weather
                                                      
     landslides, severe wind, storm surge, coastal
     erosion and inundation                                              Maintaining regional biodiversity
                                                                         • Changes in storm and rainfall intensity are
19 Ministry for the Environment, 2008. Preparing for Climate Change: A     predicted to increase disturbance to species
   guide for local government in New Zealand.                              communities
                                                                         •    !   "#     
                                                                           in carbonate communities
                                                                         • Sea-level rise is likely to impact on coastal
                                                                           species, altering/ moving coastal habitats,
                                                                                #     
                                                                           vulnerability to storm surges and tides
                                                                         • Changes to seed production in plants related to
                                                                           warming e.g. increases in beech forests

                                                                         20 Greater Wellington Regional Council. 2013. Regional Policy Statement
                                                                            for the Wellington region.
                                                                         21 Note there is a degree of overlap between some of the issues identified
                                                                            under the various GWRC functions and operational areas listed below.
                                                                            Where appropriate, different GWRC departments will work together on
                                                                            mitigation and adaptation options.

        Waimeha Restoration group member helps                                                                                                                                                 7
        plant at Waimeha Lagoon, Waikanae
• *    #              Land management
                                  laying in some bird species                        • Changes in appropriate land use will likely
                                • *                             have an economic impact on farmers and land
                                  recruitment and mortality rates                       owners
                                • Decline in suitable bird habitat could increase    • Storm events and heavy rainfall will lead to
                                  the regional extinction risk                          increased erosion
                                • Changes in marine species and habitat              • *    #     
                                  distribution e.g. giant kelp beds on the              reduce water availability for irrigation
                                  Wellington coast are at their northernmost limit   • '   ! 
                                  and may be lost
                                • General uncertainty around how ecosystems
                                  will respond- some vulnerable sites may
                                  become unviable
                                                                                     4. Greater Wellington
                                Biosecurity – regional pest management                  Regional Council’s
                                • Impacts on pest distributions – climate change
                                    "#    !  
                                                                                        strategic approach
                                  of pest organisms that are already established
                                                                                     4.1 Vision
                                  elsewhere in the country
                                                                                           
                                • A warmer average temperature and milder
                                                                                     the long-term resilience and sustainability of the
                                       "    
                                                                                     Wellington region through climate change action
                                  species in the region – some plant species will
Draft Climate Change Strategy

                                                                                     and awareness.
                                         
                                           
                                                                                     Sustainability is about improving the quality
                                  success
                                                                                     of human life while living within the carrying
                                • Changes in survival or spread rates increases
                                                                                     capacity of supporting ecosystems.22 Sustainability
                                  control costs and could jeopardise biosecurity
                                                                                     requires thinking long-term and proceeding in a
                                  control programmes
                                                                                     way that sustains life and ensures we leave future
                                • *             
                                                                                     generations with access to at least as much natural
                                  use by farmers and other industries, potentially
                                                                                     capital as we have now.”23
                                  "#      
                                  pathways for pests
                                                                                     Resilience means the capacity of the region
                                                                                     to absorb and bounce back from shocks and
                                Flood protection
                                                                                     disturbances,24 and to make decisions that are
                                • Floods are likely to become more intense,
                                                                                     "          
                                   resulting in increased risk to major
                                                                                     and uncertainty.25 This suggests an ability to
                                             
                                                                                     maintain core functions in the face of hazard
                                   protection measures
                                                                                     events and impacts. However, resilience is not
                                • The onset of climate change and its predicted
                                                                                     simply about maintaining the status quo or
                                   #        "# 
                                                                                     enabling ‘business as usual’. Resilience is also
                                   to further increase the risk to communities
                                                                                     concerned with innovation and transformation into
                                        =      # 
                                                                                     more desirable functions and forms.26 Resilience
                                   
                                                                                     is about understanding processes of change
                                • Potential changes in land use or river channels
                                                                                     and is a product of governments, businesses,
                                     \^     !   
                                                                                     communities and individuals with strong adaptive
                                   the characteristics of the catchment and hence
                                             

                                Regional land transport
                                • Disruptions to rail and bus services due to        22 IUCN/UNEP/WWF. Caring for the Earth: A Strategy for Sustainable
                                                                                        Living. (Gland, Switzerland: 1991).(IUCN - The World Conservation
                                  storm events, coastal erosion and sea level rise      Union, UNEP - United Nations Environment Programme, WWF - World
                                • Inundation of low-lying coastal land transport        Wide Fund for Nature).
                                  infrastructure (road and rail) caused by sea       23 Friends of the Earth Scotland http://www.foe-scotland.org.uk/ ; Thomas
                                  level rise and storm surge                            Jefferson Sustainability Council http://www.tjpdc.org/
                                •                   24 Adger et al., 2011. Resilience implications of policy responses to
                                                                                        climate change. WIRES Climate Change 2011. 2 pp. 757-766 DOI:
                                  and rail networks that are already prone to           10.1002/wcc.133. Nelson et al., 2007. Adaptation to environmental
                                                                                 change: contributions of a resilience framework. Annual review of
                                • Inland erosion, instability, and increased storm      Environment and Resources (32) pp. 395-429.
                                  events pose a risk to road and rail networks and   25 Haasnoot et al., 2012. Dynamic adaptive policy pathways: A method for
                                                                                        crafting robust decisions for a deeply uncertain world. Global Environ.
                                  infrastructure                                        Change, http://dx.doi.org/10.1016/j.gloenvcha.2012.12.006
                                                                                     26 Folke, C. 2006. Resilience: the emergence of a perspective for social-
                                                                                        ecological systems analyses. Global Environmental Change (16) pp.
                                                                                        253-267.
                                                                                        Nelson, D.R. 2010. Adaptation and resilience: responding to a changing
                                                                                        climate. Wiley Interdisciplinary Review Climate Change (2) pp. 113-120.
8
capacity.27   !       #                              government’s principal policy response to climate
to respond successfully to climate variability                               change, the Emissions Trading Scheme (ETS).29 To
and change, and includes adjustments in both                                 date the ETS has lacked regulatory certainty and
behaviour and in resources and technologies.28                               the current price signal is considered too weak
Resilience in this sense encapsulates several facets,                        to incentivise behaviour change and low-carbon
including economic resilience, which is supported                            investments.30
by the transition to an innovative low-emission
economy and improved regional energy security.                               In the face of slow progress towards meaningful
                                                                             action to reduce greenhouse gas emissions at
The Strategy’s vision acknowledges the key role                              the national and international level, many local
that GWRC can play in contributing to the region’s                           governments around the world are demonstrating
sustainability and resilience to climate change.                             strong leadership and commitment to addressing
Many other stakeholders have a crucial role to                               emissions at the city and regional level.31 The
play in addressing climate change and engaging                               crucial contribution to climate change mitigation
in ongoing collaboration and partnerships is                                 that can occur at the sub-national scale is
necessary to make material progress on this                                  increasingly being recognised internationally.
 # "  ‚;=*                                         Christiana Figures, Executive Secretary of the
with the community, businesses, other councils                               United Nations Convention Framework on
and central government in pursuing the objectives                            *   *  {ƒ%„***|    @ *  
of this Strategy.                                                            change is not a one-person or a one-sector issue.

                                                                                                                                                            A strategy to guide the Wellington Regional Council’s climate resilience activities
                                                                             It cannot be solved by one country or by one
4.2 Overarching objectives                                                   level of government; it requires everyone to work
The Strategy has three core strands that together                            together.”32
span the range of areas that GWRC will focus on
to achieve our vision: mitigation, adaptation, and                           GWRC is commited to working with other
awareness.                                                                   partners and sectors to help to create a smart,
                                                                             innovative, low-carbon regional economy. This
Mitigation                                                                   commitment can be realised through GWRC’s
The overarching mitigation objective is                                      multiple roles as facilitator, partner, regulator,
                                                                             funder, planner, advocate and resource manager.
 ! 
" # $    & $                        GWRC’s Corporate Sustainability Action
helping to create the conditions for a smart,                                Plan contains targets to reduce the emissions
innovative, low-carbon regional economy                                      associated with its operations. GWRC has made
                                                                             a commitment within the 10 Year Plan 2015-25 to
 !  #                                                  measure and report annually on its emissions and
mitigation: the reduction of greenhouse gas                                  demonstrate a reduction in its corporate emissions.
emissions and removal of carbon from the                                     The 2014/15 GWRC carbon inventory will be
atmosphere through planting trees and preserving                             used as a baseline to measure future increases or
forests. Mitigation activities aim to address the                            decreases in emissions.
drivers of human-caused climate change so that
the worst impacts can be avoided.                                            Adaptation
                                                                             The overarching adaptation objective is
Amendments made to the Resource Management
Act under the Resource Management (Energy                                    Risks from climate change-related impacts are
and Climate Change) Amendment Act 2004 put                                   managed and resilience is increased through
legal responsibility for regulating greenhouse gas                           consistent adaptation planning and actions based
emissions more clearly in central government’s                                 ' "
hands by introducing provisions that exclude
                                            The observed impacts of climate change are
greenhouse gas emissions on climate change when                              widespread and consequential. Climate change
making rules to control discharges to air and when                           cannot be addressed through mitigation alone;
considering an application for a discharge permit.                           adaptation planning is also essential to reduce
The amendments were designed to avoid double                                 vulnerability to the increasingly severe and
regulation (i.e. regulation of greenhouse gas
emissions at both the central and local government                           29 New Zealand Government. 2002. Climate Change Response Act.
level) and to enable greenhouse gas emission                                 30 Luth Rickter, J., and Chambers, Lizzie. 2014. Reflections and Outlook for
reductions to be addressed through central                                      the New Zealand ETS: must uncertain times mean uncertain measures?
                                                                                Policy Quarterly – Volume 10, Issue 2. Pp. 57-66.
27 Satterthwaite et al., 2007. Building climate resilience in urban areas    31 Carbon Cities Climate Registry. 2013. Local Response to Measurable
   and among urban populations in low- and middle-income nations.               Reportable Verifiable Global Climate Action. http://carbonn.org/
   Commissioned by the Rockefeller Foundation, International Institute for      fileadmin/user_upload/cCCR/cCCR_2014/cCCR-2013-annual-report.pdf
   Environment and Development (IIED) Research Report, 112pp.                32 R20 Regions of Climate Action. September 2014. Press release: New
28 Intergovernmental Panel on Climate Change. 2007. Working Group               Compact of States and Regions launched at UN Climate Summit. http://
   II: Impacts, Adaptation and Vulnerability. Section 17.3.1 Elements of        regions20.org/about/news/101-press-releases/148-new-compact-of-
   Adaptive Capacity.                                                           states-regions-launched-at-un-climate-summit
                                                                                                                                                                                                     9
pervasive impacts of climate change already                            and performance of regulatory functions in a
                                occurring.33 GWRC has a clear mandate to                                         
                                undertake climate change adaptation planning as                            ƒ   ^]   +‚L
                                expressed through a range of legislation.                              councils are also directed, in taking a sustainable
                                                                                                       development approach, to take into account:
                                GWRC is mandated under Section 7 of the                                (i) the social, economic, and cultural interests of
                                Resource Management Act 1991 (the RMA) to have                               people and communities; and
                                #                                              (ii) the need to maintain and enhance the quality
                                                                                                             of the environment; and
                                This requires explicitly considering whether                           (iii) the reasonably foreseeable needs of future
                                           !                                         generations.35
                                implications for GWRC responsibilities, such as
                                natural hazard management and the design and                           Additionally, the Soil Conservation and Rivers
                                            +                           Control Act 1941 gives GWRC the mandate to
                                #     !                                         #      {  # 
                                greenhouse gas emissions and on vulnerability                                  # !   
                                      #  *                                    change), and undertake physical works to mitigate
                                of land use is a function of territorial authorities                   erosion damage.36
                                (city and district councils) through their district
                                planning processes.34                                                  Further, the Civil Defence Emergency
                                                                                                       Management Act 2002 requires councils to
                                GWRC also has a responsibility to integrate                            improve and promote the sustainable management
Draft Climate Change Strategy

                                climate change adaptation into its long term                           of hazards, many of which will be exacerbated
                                #    + ‚ L \XX\                                   by climate change such as storm surge, erosion,
                                {  +‚L|  #                                             *        
                                current and future needs of communities for good                       planning across the four R’s – reduction, readiness,
                                quality local infrastructure, local public services,                   response, and recovery.37

                                33 Intergovernmental Panel on Climate Change. 2014. Working Group II
                                   AR5 Report: Impacts, Adaptation and Vulnerability.                  35 Local Government Act. 2002. s 14 h
                                34 GWRC can only control land use for the purpose of managing water    36 Soil Conservation and Rivers Control Act. 1941.
                                   quantity and quality                                                37 Civil Defence Emergency Management Act. 2002. s 3

                                   A section of track hangs unsupported after the June 2013 storm which caused unprecedented damage
                                   to the foundations of the track and seawall on the Wairarapa Line between Petone and Ngauranga

10
Engagement and awareness                                              4.3 Implementation principles
The overarching awareness objective is                                In pursuing the Strategy’s objectives, GWRC will
                                                                      be guided by the following principles:
  " 
mitigation and adaptation solutions increases and                     • Balance of immediate and long-term needs:
individuals and organisations know what they can                        Acknowledge that climate change impacts
do to contribute to the long term resilience and                        will continue to take shape over the long term
sustainability of the region.                                           based on our actions today, but they are already
                                                                        emerging. The aim is to ensure our approach
Some of the major challenges of climate change                             !       
are its broad scope, the large number of actors                         and long-term needs.
and stakeholders involved, and its perceived
intangibility. Since both local and central                           • Interaction must be supplemented with
government are directly responsible for only a                          action: The complex and trans-boundary
small proportion of greenhouse gas emissions, it                        nature of climate change requires coordinated
is important that governments at all levels play                        action across a large number of stakeholders
an active role in raising awareness about climate                       to manage the risks. However, coordination
change and encouraging businesses, communities                                        
and individuals to adjust their behaviour in ways                       scales and jurisdictions is challenging. GWRC is
that reduce emissions and improve adaptive                                                

                                                                                                                                                  A strategy to guide the Wellington Regional Council’s climate resilience activities
capacity.                                                                            
                                                                           $         
Central government policies and legislation can                         inaction of others.
be used to raise the cost of activities that emit
greenhouse gases, and local government policies                       • Commitment to act in the face of uncertainty:
can discourage or disallow activities that create                       Acknowledge the tendency to not act until
vulnerabilities to climate change impacts. Policies                     perfect information is available, and the
and regulations can also be designed to reduce                          reality that perfect information on the impacts
the costs of activities that lower emissions and                        of climate change will never be available as
promote adaptation.                                                     climate change scenarios are being revised
                                                                        and improved regularly. GWRC therefore
Such policies and measures can encounter                                commits to an approach that enables us to make
inertia, passive resistance or active opposition,                       decisions in the face of uncertainty.39
particularly from those concerned about the
imposition of a new cost. Working with the
community and providing information and                               39 Adapted from ICLEI Local Governments for Sustainability. 2008.
explanations is therefore vital for generating public                    Cities for Climate Protection Australia Adaptation Initiative – Local
and stakeholder support for policies that seek                           Government Climate Change Toolkit. http://oceania.iclei.org/fileadmin/
                                                                         user_upload/Oceania/Documents/Toolkit_CCPAdaptation_Final.pdf
to address climate change drivers and impacts.
Public engagement and participation can also
motivate voluntary changes in habits, address the
      ## # !           
and help to prepare younger generations for living
in the world they will inherit.38

38 United Nations Environment Programme. 2006. Raising Awareness of
   Climate Change – A handbook for Government Focal Points. http://
   www.unep.org/delc/Portals/119/UNEP_Climate_Change_Handbook.pdf

                                                                                                                                                                   11
4.4 Policies
                                There are eleven policies that each relate to one of the three overarching objectives.

                                   Overarching objectives                                       Policies

                                                                                               1.1 Seek to remove barriers to the use and development of
                                                                                               renewable energy and improved energy efficiency in the region

                                                                                               1.2 Promote and provide attractive and accessible low emission
                                                                                               transport in our own fleet and in future public transport
                                                         GWRC acts to reduce GHG               contracts
                                                         emissions across all its areas
                                                         of influence, including its own
                                   Mitigation                                                  1.3 Encourage cleaner production and disposal practices in
                                                         operations, helping to create the
                                                                                               business and agriculture
                                                         conditions for a smart, innovative,
                                                         low-carbon regional economy

                                                                                               1.4 Demonstrate a commitment to low emissions across all our
                                                                                               corporate activities and investments
Draft Climate Change Strategy

                                                                                               1.5 Support and coordinate tree planting and ecological
                                                                                               restoration projects and protect carbon sinks from the impacts
                                                                                               of invasive species

                                                                                               2.1 Consider the effects of climate change as an integral part
                                                                                               of planning and decision-making

                                                         Risks from climate change-related     2.2 Increase long-term adaptive capacity through the use of
                                                         impacts are managed and resilience    adaptive planning tools and techniques
                                   Adaptation            is increased through consistent
                                                         adaptation planning based on best
                                                         scientific information                2.3 Identify key climate change information requirements

                                                                                               2.4 Implement planning and policy measures that increase
                                                                                               long-term resilience to climate change impacts

                                                         Community awareness of
                                                         climate change mitigation and         3.1 Share knowledge
                                                         adaptation solutions increases
                                   Engagement and
                                                         and organisations and individuals
                                   Awareness
                                                         know what they can do to improve
                                                         the long term resilience and          3.2 Advocate, empower and collaborate
                                                         sustainability of the region.

12
Appendix 1                                                          initiatives. Furthermore, the application of national
                                                                    projection data at a regional level has some
                                                                    important limitations.40
Wellington region greenhouse gas emission
projection scenarios
                                                                    Business as Usual Scenario
As part of the Wellington region Greenhouse Gas
                                                                    The BAU scenario assumes a continuation of
'  # #‡  ƒ=/ % &  + 
                                                                    the broad trends of key economic drivers and
    !       
                                                                    #          
develop illustrative emission projection scenarios.
                                                                    and fuel choices. This illustrates the current best
The emission projections combine recent regional
                                                                    guess, without additional policies and initiatives
emission trends (Wellington Regional GHG
                                                                    to reduce emissions. This does not necessarily
Inventory) with regional projections data (Regional
                                                                    represent our expectation of what is going to
+   # } |    #‡ 
                                                                    happen.
data (Energy Outlook Model).
                                                                    The key assumptions are:
The aim of the emission projections outlined is
                                                                    • Moderate oil and carbon prices
to inform the policy and planning debate and to
                                                                    • %   #    !  
 #  #      
                                                                      collection systems and waste water treatment
questions:
                                                                      systems in the region
• What emissions trend can be expected under
                                                                    • No additional renewable electricity generation

                                                                                                                                                A strategy to guide the Wellington Regional Council’s climate resilience activities
    Business as Usual (BAU)?
                                                                      (above what is currently already planned)
• What are the levers that the councils could pull
                                                                    • Continued growth in aviation emissions
    to change BAU emission trends?
                                                                    • HFC, PFC and SF6 emissions following MfE
• Which levers have the most impact on the
                                                                      projections for national emission trends
    overall emissions?
                                                                    • Disestablishing of Wellington City’s electric
• Which levers do the councils have direct control
                                                                      trolley busses in 2017. Busses are supplemented
    over and which are dependent on central
                                                                      by diesel busses, similar to the currently used
    government or market forces?
                                                                        
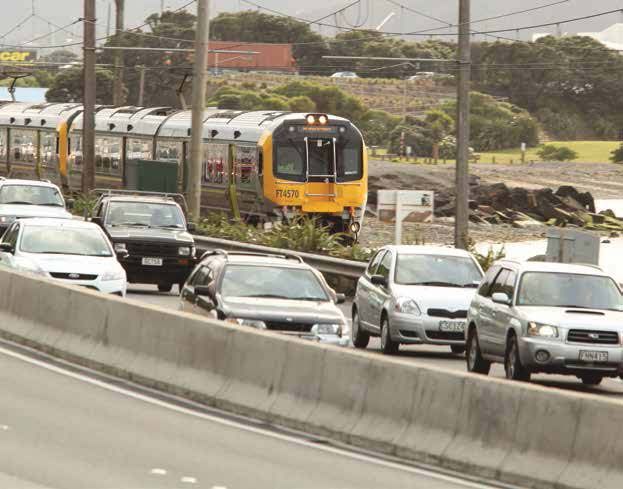
The scenarios are not meant to be policy predictive
                                                                    Under the BAU scenario, net GHG emissions for
and are aimed at illustrating the potential
                                                                    the Wellington region are projected to increase
emissions development based on high level
                                                                    from 1,683,376 tCO2e in 2012/13 to 1,739,825 tCO2e
assumptions. Similarly, the emission reductions
                                                                    in 2019/20.
described in the ‘high ambition emission
reduction’ scenario are not based on a detailed
                                                                    This represents a 3% increase, which is a reversal
  !         
                                                                    of the observed trend from 2000/01 to 2012/13.
potential impact of possible emission reduction
                                                                    40 The Energy Outlook Model uses national and international data and
                                                                       historic trends. These may differ from historic trends observed in the
                                                                       region.

Business as Usual scenario – Wellington region GHG Emissions Profile Projection

          2,000,000

          1,500,000

          1,000,000

                                                                                                                   Stationary energy
            500,000
                                                                                                                   Mobile emissions
t CO2 e

                 -                                                                                                 Waste
                                                                                                                   Industry, HFCs, PFCs, SF6
           -500,000
                                                                                                                   Agriculture
          -1,000,000                                                                                               Forestry
                                                                                                                   Total incl. forestry
          -1,500,000

          -2,000,000

          -2,500,000
                       2000/01 2012/13 2013/14 2014/15 2015/16 2016/17 2017/18 2018/19 2019/20

                                                                                                                                                                 13
High Ambition Emission Reduction Scenario – Wellington region GHG Emission Profile Projection

                                          2,000,000
                                                                                                                                                         Stationary
                                          1,500,000                                                                                                      energy

                                          1,000,000                                                                                                      Mobile
                                                                                                                                                         emissions
                                           500,000
                                                                                                                                                         Waste
                                t CO2 e

                                                -
                                                                                                                                                         Industry ,
                                          -500,000                                                                                                       HFCs, PFCs,
                                                                                                                                                         SF6
                                      -1,000,000                                                                                                         Agriculture

                                      -1,500,000
                                                                                                                                                         Forestry
                                      -2,000,000

                                                                                                                                                         Net Emissions
                                      -2,500,000
                                                      2000/01   2012/13   2013/14    2014/15   2015/16   2016/17   2017/18   2018/19    2019/20
Draft Climate Change Strategy

                                High ambition emission reduction scenario                                          !  #   
                                The high ambition scenario illustrates the changes                        infrastructure changes are necessary, in addition
                                that are necessary to achieve a 30% reduction in                          to market drivers, technology advancements and
                                overall net emissions in the Wellington region. Key                            !    
                                assumptions are:                                                          overall regional emissions.
                                • High oil and carbon price
                                • /!   #                                              !          
                                   renewable electricity generation within the                            emission reduction contributions of individual
                                   region                                                                 emission sources compared to the business as
                                • /!  #   !                                           usual scenario and the following table presents the
                                   collection and waste water treatment systems                           percentage contribution each source makes to the
                                • Additional reductions in agricultural emissions,                        overall projected reduction.
                                   on top of historic trends (+5% absolute)
                                • =  +ƒ+ƒ*„41 emissions and                                        High ambition scenario – contribution of individual
                                   sequestration trend plus 50% increase in                               emission sources
                                   historic sequestration trend (i.e. an increase in                        Emission source                       Contribution
                                   carbon sequestration values)                                                                                   to reduction
                                • 25% reduction in trend for HFC, PFC and SF6
                                   emissions projected by MfE                                               Electricity improvements                   19.9%
                                • Doubling of current electric busses and
                                                                                                            Natural gas improvements                    1.6%
                                   replacement of 50% of diesel busses with
                                   hybrid diesel busses                                                     Reduction in coal use                       0.6%
                                • /!  #       #
                                   and aviation.                                                            Petrol improvements                        13.4%
                                                                                                            Diesel improvements                         8.3%
                                Under the high ambition reduction scenario net
                                GHG emissions for the Wellington Region are                                 Bus improvements                            0.4%
                                projected to decrease from 1,683,376 tCO2e in                               Aviation improvements                      16.0%
                                2012/13 to 1,185,920 tCO2e in 2019/20, which
                                represents a 30% emission reduction compared to                             Solid waste improvements                   14.7%
                                business as usual. The changes modelled in this
                                                                                                            Waste water improvements                    0.4%
                                scenario demonstrate potential emission reduction
                                initiatives. There are likely to be other initiatives                       Industry sector gains                       2.9%
                                that have not been included in the scenario above.
                                                                                                            Agricultural sector gains                  18.4%
                                To a large degree the emission reductions are                               Forest sector gains                         3.3%
                                          
                                of the local councils, such as Gross Regional                               Total reduction (tCO2e)                  -556,000t
                                Product, carbon price and oil price. However, this

                                41 LULUCF = Land Use, Land Use Change and Forestry
14
Closing comments                                                      magnitude included in the high ambition scenario
Under a BAU scenario, the GHG emissions of the                        is unlikely to be feasible by 2020 given the time
Wellington region are expected to increase by 3%                      required for consenting and construction of new
by 2020. This represents a reversal of the historic                   commercial generation, projected low national
trend between 2000/1 and 2012/12, which indicated                     demand for new generation, and historical and
a small reduction in overall emissions. Under                         current low uptake of distributed renewable
this scenario, ongoing annual improvements in                         generation.
 Š          
outpaced by increases in overall emissions due to                     /!      #  
assumed rates of population and GRP growth.                           are unlikely over the short timeframe of the
                                                                      projections, given relatively inelastic responses
The emission reduction scenario illustrates that                      by the transport sector to energy pricing and
!      #                                  the historically slow rate of behaviour change
consumption supported by high energy and                              in shifting away from car travel. The feasibility,
emission prices would be needed to deliver a 30%                          !      #  
reduction by 2019/20 relative to 2000/01. Energy                      interventions would require careful evaluation.
and emission price changes of this magnitude                          The uptake of biofuel for transport is outside the
are unlikely to be feasible by 2020 without                           direct control of the local councils and may be
!  #                                       Š   #  42
government or unforeseen market developments.

                                                                                                                                              A strategy to guide the Wellington Regional Council’s climate resilience activities
New regional renewable generation of the
                                                                      42 URS New Zealand Ltd. 2014. Greenhouse Gas Inventory for the
                                                                         Wellington Region Report. http://www.gw.govt.nz/assets/About-GW-
                                                                         the-region/Wellington-GHG-Inventory-Report-Final.pdf

High ambition
      2,000,000 scenario – sector contributions (30% reduction compared to BAU)

          1,800,000

          1,600,000                                                                                               BAU trend
                                                                                                                  Electricity improvements
          1,400,000
                                                                                                                  Natural Gas improvements
                                                                                                                  Reduction in Coal use
          1,200,000
                                                                                                                  Petrol improvements
t CO2 e

                                                                                                                  Diesel improvements
          1,000,000
                                                                                                                  Bus improvements
                                                                                                                  Aviation improvements
           800,000
                                                                                                                  MSW improvements
                                                                                                                  Waste Water improvements
           600,000
                                                                                                                  Industry sector gains
                                                                                                                  Agricultural sector gains
           400,000
                                                                                                                  Forest sector gains
                                                                                                                  High ambition trend
           200,000

                 0
                 2000/01   2012/13   2013/14   2014/15   2015/16   2016/17     2017/18     2018/19     2019/20

                                                                                                                                                               15
For more information contact the Greater Wellington Regional Council:
                                                                        Follow the Wellington    October 2015
Wellington office     Upper Hutt office     Masterton office              Regional Council      GW/SP-G-15/124
PO Box 11646          PO Box 40847          PO Box 41
Manners Street        Upper Hutt 5018       Masterton 5840
Wellington 6142
                      04 526 4133           06 378 2484                   info@gw.govt.nz
04 384 5708                                                               www.gw.govt.nz
You can also read