CMBS TURNS 25 - THE TWISTS AND TURNS OF BUILDING AN INDUSTRY FROM SCRATCH - Trepp
←
→
Page content transcription
If your browser does not render page correctly, please read the page content below
CMBS TURNS 25

     THE TWISTS AND TURNS OF
BUILDING AN INDUSTRY FROM SCRATCH
INSIDE THE MID-YEAR
             The CMBS Market Turns 25:                                        CMBS: A Market That Has a Deeper Role
           From Mega Deals to Miami Beach                                      in CRE Than the Numbers Indicate

   The twists, turns, near-misses and memories of building                  The CMBS market is among the most sophisticated
               an industry f rom scratch. Page 4.                       and transparent markets around. That's why it's important
                                                                         to understand the role it plays in commercial real estate,
            Today's CMBS: Born of Necessity                                 as well as its similarities —and differences —f rom
               in Capital-Star ved Times                                            other investment options. Page 22.

 In the wake of the savings and loan crisis, few lenders were               Hotel Sector Proves Resilient Despite Blips
  willing to write mortgages against commercial properties.
     But a team led by Ethan Penner saw an opportunity                 The U.S. hotel industry has seen improved operating metrics
    to originate commercial mortgages with an eye toward                 for eight straight years. It's proven a relatively resilient
                   securitizing them. Page 5.                            property sector over the past two and a half decades. But
                                                                       because of its correlation with economic growth, it's the f irst
   CMBS Conduit Loss Severities: Credit Matters                                       to suffer in a downturn. Page 24.

 Transactions with greater underwritten loan-to-value ratios                Multifamily: From a Second-Tier Asset Class
  generally underperform those with less leverage. Page 12.                              to King of the Hill

     A Soft Landing for the Next Maturity Wave                              Multifamily wasn't always the stable, fast-growing
                                                                                sector it is today. Demographic shifts and
  With ample liquidity in the commercial real estate market,                         GSEs drove the change. Page 28.
   lenders and investors don’t anticipate property values
             to decline anytime soon. Page 16.                                        Known Quantities: A Look
                                                                                      at Repeat Loans in CMBS
            Timeline of the CMBS Industry
                                                                          The leverage characteristics and other f inancial metrics of
        A brief stroll down memory lane, highlighting                  repeat loans provide insights into ref inance opportunities and
         the evolution of the CMBS market. Page 18.                      enables the CMBS sector to use those insights to push new
                                                                          issuance and maintain borrower relationships. Page 30.
         Things to Do Before Election Season;
       3 Issues That Need to Be On Your Radar                                    CMBS Mall Loans Take It on the Chin

  With the presidential election about a year and a half away,               CMBS loans backed by shopping malls have suffered
 CREFC is tracking three issues that also should be monitored               among the greatest losses. Underwriting metrics have
   by investors and Congressional leaders: Current Expected                improved since the recession, but risks remain. Page 32
       Credit Loss; Opportunity Zone implementation;
                                                                                             The Data Digest
                and cannabis banking. Page 20.
                                                                            The digest provides insight on CMBS loan defaults,
                                                                                delinquencies and special servicer volumes
                                                                                  during the f irst half of 2019. Page 34

                                          Commercial Real Estate Direct
                                                      350 S. Main St. #312
                                                         P.O. Box 1865
                                                     Doylestown, PA 18901
                                                           267-247-0112

www.crenews.com                                                  -2-                                              Mid-Year 2019
LETTER FROM THE EDITOR

                          The year 2019 marks the 25th for the CMBS market. In 1994, the U.S. wasn't all that far
                          removed from the S&L crisis and ensuing recession. Hundreds of banks had been seized
                          and large portfolios of bank commercial real estate properties and loans had to be liquidated.
                          Confidence in commercial real estate markets over the previous five years had evaporated
                          and liquidity was nowhere to be found. From that wreckage emerged the first hints of what
                          would become the modern-day CMBS market. The earliest deals included just a handful
                          of large loans. But the first multi-borrower deals unlocked the market and provided the
                          templates for other banks to start lending against commercial properties and warehousing
                          loans for securitization.

    Orest Mandzy          Quickly, deal sizes grew, more participants entered the market, lending spreads compressed,
    Managing Editor       and securitizations went from a handful of loans to hundreds. Amazingly, some of the
                          founding fathers (and mothers, of course) of the market still remain active in the industry
                          and are still committed to its ongoing development.

    If we had to describe two things that have consistently separated the CMBS market from many others, it would
    be these: market participants across the spectrum of industry roles have never shied away from doing the heavy
    lifting of creating standards and fighting for transparency. As a result, the market has been able to consistently
    evolve through ever-changing environments. It's a testimony to the professionalism and persistence of those in the
    CMBS industry.

    This 2019 Mid-Year magazine is devoted in part to a review of the 25 years of CMBS. From those first "mega"
    deals, to Confed, the first crisis (the Long Term Capital meltdown) and beyond. We hope it evokes some long-lost
    memories for those who lived through the good and bad times and proves instructive for those who are fairly new
    to the industry. We include an interview with Ethan Penner—one of the driving forces behind the emergence of
    the CMBS market in 1994.

    That brings us to the current state of the market at the almost half-way point of 2019. We would call the year-to-
    date another testament to the market's resiliency.

    At the end of 2018, talk of recession was in the air. High yield and leveraged lending had slowed and there was
    concern that it would spill over into CRE lending. Beyond that were the apprehensions of the demise of brick-
    and-mortar retail and how CMBS could continue to keep pace in the post "Wall of Maturities" age.

    The market has responded with remarkable steadiness so far this year. Issuing spreads largely have been stable, even
    in the face of broader market volatility. The retail headlines seemingly never have been worse than over the last few
    months, yet CMBX and CMBS spreads from the 2013 and 2014 vintages haven't been impacted materially. CRE
    lending soldiers on even as talk of trade wars, government changes in Europe and recession continue to rattle the
    broader markets.

    We'd call that just another example of a market built for the long term.

    We hope you enjoy this edition of the Mid-Year and find the articles and information we've compiled useful. As
    always, we look forward to your feedback.

                         Best Regards,

                         Orest Mandzy

Mid-Year 2019                                              -3-                                       www.crenews.com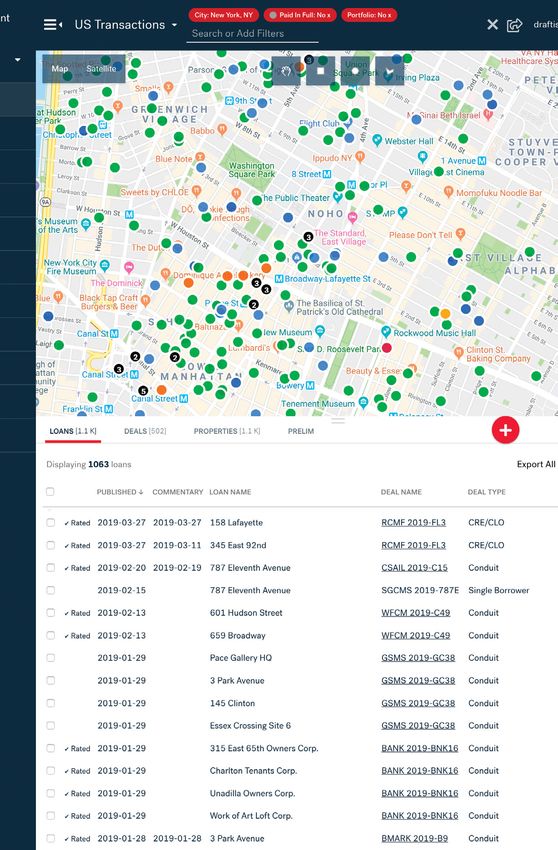
The CMBS Market Turns 25: From Mega
                Deals to Miami Beach
                 The Twists, Turns, Near-Misses and Memories
                     of Building an Industry from Scratch
 By Manus Clancy                                                 widening was underscored by the miserable execution of

 H
                                                                 Morgan Stanley Capital I Inc., 1998-CF1 (MSC 1998-CF1),
          eading into the summer                                 which priced in August 1998 near the height of the storm.
                                                                  But the CMBS industry was not one to turn its back on a
          of 1998, those who helped                              good time, and Penner's 1998 confab would go on in the face
          create the CMBS market                                 of the tumult.
had every reason to feel optimistic                                                   The Father of CMBS
about the industry's future. The
market was now several years old, a                                If Lewis Ranieri was the father of mortgage-backed
                                                                 securities and collateralized mortgage obligations, Ethan
number of banks had started "shelves"                            Penner was the father of CMBS.
for issuing CMBS deals and the types                               The beauty of residential loans, as far as securitization was
of issues had evolved from deals with                            concerned, was their homogeneity. There were no tenants to
                                                                 worry about; prepayment restrictions did not exist; borrower
just a few large loans to deals made                             names could not be revealed; and loans had similar terms.
up of hundreds of loans and balances                             An investor might know only a few pieces of information
                                                                 about a loan, its balance, rate, whether its coupon was fixed
totaling in the billions.                                        or floating, its term, location of its collateral and the property
                                                                 type. There wasn't much more than that.
  Lehman Brothers Commercial Trust, 1998-C1 (LBCMT                 Things were messier in the CMBS market. The Resolution
1998-C1), which amazingly still remains outstanding              Trust Corp. (RTC) was started in the late 1980's to help
more than 20 years later, was a case in point. It was issued     liquidate assets the federal government had inherited
in March 1998 and had 259 loans at securitization with a         from failed savings and loan institutions. The market for
total balance of more than $1.7 billion. It wasn't unique as     securitizing residential loans had been established years
other investment banks, including JPMorgan, Citigroup,           before the S&L crisis with the issuance of MBS and CMOs.
DLJ, Credit Suisse First Boston, Merrill Lynch, Morgan             The same couldn't be said for commercial mortgages.
Stanley and Goldman Sachs, each had launched their own.
Soon to follow would be Bear Stearns, Prudential Financial,
First Union, Deutsche Bank, Salomon Smith Barney, Paine              Data for the sector was considered
Webber and Wachovia Securities.
  By the time most of the industry assembled for CMBS              lumpy, idiosyncratic and incomplete.
pioneer Ethan Penner's annual post-Labor Day fete that             Nonetheless, the RTC found success
year, the CMBS market was already facing its first existential        creating securities backed by
threat. The Russian debt crisis that August had resulted in                 these "noisy" assets.
the collapse of Long-Term Capital Management. The hedge
fund buckled the following month and a consortium of 16
banks cobbled together more than $3 billion in bailout funds
to keep the LTCM default from turning into a financial           Data for the sector was considered lumpy, idiosyncratic and
market epidemic. As one CMBS Founding Father said at the         incomplete. Nonetheless, the RTC found success creating
time, "there's blood in the water."                              securities backed by these "noisy" assets.
  You might say, where there's blood, there's also rumor.          That gave Penner his opening. But credit for the structural
The scuttlebutt in the CMBS industry was that some of the        nuances of CMBS must go to the RTC. Its deals included
issuers were sitting on huge mark-to-market losses. The early    both a master and special servicer, for instance, which became
issuers, like today, would warehouse loans until they reached    a staple of CMBS deals.
critical mass for bringing a deal to market. They would hedge      Some of Penner's early deals came with the moniker
for interest rate risk, but spread-hedging was either non-       "mega." The deals contained a small number of large loans—
existent or tricky. They also tended to warehouse for longer     hence the "mega" name. The first such deal was Nomura
periods of time than they do now, so the balance of loans on     Asset Securities Corp., 1994-MD1, (NASC 1994-MD1).
the firms' books would swell.                                    Others could lay claim to having done the first CMBS deal,
  As spreads blew out late in the summer of 1998, the value
of the loans being warehoused plummeted. The spread                                                       Continued on next page

www.crenews.com                                              -4-                                              Mid-Year 2019
Today's CMBS: Born of Necessity
                      in Capital-Starved Times
  "Our need will be the real creator."       when he was part of the leadership          for Starwood Capital Group, which
                             - Plato         team on the residential mortgage-           then was only starting to buy
                                             backed securities desk at Morgan            apartment properties from the RTC,
   When Ethan Penner and his                 Stanley. He waded into the commercial       and Concord Asset Management,
 team in 1992 started originating            real estate sector in 1989 when             which focused on the retail sector.
 commercial mortgages with an eye            Signature Group, a Los Angeles outfit       In the latter case, the financing, a
 toward securitizing them, few lenders       focused on filling the void of mortgage     portfolio of non-callable, 10-year
 were willing to do so. Times were so        lending, turned to him to fund a            loans representing about 50 percent of
 desperate that even the best operators      credit line allowing it to leverage its     the value of the collateral properties,
 had a hard time getting a mortgage for      investments.                                was structured into bonds, which
 their properties.                                                                       were rated by Standard & Poor's, and
   To understand what exactly was                                                        ultimately pooled and sold as part
 going on, you'd have to rewind three            "Ever yone thought                      of Nomura Asset Securities Corp.,
 years, to 1989, the peak of the savings                                                 1994-MD1. Starwood's apartment
 and loan crisis, when more than
                                                    I was crazy."                        investments eventually became the
 1,000 thrifts failed. Those institutions            - Ethan Penner                      seed portfolio for Equity Residential.
 were among the top sources of                                                             In fact, the RTC issued a number
 mortgage capital for commercial                                                         of deals that could be considered
 property owners. Their failure and the                                                  precursors to CMBS. Those, however,
 regulations that ensued—most notably          Penner left Morgan Stanley and            were backed by distressed mortgages
 the Financial Institutions Reform,          formed Magellan Financial. With             and RTC typically retained a stake
 Recovery and Enforcement Act of             backing from Cargill Financial, he          in the transactions, so they were used
 1989—resulted in a dearth of available      funded a number of large loans that he      more as a portfolio management tool
 debt capital. That, in turn, drove a        sold as single-class, AA-rated bonds        as opposed to a financing mechanism.
 collapse in property values.                into Europe's floating-rate market.
   Penner's path toward CMBS began             Magellan also provided financing                              Continued on page 11

Continued from previous page                                        entered the market because of the sizable profits to be had,
                                                                    took a beating as well.
but earlier deals were either single-asset or single-borrower         It would not be the last time the market would face
transactions. NASC 1994-MD1 was backed by nine loans                adversity and certainly not the first time the industry's
against properties owned by different sponsors. It was the          resilience would be called into question. With that
first private-label, multiple-borrower transaction. Despite         introduction, we offer up a 25-year retrospective of the
having only nine loans in its collateral pool, the deal was         CMBS industry—the highs, lows, mistakes, innovations,
structured with 15 bond classes.                                    near-death experience and revival.
  Profits from early CMBS deals were sizable. After all, few
lenders were actively competing for loans. Penner used some                   Phase I – 1994-1998: The Early Days
of those profits to throw terrific parties that are still talked
about today. At one event, he talked the Eagles rock band             While Ethan Penner was at the center of the founding of
into reuniting for the entertainment of his audience. He            CMBS, he was hardly alone. Lehman Brothers and Credit
would raffle off cars to lucky winners. Bob Dylan would be          Suisse First Boston were also aggressively building teams to
coaxed into singing for the commercial real estate "man."           support the new financing vehicle.
  The 1998 version of Penner's gala was not lacking in star           The early deals were tricky for several reasons. First, the
power. Even as the foundations of the CMBS market rocked,           data was messy. Issuers struggled with how to represent
nothing at the San Francisco party hinted at the concerns.          lockout provisions. Even stickier were yield maintenance
Comedian Bill Maher hosted the opening session. Other               calculations. No two calculations seemed to be the same—
guests included former Presidential candidate and later             and describing the nuances in a prospectus was burdensome.
California governor Jerry Brown, as well as San Francisco             Interestingly, some of the early Nomura deals included
Mayor Willie Brown. The first night's dinner entertainment          extremely intensive calculations. In an effort to accurately
was provided by Diana Ross. On night two, Robin Williams            distribute yield maintenance charges, the calculation called
served as the warm-up act. He'd be followed by Joni Mitchell,       for all bonds' cash flows to be projected, first assuming
Stevie Nicks, Don Henley, Michael McDonald and Gwen                 the prepayment did not take place and then assuming the
Stefani, among others.                                              prepayment of the loan. The difference in cash flows between
  You could say that the San Francisco blowout was the end          the two scenarios would be discounted and served as the
of phase one of the CMBS market. Nomura would suffer
a $2 billion quarterly loss, but it wasn't alone. Others, who                                               Continued on next page

Mid-Year 2019                                                 -5-                                         www.crenews.com
Continued from previous page
                                                                              Important Moments in CMBS History
basis for distributing yield maintenance. As a result of the
complexity, a prepayment scenario could take 20 minutes to                  Merrill Lynch Mortgage Investors, 1996-C2
calculate. The method was noble, but impractical for traders.                            (MLMI 1996-C2)
It was phased out after a few deals.                                    First Conduit Totaling More Than $1 Billion in Loans
  Then came the issue of how much could be disclosed—                                     (Closed: 11/25/96)
Tenant names? Borrower names? Lease expiration dates? Net
operating income? Occupancy?                                                      First Union-Lehman Brothers
  Money managers were hesitant to allocate a great deal of                    Commercial Mortgage Trust II, 1997-C2
capital to the asset class because of the lack of transparency                           (FULB 1997-C2)
and liquidity in the space. At the time, data were transferred          First Conduit Totaling More Than $2 Billion in Loans
not by email, but through the distribution of floppy disks via                            (Closed: 11/25/97)
overnight mail or messenger.
  One of the most noteworthy contributions to the early                       Nomura Asset Securities Corp., 1998-D6
evolution of CMBS was the formation of what then was                                     (NASC 1998-D6)
the CSSA, the Commercial Real Estate Secondary Market                   First Conduit Totaling More Than $3 Billion in Loans
and Securitization Association, which in 1999 changed its                                 (Closed: 3/3/98)
name to the CMSA, or Commercial Mortgage Securities
Association, and more recently to CREFC, or Commercial                      GS Mortgage Securities Corp. II, 2005-GG4
Real Estate Finance Council.                                                            (GSMS 2005-GG4)
  The trade group was overseen by members from banks,                   First Conduit Totaling More Than $4 Billion in Loans
rating agencies, servicers and CMBS investors, all of whom                                (Closed: 6/23/05)
were committed to putting the industry on a strong footing.
  Among its early moves was the development in 1997 of                           JPMorgan Commercial Mortgage
the Investor Reporting Package, or IRP, a standardized                  Finance Corp., 2007-LDP10 ( JPMCC 2007-LDPX)
layout that would be adopted by all servicers and trustees              First Conduit Totaling More Than $5 Billion in Loans
for purposes of updating monthly loan and bond data. The                                  (Closed: 3/29/07)
IRP still exists and is now in its eighth iteration. But it was
the early founders that established the protocols and the                  GS Mortgage Securities Corp. II, 2007-GG10
schematics upon which the industry was built. The first                                 (GSMS 2007-GG10)
version contained some 100 of the most important bond and                  Only Deal to See More Than $1 Billion in Losses
loan property level fields. It's grown substantially since then                        ($1.24Bln - as of April)
to also include property and deal-level file standards.
  Another important milestone was the issuance in 1996                          COMM 2007-C9 (COMM 2007-C9)
by Lehman Brothers of Structured Asset Securities Corp.,                     2007 Deal With the Smallest Loss Percentage
1996-CFL (SASC, 1996-CFL). The so-called ConFed                                      (2.60 percent - as of April)
deal included 558 loans—some fixed, some floating—that                                                                  Source: Trepp LLC
had been on the books of the former Confederation Life
Insurance Co. The ability to securitize such a heterogeneous        investors discovered the technique, the practice was quickly
and sizable number of loans gave confidence to the fledgling        retired.
market that intricate deals such as this could get issued.            One footnote of this era came as a result of the LTCM
  One sign that the CMBS market was ready for prime time            crisis. The first conduit deal larger than $1 billion was issued
was that Jack Kemp, then vice presidential nominee, was             in late 1996; the first greater than $2 billion came exactly
tapped as keynote speaker at the industry's 1996 conference,        one year later; the first to pass $3 billion just four months
just two days following that year's presidential election.          after that. The industry would not see a $4 billion deal for
  Also advancing the market was the emergence of new data           another seven years. The lesson learned from watching big
and analytic providers. Conquest and Trepp (which owns              losses come from overstuffed warehouse accounts in 1998
Commercial Real Estate Direct) began to develop websites            led issuers to bring deals more quickly to market, rather than
and data sources that were better contoured to the nuances          letting risk linger awaiting securitization.
of commercial real estate. The tools gave investors better
transparency into collateral data. They also provided trading-         Phase II – 1999-2004: Dealing With Externalities
quality data and models to bond traders and developed
analytical tools for investors, allowing them to stress bond          The second phase of the CMBS market was dominated
cash flows.                                                         by events outside the control of the commercial real estate
  Issuers, trying to lure borrowers, briefly offered and            industry. The bursting of the dot-com bubble followed by the
underwrote "buy down" loans. In a nutshell, a borrower              terror attacks of Sept. 11, 2001 resulted in volatility, but they
would make an upfront cash payment in exchange for a lower          weren't existential threats to the CMBS industry.
coupon, effectively buying down the interest rate. But that           From 2000 to 2002, the bursting of the dot-com bubble
made the loans appear to have a higher debt-service coverage        resulted in a nearly 80 percent drop in the tech-heavy Nasdaq
ratio than they might have had without the buy down. When                                                        Continued on page 8

www.crenews.com                                               -6-                                               Mid-Year 2019
The next generation
                       of credit ratings

                             Leaders in CMBS
                Transparent and clear approach
                Flexibility to adapt to rapidly-changing market
                Real-world experience evaluating transitional collateral

                          SASB          Conduit             CRE CLO

                                  ratingagency@morningstar.com
                                          +1 800 299-1665

                                         @mstarcrdratings

Mid-Year 2019                               -7-                            www.crenews.com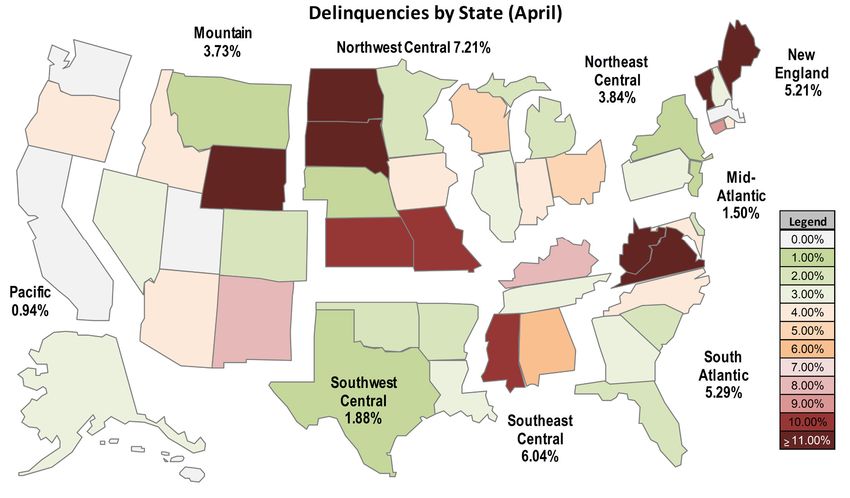
Continued from page 6                                                      Phase III – 2005-2007: The Go-Go Years

 stock index. By itself, this did not force the CMBS primary          If the years before the Great Depression of 1929 were
 market to become unglued. But the volatility in the market         known as the 'Roaring 20s' can we call the stretch between
 kept issuers on their toes. The huge collapse of the Nasdaq        2005 and 2008 the 'Imprudent Aughties?'
 index led to lower interest rates, however, which benefited          Unlike with the dot-com bubble, commercial real estate
 borrowers, even as bond spreads widened.                           was just about front and center for the Financial Crisis of
   More impactful were the 9/11 attacks. Once the nation            2008. The subprime residential mortgage market gets the
 began to emerge from its grieving, several questions had to        top spot, but commercial real estate certainly was up there.
 be answered: Would Americans continue to travel by air               The era saw explosive jumps in property values, the
 as readily as they had in the past? Sadly, would large office      collapse of borrowing spreads, which further pushed values
 buildings, hotels and shopping centers become soft targets?        higher, the growth of collateralized debt obligations, the
 Could properties be insured against terrorism risk?                introduction of synthetic CDOs, the start of "pro forma"
   The early reaction had the effect of suppressing issuance.       lending—that is, lending based on expected property
 In the wake of the 9/11 attacks, issuance came to a standstill.    income growth—and a sharp reduction of borrower equity
 Concerns about hotel loan defaults—particularly from               in properties. In fact, toward the end of the cycle, because
 vacation destinations—spiked. Bond issuance stalled                borrowers could line up generous layers of senior and
 until questions about how properties would be insured              mezzanine debt, as well as B-notes, they'd often have equity
 against damage caused by acts of terrorism were addressed.         totaling less than 10 percent of a property's value. That's
 Congress the following year passed the Terrorism Risk              not even considering the often inflated appraised values of
 Insurance Act, opening the door for property owners to             the time. If mark-to-market valuations had been done in
 obtain insurance against terrorist acts. CMBS issuance             2009, many loans from 2007 would have been found to have
 slowly re-emerged.                                                 negative equity.
   The second Phase of the evolution of the CMBS market               Of course, issuance took off as liquidity exploded. By
 ended with the market finding its footing.                         2007, total CMBS issuance peaked at $230 billion, a
   By 2004, optimism had returned and issuance grew.                record unlikely to be topped anytime soon. Newly issued
 Because of jitters from events early in the decade, the deals      benchmark CMBS bonds—those with the highest possible
 issued in 2003 and 2004 were underwritten conservatively           ratings and 10-year average lives—were being priced at
 and ultimately suffered only modest losses compared to             a spread of 25 basis points more than Treasurys or less.
 deals issued later. But the seeds for the next crisis were being   Spreads on BBB- bonds were regularly printing in the
 planted. Without much fanfare, mezzanine lending was               70-bp range. And many B-pieces—comprised of bonds
 starting to grow, giving borrowers the ability to put more         rated BB- and below—found their way into CDOs, which
 and more leverage on their properties. The securitization          allowed B-piece buyers to leverage their investments and
 of those mezz loans—along with the securitization of non-          effectively sell off much of the risk they held.
 investment grade bonds—began to emerge in late 2003 and              Other markets were opening up as well, as there was
 2004. Leverage on senior loans also began to increase, as          issuance growth in Europe and Japan during this time.
 did the volume of loans that paid only interest for their full
 terms.                                                                                                   Continued on next page

                                                 Deals Over Time
   • Seasoned/Portfolio Deals (popular from 1995-2001):               • Small Loan Deals (2004-2007): Programs set up by
 Seasoned Deals from a single lender to sell off balance sheet      banks to provide small-balance commercial real estate loans.
 loans by way of CMBS (see MSC 1998-HF1).                           Popular with Lehman Brothers, Washington Mutual and
   • Credit Tenant Deals (mid/late 1990s): Pools of loans           Bear Stearns.
 where the collateral leases were backed by corporate entities,       • Canadian Deals (1999-today): Issuance peaked from
 not the loan/property cash flow (see MLMI 1998-C1).                2005 to 2007.
   • Franchise Loan (late 1990s/early 2000s): See EMAC                • Single-Family Rental (starting in 2013): Loans to
 1998-1, FLT 1998-I, FFCA 1999-2).                                  single-family homes that had been purchased and leased
   • Collateralized Debt Obligation (2001 to 2007): Term            out.
 no longer used in polite company.                                    • Collateralized Loan Obligations (post crisis): Packages
   • ReRemic (2001-2008): Used to pool subinvestment                of transitional and mezzanine loans with relatively strict
 grade bonds (among other applications) to allow B-piece            reinvestment and underwriting criteria, replacing the
 buyers to increase leverage and raise new proceeds for future      politically incorrect CDO term.
 lending (ReRemics still exist today, but not for the purposes        • Euro Deals (peaked in 2006-2007): Evidence the market
 used prior to the financial crisis).                               has started to come back over the last two years.
   • Mezzanine Deals (2004-2007): CMBS deals backed                   • British Pound Sterling Deals: See Euro Deals.
 by mezzanine loans. Similar to CDOs, but no revolving
 lending period. Both now renamed CLOs deals.                                                                        Source: Trepp LLC

www.crenews.com                                                 -8-                                          Mid-Year 2019
Continued from previous page                                        666 Fifth and StuyTown loans also defaulted. Large mall
                                                                    owner General Growth Properties would file for bankruptcy
  At the loan level, standards were loosening at every              as would Innkeepers Hotel REIT. Office developers struggled
turn. These examples look reckless in hindsight, but were           to stay afloat.
representative of commonly accepted practice in 2006 and              Over time, the Trepp CMBS delinquency rate would top 10
2007:                                                               percent. Several loans were resolved with losses north of $100
  • The $1.22 billion of CMBS debt on the trophy office             million.
building at 666 Fifth Ave. in Manhattan was underwritten
with a DSCR of 1.46x, but the in-place DSCR was only                          Phase V - 2011-2019: The Comeback
0.65x. Lenders assumed in-place rents, which were in the
$40/sf range, would eventually double as leases rolled. The           The first sign of the CMBS market returning actually came
loan defaulted in 2011, with a large portion of the original        in late 2009 when JPMorgan Chase Commercial Mortgage
balance written off.                                                Securities Trust, 2009-IWST ( JPMCC 2009-IWST) and
  • The $3 billion loan against the 11,241-unit Stuyvesant          Banc of America Large Loan Inc., 2009-FDG (BALL
Town/Peter Cooper Village apartment property in                     2009-FDG) were issued. The former, a $500 million, single-
Manhattan was underwritten with an in-place DSCR of                 borrower transaction, breathed life into the market. Backed
well less than 1.0x and an assumption that the new owners           by a pool of several dozen retail properties, it had a loan-to-
could move a large chunk of the property's rent-stabilized          value ratio of less than 60 percent. The hopes of CMBS desks
units to market rents. The senior loan against the property         everywhere were riding on its shoulders.
ultimately paid off in full. At one point, the property's value       The revival of the CMBS market was helped by the Term
had declined so much that it implied a 50 percent loan loss.        Asset-Backed Securities Loan Facility, or TALF, program.
  • The Biscayne Landing loan was essentially a construction        The liquidity facility, which was announced in November
loan stuffed into CMBS. The project was given a $475                2008 and kicked off a few months later, opened up trading in
million valuation even though construction was only                 CMBS, which had been all but shut down. The program was
beginning. It was resolved at a total loss.                         closed for new loans in June 2010 as a result of the markets
  But as with U.S. stocks and residential housing at the time,      becoming sufficiently liquid.
there seemed to be no peak in sight.                                  At the height of the panic, in late 2008, the bellwether
                                                                    AAA-rated A4 bond of GS Mortgage Securities Corp. II,
        Phase IV - 2008-2010: The CMBS Ice Age                      2007-GG10 (GSMS 2007-GG10) was being quoted at a
                                                                    spread of 1,500 bps more than Treasurys, which corresponded
  The lights went out on the CMBS market on June                    to a price of around $50. Many mezzanine and junior AAA
27, 2008. That was the closing date of Banc of America              bonds (AMs and AJs) were being quoted in the $20 or $30
Commercial Mortgage Inc., 2008-1 (BACM 2008-1), the                 range or less. The TALF program began a march that would
last CMBS conduit deal that would get done for 21 months.           eventually lift the value of those bonds back to par or better.
  The signs of a potential market demise came earlier that          While senior AAA classes avoided losses, some AMs and
year as residential mortgage delinquencies spiked. Bear             many AJ ultimately would suffer losses.
Stearns defaulted in March 2008 and fixed-income spreads              To be sure, the comeback was slow, with 2010 seeing
were gapping out across all assets classes.                         about $12 billion in total private label issuance—a fraction
  One of the first signs that problems would not be limited to      of what had been issued in 2007. In addition, many of the
the residential space came in August 2008, when it appeared         loans issued in 2006 and 2007 remained outstanding and
the $225 million loan against the 1,228-unit Riverton               in default—a constant reminder to investors of the risks in
apartment property in Manhattan's Harlem section would              commercial real estate.
default. All of the property's units were subject to New              The new decade brought work back for a great many. For
York City's rent-stabilization rules that limit annual rent         originators and issuers, new lending—while not coming
increases. The sponsors, a venture of Rockpoint Group and           close to the go-go years of 2006 and 2007—continued to
Stellar Management, set up a large reserve to cover debt-           grow. Private-label CMBS issuance grew to $80 billion in
service payments while they worked to bring rent stabilized         2013 from roughly $30 billion in 2011. Special servicers
units to market-level rents. The pro forma DSCR on the              aggressively dealt with the mountain of distressed CMBS
loan was 1.73x, but that assumed successful transition of           loans and foreclosed properties. Distressed asset buyers found
a large number of apartments, which was not easy, as it             plenty of places to play in the debt and equity markets and
would turn out. The in-place DSCR was only 0.39x and the            savvy CMBS investors that bought during the panic watched
reserve would run out in the summer of 2008, triggering the         values steadily increase.
default—less than 18 months after the loan was securitized.           Many CMBS pros that had been in the industry from the
  Until then, many CMBS investors had not realized that             beginning, worked again to help add even more transparency
CMBS loans were being underwritten on a pro forma basis.            to data supplied by borrowers through trustees and servicers.
The news of the default rattled the CMBS market even                Primary issuance spreads were much higher than in 2007,
more. The loan would ultimately suffer a loss of nearly $107        better reflecting the credit risks of commercial real estate.
million.                                                            AAA bonds were structured with more credit enhancement
  The Riverton story was followed by countless other defaults       than in 2007 and loans were underwritten much more
on loans that were underwritten at peak valuations, with little
equity and pro forma financials. The previously mentioned                                                    Continued on next page

Mid-Year 2019                                                     -9-                                    www.crenews.com
Continued from previous page                                             and the industry dodged another bullet.
                                                                            As has been its tradition, the industry continued to
 conservatively.                                                          innovate throughout the post-crisis comeback. New types
   The strong growth—albeit from a modest base—that                       of loans were created and securitized. Non-performing
 took place from 2011 to 2013 gave way to more modest                     loan deals started to emerge as did issues backed by single-
 growth in the middle of the decade. Issuers, originators and             family rentals. The latter came as a response to the need
 investors remained busy as $90 billion of bonds came to                  to recapitalize underwater single-family homes from the
 market in 2014 and about $95 billion in 2015.                            financial crisis.
   That time frame gave way to a new set of concerns for                    Also appearing were commercial real estate collateralized
 investors, however.                                                      loan obligations as another financing vehicle.
   The Greek Debt Crisis forced spreads across the globe                    The post-crisis period also saw enormous growth among
 wider, leaving CMBS investors wondering if a new financial               the government-sponsored enterprises, or GSEs, in direct
 crisis was emerging. Investors also were left to wonder what             multifamily lending. The surge, which began immediately
 would happen to all the loans that were originated in 2006               after the financial crisis, was a response to the shutdown of
 and 2007 when they                                                                                                the private-label CMBS
 reached their maturity                10 Largest Conduits                        Highest Loss Totals              market in 2008-2010.
 dates in 2016 and 2017.                     of All-Time                                (as of April)              Prior to the crisis, the
 The term "Wall of                                                                                                 GSEs had participated
 Maturities" emerged as                     Deal              Bal.                     Deal              Bal.      in multifamily lending by
 bondholders pondered                                      ($Bln)                                     ($Mln)       purchasing "multifamily
 just how big the losses             WBCMT 2007-C30              7.92           GSMS 2007-GG10         1,236.00    directed" CMBS bonds,
 would be on "legacy"                 GSMS 2007-GG10             7.56              CD 2007-CD4            835.00   their A-1A classes.
 deals once those loans                 CD 2007-CD4              6.64                                              Meanwhile, the agencies,
                                                                                  MLMT 2007-C1            693.00
 had to be refinanced.                                                                                             Fannie Mae and Freddie
                                      GCCFC 2007-GG9             6.61           JPMCC 2007-LD11           647.00
 Many ultimately had                                                                                               Mac, developed their own
 their terms extended,               WBCMT 2007-C31              5.85             MSC 2007-IQ14          636 .00   securitization platforms.
 while others suffered               JPMCC 2007-LD11             5.41           JPMCC 2006-LDP9           590.00   As a result, CMBS
 sizable losses.                     JPMCC 2007-LDPX             5.33           WBCMT 2007-C30            581.00   would never recover its
   The first signs that                                                                                            lost multifamily lending
                                       MSC 2007-IQ14             4.90            CGCMT 2007-C6            564.00
 e-commerce could weigh                                                                                            market share. Multifamily
 on brick-and-mortar                 JPMCC 2006-LDP9             4.85            GCCFC 2007-GG9           550.00   lending remains a smaller
 retailers began to emerge            CGCMT  2007-C6             4.76           JPMCC 2007-LDPX           550.00   part of recent vintage
 in 2016. The collapse                                                                                             CMBS than it was from
                                                      Source: Trepp LLC                          Source: Trepp LLC
 of oil prices raised                                                                                              2005 to 2007.
 the specter of defaults on
 Houston office loans, as well as multifamily and hotel loans                            Phase VI – 2020 and Beyond
 from North Dakota to West Texas. Retailer bankruptcies
 of all sizes started to crop up—from Sports Authority to                   Over the last 25 years, the CMBS market emerged
 Toys 'R' Us to Sears and several dozen others. Cracks in                 from scratch to provide an additional funding source for
 the student-housing market began to appear. Grocery                      commercial real estate property owners, it has lowered the
 store chains, normally considered beyond the reach of                    cost of borrowing and has made commercial real estate far
 e-commerce, began to see defaults and store closings.                    more liquid than it ever was. The market has seen a number
   Late 2016 introduced one of the last challenges to the                 of innovations, many the product of sweat equity rather than
 "comeback" era. The Dodd-Frank era legislation mandated                  lightning-bolt inspiration. Of course, there have been several
 that CMBS issuers had to keep "skin in the game" by                      near misses. Some might say the market has been lucky
 retaining at least a 5 percent stake in any new CMBS deal.               to survive 25 years. But as Branch Rickey, the legendary
 The stake could be held by B-piece buyers, but they'd be                 Brooklyn Dodgers general manager, once said, "luck is the
 restricted from leveraging, hedging or selling their positions,          residue of design."
 essentially for the life of a deal. That introduced a new                  We think that applies well to the CMBS market, which
 wrinkle to issuers.                                                      has been at the forefront in reporting timeliness, consistency
   For a stretch, it appeared that the mandate might bring                and transparency. The early efforts to establish these
 the CMBS market to another halt and many feared that                     standards served the market well during the various dark
 the CMBS market would witness another hibernation. The                   times. Investors trusted the industry to come up with new
 theory had merit. It was anticipated that B-piece buyers                 reporting standards in response to crises, because it had
 would need significantly greater yield compensation to meet              always done so in the past. This type of forward-looking
 the mandate, making CMBS less competitive compared to                    mindset has served the industry well for 25 years and we
 other lending sources like banks and insurance companies.                believe the foundation has been put in place for the market
 What wasn't expected was that bond investors, particularly               to continue to grow and thrive.
 those high in the capital stack, would pay up for bonds                    See you all at the Golden Anniversary!
 from deals subject to the risk-retention rules. Those tighter
 spreads kept CMBS competitive with other lending sources

www.crenews.com                                                      -10-                                              Mid-Year 2019
Continued from page 5 rating agencies and bond investors weren't that familiar with
what today is known as CMBS.
The first commercial mortgage-backed bond transaction
The Modern REIT Industry is Born took place in 1984, when Penn Mutual Life Insurance
Co. issued a $205 million transaction, then considered a
In 1992, the first wave of property companies was being collateralized mortgage obligation, or CMO. A number of
taken public as REITs. Among them were Kranzco Realty deals, also classified as CMOs, took place in subsequent
Trust, a Conshohocken, Pa., owner of retail centers led by years. But those generally involved loans carried on a single
the Kranzdorf family, and TriNet Corporate Realty Trust, a institution's balance sheet or RTC-issued deals. The bond
San Francisco owner of triple net-leased office and industrial vehicles weren't generally used to fund newly originated
properties led by Jay Shidler. mortgages against properties owned by third parties.
Kranzco faced the maturity of a substantial chunk of Penner and his team funded 10-year, call-protected loans,
mortgage debt and was working with Smith Barney and typically amounting to 65 percent of properties' depressed
PaineWebber on its initial public offering of common shares. values, and warehoused them until he was confident he could
The company was orchestrating the transaction largely package them as bonds and sell them. But that wasn't an easy
because it needed to refinance about $100 million of its task. Bond investors weren't familiar with what Penner was
property debt. The thinking initially was to structure a $100 selling.
million, non-callable loan as bonds and sell them. But selling
the bonds was the stumbling block. That is, until Magellan The First Modern-Day Conduit: NASC, 1994-MD1
stepped in at PaineWebber's behest, worked with the rating
agencies to structure and rate a single-issuer CMBS deal, and "Everyone thought I was crazy and that Nomura was crazy
bought the bonds with Cargill. The two ultimately resold the because all real estate was perceived as being bad at that
bonds at a handsome profit to a London investor. time," Penner said. "So we had no competition."
The same thing happened with TriNet, whose proposed To get prospective bond investors comfortable with the
IPO was being led by Merrill Lynch. It was to raise equity credits behind what became NASC, 1994-MD1, or Megadeal
and about $50 million of debt to refinance maturing loans. 1, Penner would bring loan originators to road shows in cities
The plan initially was to raise debt through the high-yield like New York, San Francisco, Los Angeles, Chicago and
debt market. After all, tenants at the mortgage's collateral Boston, where bond investors would be presented with the
properties carried below investment-grade ratings. underwriting behind every loan in the transaction.
Magellan stepped in, however, and convinced TriNet to And Criimi Mae, who bought the transactions B-piece,
structure the debt offering as mortgage-backed bonds— and other potential buyers of the bonds, were shuttled to
remember, the term CMBS didn't exist yet. As it did with most of the larger properties in the deal on a plane chartered
Kranzco, Magellan lined up a AA rating from S&P and by Nomura. Penner and his team also invested in the deal's
Fitch Ratings and bought the debt and subsequently resold it. B-piece, providing further assurance to Criimi that they were
Merrill initially had planned to act as agent, structuring the comfortable with the collateral pool's credit risks.
bonds on TriNet's behalf and selling them without taking a Penner and Nomura had the market all to themselves for
principal position. a while. But that changed when other investment shops
started understanding how profitable deals could be. In 1994,
Warehousing Loans for Mega-Deal 1 arguably the first year of the modern CMBS era, $20.1 billion
of issuance was completed. Six years later, issuance hit $48
Having cut his teeth on those transactions—each was a billion. It peaked in 2007 at $230.5 billion and since 2013 has
single-class deal backed by debt against properties owned by averaged $82.6 billion annually.
one investor—Penner, who in 1993 partnered with Nomura Demand for bonds improved the following year when
Securities, started originating loans against commercial the National Association of Insurance Commissions
properties with a multi-borrower bond transaction as a approved bond-rating treatment for CMBS. That facilitated
planned exit. Originating loans might have been viewed investments in the asset class by life insurance companies
as the easy part since demand was healthy and few lenders because it substantially reduced the reserve requirement for
were writing loans. "There literally was no other option for CMBS, relative to mortgages. Until then, life insurers had
borrowers," Penner said, adding that loans his team was to set aside reserves for CMBS as if they were mortgages.
writing generally had coupons that were pegged to Treasurys Spreads, meanwhile, for CMBS at the time were as much
plus, perhaps, 400 basis points. Loans against hotels generally as 200 basis points wider than comparably rated corporate
priced at a spread of 500 to 600 bps more than Treasurys. bonds.
"CMBS was born in haste to solve a catastrophe," Penner The CMBS market was born "not because guys like me
said. had good ideas," Penner explained. Rather, it was a market
The best property operators, even those with little leverage "response to the complete and utter systemic desperation in
on their books, were having difficulties finding loans. "There the commercial real estate sector." The market, he explained,
were no lenders," Penner said. "At that time, no one wanted was "in a black hole. Money was lost daily, property valuations
to make a loan at any (loan-to-value ratio) on any real estate. were on the decline, (capitalization) rates were going up.
Even the most successful and well-positioned commercial real Lenders were running for the hills and regulators were
estate owners were facing catastrophic situations." So finding pushing them to run faster."
lending opportunities wasn't the challenge.
Instead, finding buyers for bonds was. After all, the credit - Orest Mandzy
Mid-Year 2019 -11- www.crenews.comCMBS Conduit Loss Severities: Credit Matters
Transactions with greater underwritten loan-to-value ratios
generally underperform those with less leverage.
By Catherine Liu Stamford, Conn. The Two California loan suffered a $203.5
million loss, while 400 Atlantic incurred $165.8 million.
GS Mortgage Securities Corp., 2007-GG10, the second- The CMBS transaction isn't done yet. It still has a balance
largest CMBS conduit ever issued, with an original balance of $255.2 million and carries $13.6 million of appraisal
of $7.6 billion, has reported $1.24 billion in write-offs for an reduction amounts, or ARAs—a metric that is used to
aggregate loss of 16.34 percent. forecast potential losses. Its only remaining class is A-J, which
That's far more in losses than any other conduit. originally was rated AAA by Standard & Poor's and Fitch
A significant portion of its losses came from high-profile Ratings and Aaa by Moody's Investors Service. Fitch and
loans, including the $470 million mortgage against Two Moody's now rate it D and C, respectively.
California Plaza, a 1.3 million-square-foot office property The deal has seven remaining loans, including a $111.3
in downtown Los Angeles, and the $265 million mortgage
against 400 Atlantic St., a 527,424-sf office property in Continued on next page
50 Worst-Performing CMBS Deals
Trepp ID Initial Bal. Current Bal. WA WAC WA WA DSCR Cumulative Cumulative
($Mln) ($Mln) LTV DY (NCF) Loss ($Mln) Loss %
GSMS 2007-GG10 7,562.77 255.19 73.61 5.83 7.96 1.30 1,235.70 16.34
CD 2007-CD4 6,640.32 14.32 66.66 5.72 9.48 1.54 835.32 12.58
MLMT 2007-C1 4,050.22 117.12 73.94 5.85 8.55 1.32 692.92 17.11
GCCFC 2007-GG9 6,611.99 179.76 66.48 5.79 9.23 1.54 674.96 10.26
JPMCC 2007-LD11 5,414.15 263.75 72.38 5.84 8.43 1.34 647.25 11.95
MSC 2007-IQ14 4,904.87 229.62 72.11 5.76 7.89 1.35 635.81 12.96
JPMCC 2006-LDP9 4,854.25 527.91 68.34 5.81 8.96 1.49 589.88 12.15
WBCMT 2007-C30 7,918.25 94.91 70.35 5.86 8.64 1.40 581.12 7.35
CGCMT 2007-C6 4,756.05 134.84 71.98 5.73 8.90 1.41 564.38 11.87
JPMCC 2007-LDPX 5,331.52 470.22 73.25 5.76 8.50 1.40 549.58 10.31
MLCFC 2007-5 4,417.02 115.52 67.46 5.96 9.74 1.44 521.34 11.80
CMLT 2008-LS1 2,345.02 201.42 73.09 6.08 8.89 1.29 502.36 21.42
WBCMT 2007-C32 3,823.85 36.75 71.42 5.77 8.70 1.45 468.07 10.50
CD 2006-CD2 3,109.35 61.85 68.81 5.51 9.40 1.51 462.93 14.89
CD 2006-CD3 3,571.36 467.31 70.07 6.15 9.74 1.40 462.67 12.96
BSCMS 2007-PW15 2,807.10 86.52 68.60 5.78 9.00 1.40 461.87 16.45
LBUBS 2007-C2 3,554.40 62.81 66.72 6.00 9.45 1.43 460.73 12.96
CSMC 2006-C4 4,273.09 24.36 66.95 6.14 9.95 1.43 459.99 10.76
CSMC 2007-C1 3,378.50 202.93 71.34 5.88 8.78 1.35 454.51 13.48
BACM 2007-2 3,172.67 - 70.73 5.74 8.28 1.34 438.23 13.81
GCCFC 2005-GG5 4,295.15 - 72.66 5.39 9.18 1.46 431.94 10.06
CSMC 2007-C5 2,720.81 189.81 70.60 6.17 9.42 1.35 428.98 15.77
GECMC 2007-C1 3,953.47 515.15 73.66 5.82 8.89 1.34 426.40 10.79
JPMCC 2007-CB18 3,904.14 349.31 72.97 5.76 9.09 1.40 424.20 10.87
WBCMT 2007-C33 3,602.12 133.66 71.24 5.93 9.37 1.41 423.95 11.77
LBUBS 2006-C6 3,123.30 112.66 62.84 6.10 9.93 1.45 420.02 13.45
MLCFC 2006-4 4,522.71 51.35 69.98 5.88 8.76 1.34 407.73 9.02
CWCI 2006-C1 2,556.16 54.33 70.33 6.01 9.39 1.41 405.42 14.32
GSMS 2006-GG8 4,242.88 296.12 71.62 6.24 9.06 1.32 403.70 9.51
MLCFC 2007-7 2,787.90 155.26 72.10 5.78 8.79 1.34 403.52 14.51
Remaining 20 Deals 97,017.18 3,556.02 70.73 5.93 9.22 1.39 11,359.30 12.51
Source: Trepp LLC
www.crenews.com -12- Mid-Year 2019Continued from previous page CMBS Payoffs by Vintage - Conduits Only
million piece of the $278.2 million mortgage against the
Vintage Issuance Disposed Realized Total
former Franklin Mills mall in Philadelphia that is now ($Mln) Balance Loss Loss
known as Philadelphia Mills. The remaining $166.9 million ($Mln) ($Mln) %
of debt against that property is held by JPMorgan Chase 1995 645.09 537.15 30.16 5.62
Commercial Mortgage Securities Corp., 2007-LDP11. The 1996 5,476.31 4,605.57 203.72 4.42
loan was transferred to special servicing in April as it wasn't
expected to be paid off by its extended maturity this month. 1997 20,307.64 16,750.54 582.16 3.48
The JPMCC 2007-LP11 transaction has the fifth most losses 1998 46,594.70 37,429.50 1,363.81 3.64
of any conduit. 1999 36,230.61 30,112.48 1,331.10 4.42
2000 27,707.48 24,266.26 1,384.73 5.71
Weighted Average LTV vs. Total Loss 2001 35,605.31 30,958.13 1,879.12 6.07
2002 35,182.50 30,027.98 1,483.17 4.94
2003 53,882.76 45,582.60 1,481.12 3.25
2004 72,687.09 62,876.74 2,793.64 4.44
2005 134,462.31 119,383.07 8,345.82 6.99
2006 156,147.35 141,882.79 14,832.19 10.45
2007 183,807.77 170,219.68 18,394.47 10.81
2008 10,050.49 9,255.00 1,501.10 16.22
2009 - - - 0.00
2010 2,173.30 1,985.98 1.71 0.09
2011 10,053.98 9,363.57 68.72 0.73
Source: Trepp LLC 2012 5,421.46 5,003.17 40.64 0.81
2013 8,231.41 7,673.31 106.41 1.39
The $6.6 billion CD, 2007-CD4, transaction has the
2014 5,032.31 4,785.38 65.47 1.37
second most losses of all conduits. So far, it has seen $835.3
million of write-offs, with three losses—the $136 million 2015 630.83 641.57 12.50 1.95
loan against the Citadel Mall in Colorado Springs, Colo., 2016 149.11 144.41 7.20 4.99
the $117 million loan against the Loews Lake Las Vegas 2017 44.98 43.65 - 0.00
in Henderson, Nev., and $225 million Riverton apartment
2018 - - - 0.00
property in New York—contributing $360.3 million.
In terms of loss as a percentage of original balance, the Total 850,524.76 753,528.53 55,908.98 7.42
$2.35 billion Banc of America Commercial Mortgage Inc., Source: Trepp LLC
2008-LS1, deal so far has been hit with losses totaling 21.42
percent of its balance. Its biggest hit: the $109.5 million loss overall bond loss could reach a staggering 25 percent of
suffered when the COPT Office Portfolio, which consisted of original balance when all its remaining assets are resolved.
the 694,016-sf Washington Technology Park I and II office While its total losses likely won't reach those levels,
buildings at 15000 and 15010 Conference Center Drive in JPMorgan Chase Commercial Mortgage Securities Corp.,
Chantilly, Va., was liquidated. 2007-LDPX, could reach 15 percent or more of losses, as it
The transaction, meanwhile, has an ARA totaling 36.01 has an ARA of $335.8 million. It's already suffered $549.6
percent of its $201.4 million balance, indicating that its million of losses, or 10.3 percent of its original $5.33 billion
balance. The ARA reflects projected losses from its share
Weighted Average DSCR vs. Total Loss of a $678 million modified loan against a portfolio of eight
office buildings that's commonly referred to as the Skyline
portfolio in the Washington, D.C., suburb of Falls Church,
Va. The collateral buildings, totaling 2.6 million sf, are now
real estate-owned.
The transaction also includes nine office buildings in
Alexandria, Va., commonly referred to as the Lafayette
Property Trust portfolio, that had backed a $203.3 million
loan.
Since ARA assignments on loans have not been necessarily
updated to reflect current values, it is possible that loss
estimates for these already weak-performing deals are
understated.
Source: Trepp LLC Continued on next page
Mid-Year 2019 -13- www.crenews.comContinued from previous page
Top 15 Loan Exposure vs. Total Loss
The 50 CMBS conduit deals with the largest losses so far
have suffered $22.6 billion of losses. That accounts for 41
percent of all conduit write-downs.
Transactions with stronger credit profiles at issuance,
exemplified by lower weighted average loan-to-value ratios
and higher debt-service coverage ratios and debt yields,
typically suffer fewer severe loss totals than deals with
weaker credit profiles.
For instance, deals that fall within the 45 percent to 60
percent LTV bracket have an average loss of 1.79 percent,
while those in the 70 percent to 72 percent LTV bracket
post an average loss of 7.14 percent, demonstrating that
losses incrementally increase as underwritten leverage goes
up (See chart on page 13). Source: Trepp LLC
weight. While this means that those with either very low or
Weighted Average Debt Yield vs. Total Loss high exposures spread broadly from the mean can be skewed
towards heavier severities, deals with significant exposure to
larger assets have reduced losses in general.
The CMBS conduit deals with the lowest dollar losses
to date—excluding those from the CMBS 2.0 universe—
each had higher than average debt yields and DSCRs and
lower leverage levels. They also had greater property type
heterogeneity, exposure to larger loans and the country's top
25 MSAs.
For instance, Morgan Stanley Capital I Inc., 2004-IQ7,
which had an original balance of $863 million, has suffered
only $2.2 million of losses, or 0.26 percent of its original
balance. It had a weighted average LTV of 55.9 percent,
DSCR of 2.82x and debt yield of 19.04 percent—unusual
Source: Trepp LLC
numbers in the legacy CMBS era.
Similarly, deals with higher DSCR and debt yield levels Top 25 MSA Exposure vs. Total Loss
also tend to have reduced bond losses on average. Conduits
securitized with a weighted-average DSCR in the 1.4x to
1.6x range record an average loss of 5.86 percent, with losses
in the 2.0x to 2.2x bracket averaging 2.31 percent (See chart
on page 13).
And deals with debt yields of 10 percent to 12 percent
had losses that averaged 4.03 percent. Average loss doubles
to 8.07 percent for deals with debt yields of 8 percent to
10 percent, and jumps to 10.26 percent for deals in the 6
percent to 8 percent debt yield bracket.
The pattern is in line with what we would expect, in
that riskier conduit pools with weaker underlying credit
characteristics ultimately translate to greater losses to
bondholders. Source: Trepp LLC
Data also indicates that deals whose collateral pools
have a significant concentration of collateral in the top 25 Contrast those credit metrics with those of GSMS 2007-
metropolitan statistical areas, or MSAs, have an improved GG10, whose LTV was 73.6 percent, DSCR was 1.3x and
credit makeup, boosted by solid property valuations and debt yield was less than 8 percent. Indeed, the weighted
market demand. Average losses come in at 7.94 percent on average LTV of the 50 conduits with the greatest losses was
pools that have a 30 percent to 40 percent concentration 70.5 percent. The 50 with the smallest losses had a weighted
of assets in the 25 largest MSAs. Deals with an equal to or average LTV of 65 percent.
greater than 80 percent concentration in those markets see
an average loss of 3.38 percent.
Meanwhile, average losses suffered by deals with a large
exposure to their 15 largest loans follow a bell-curve.
Such deals' performance is largely dependent on a small
number of assets, since each carries a proportionally large
www.crenews.com -14- Mid-Year 2019Trepp universiTy
U n d e r g r a d U at e s t U d e n t s
M B a c a n d i dat e s
P h . d . c a n d i dat e s
fa c U lt y
What you need for
Where you’re going
in cre FinAnce
www.trepp.com/solutions/trepp-university
Trepp AcAdemic ediTion
Trepp is partnering with universities and colleges that offer commercial real estate
programs to foster mastery of Trepp CMBS data and analytics. Trepp Academic
Edition aims to complement and strengthen course syllabi and to make students
more competitive in the marketplace.
>> Undergraduate Programs
>> For MBA Graduate Programs
>> Trepp Certified
Trepp reseArch ediTion
Trepp Research Edition aims to strengthen students’ thesis, white papers and
research projects by providing access to CMBS data.
>> For Ph.D. Candidates
>> For Faculty
For more information visit our website or contact Erin Timko at 212-754-1010.
Mid-Year 2019 -15- www.crenews.comA Soft Landing for the Next Maturity Wave
By Steve Jellinek
M
ore than $170 billion in
loans packaged in CMBS
will mature during 2020-
2023, and Morningstar Credit
Ratings, LLC believes the on-time
payoff rate will remain healthier
than that during the $222.48 billion
maturity wave of 2015-2017. That's
due to more selective underwriting Source: Morningstar Credit Ratings
standards, rising valuations and the Debt Yield, Loan Proceeds
and LTV Hit Similar Targets
Fed's dovish interest-rate outlook
amid a slowing economy. Our projected payoff rate based on debt yield (using the
most recent 12-month net cash flow) is in the low- to
With maturing CMBS 2.0 loans exceeding pre-crisis loans mid-80 percent range over the four-year period. Based on
for the first time, the first year following the post-crisis a conservative debt-yield hurdle of 9 percent, our expected
maturity wave went well, as the 2018 payoff rate for $10.13 on-time payoff rate ranges from a low of 80.7 percent in
billion of maturing CMBS loans bounced back to 84.3 2023 to a high of 85.0 percent in 2022. However, lowering
percent, following two years of weak performance, when the our minimum required debt yield to 8 percent increases the
payoff rate sank to a low of 72.3 percent the previous year. successful on-time payoff rate to a range of 88.3 percent in
2020 to 90.9 percent in 2022.
Refinance proceeds tell a similar story. Morningstar
estimates that 83.3 percent (2023 maturities) to 86.2 percent
(2022 maturities) of the maturing loans during the 2020-
2023 period will generate enough cash flow to successfully
refinance the existing debt. This assumes a 5 percent interest
rate and a 1.35x debt-service coverage ratio. Although this
year's CMBS new issue average DSCR is 1.95x, we used a
less restrictive DSCR hurdle because maturing loans have
benefited from a growing appetite among other traditional
lending sources such as commercial banks, life insurance
companies and pension funds, as well as nontraditional debt
funds and mezzanine lenders with less stringent underwriting
Source: Morningstar Credit Ratings requirements, many of which took out overleveraged loans
that came due during 2016-2017.
Furthermore, while CMBS issuance has been tepid,
The loans maturing between 2020 and 2023 are almost dropping to $83 billion last year from a post-crisis high of
exclusively post-crisis and generate less concern than pre- $95 billion in 2015, commercial real estate loan growth from
crisis loans because of lower leverage, and the underlying all sources persists, as the Mortgage Bankers Association
assets have generally benefited from rising property reported a record $573.9 billion of commercial loan
valuations throughout the loan term, bolstering the originations last year, up 8 percent from 2017.
borrower's equity and easing refinancing concerns. Using debt The maturity payoff rate fares better based on Morningstar's
yields, loan proceeds and loan-to-value ratios as benchmarks, calculated LTV, which incorporates factors beyond individual
Morningstar projects the maturity payoff rate will remain property performance, such as capitalization rates and
steady at roughly 80-85 percent through 2023. specific real estate market trends. Morningstar has valued
In our analysis, we excluded certain floating-rate loans $13.18 billion, or 66.7 percent, of the $19.76 billion of loans
because they have not reached their fully extended maturity maturing in 2020. We believe the 2020 payoff rate will be
date, even though that may not be reflected in the servicer about 92 percent because 8 percent of the loans maturing that
data, as reported floating-rate loan maturity dates can be year, with a total unpaid principal balance of $1.59 billion,
subject to extension options.
Continued on page 20
www.crenews.com -16- Mid-Year 2019You can also read