CO2 ROAD-MAP SUSTAINABLE AVIATION - www.sustainableaviation.co.uk
←
→
Page content transcription
If your browser does not render page correctly, please read the page content below
SUSTAINABLE AVIATION
CO2 ROAD-MAP
www.sustainableaviation.co.uk
Sustainable Aviation CO2 Road-Map 2016                      © Sustainable Aviation, Dec 2016

    Launched in 2005, Sustainable Aviation brings together the main players
     from UK airlines, airports, aerospace manufacturers and air navigation
   service providers to set out a collective and long term strategy to ensure a
                        sustainable future for UK aviation.

                 CLEANER                 QUIETER                  SMARTER

                     Find out more at www.sustainableaviation.co.uk

www.sustainableaviation.co.uk                                                   Page 1 of 83
Sustainable Aviation CO2 Road-Map 2016                                     © Sustainable Aviation, Dec 2016

   FOREWORD BY SUSTAINABLE AVIATION’S ADVISORY BOARD

The climate policy landscape has seen dramatic changes in 2016. The Paris Agreement was ratified
and entered into force on 4th November, and the International Civil Aviation Organization (ICAO)
agreed an international deal to tackle growth in carbon emissions beyond 2020 using market-based
measures. Closer to home, we have the public voting to leave the European Union and the
Government supporting the Airports Commission’s recommendation for an additional runway at
Heathrow. Since 1990 we have also seen UK aviation emissions rise both in absolute terms and as a
percentage of UK emissions as other sectors decarbonise. Aviation now accounts for over 7% of UK
CO2 emissions. Given these seismic shifts, the 2016 CO2 Road-Map produced by Sustainable Aviation
(SA) could not be timelier.

The CO2 Road-Map is the flagship report of SA. This report updates its 2012 Road-Map which set out
a suggested pathway for UK aviation out to 2050. Despite an expected 150% rise in air traffic
between 2010 and 2050, the 2012 Road-Map showed a scenario for how a combination of changes to
operations, to the fleet and the introduction of alternative fuels could lead to limited emission
increase. The Road-Map also suggested market-based measures could be used to halve net emissions
by 2050.

In this new Road-Map the proposed future pathway and the contribution from the different wedges
are largely unchanged. However, the Road-Map does an excellent job of examining each of these
wedges and their impact on UK aviation emissions. This new evaluation accounts for increased
runway capacity. It also considers increased knowledge on sustainable fuels and future fleets.

The SA Advisory Board welcomes this new Road-Map and we acknowledge the efforts that all parts of
the industry have made to decarbonise both immediately and going forward. We think the Road-Map
sets a good level of ambition that is broadly in line with the UK Committee on Climate Change
recommendations. It also goes about half way towards the long-term climate goals of balancing
sources and sinks of carbon in the second half of this century articulated in the Paris agreement, when
market based measures are accounted for.

Going forward we would encourage SA to identify the key practical interventions that would support
the UK aviation industry both to implement this level of ambition and to grow the level of ambition
across the industry. Lastly, as stated in the report, CO2 should not be considered in isolation, as other
aviation emissions which also have a warming effect need to be accounted for. We look forward to a
continued close working relationship with this important UK industry.

The SA Advisory Board

The Sustainable Aviation Advisory Board works with Sustainable Aviation to provide independent
advice and feedback. It provides rigorous challenge to the SA Council in order to enable it to reach its
cleaner, quieter, smarter goals effectively and efficiently.

www.sustainableaviation.co.uk                                                                  Page 2 of 83
Sustainable Aviation CO2 Road-Map 2016 © Sustainable Aviation, Dec 2016
EXECUTIVE SUMMARY
This CO2 Road-Map, like its predecessor published in 2012, demonstrates the potential for the UK to
accommodate significant aviation growth to 2050 without a substantial increase in CO 2 emissions,
through a better than doubling of carbon efficiency.
UK aviation can accommodate significant growth to 2050 without a substantial
increase in CO2 emissions. We also illustrate the potential reduction of net CO2
emissions through internationally agreed market-based measures.
Key findings
Through the adoption of newer, more efficient aircraft, sustainable fuels and better air traffic
management and operational procedures, the aviation industry in the UK will be able to
accommodate significant growth through to 2050, including the effect of additional runway
capacity in the South East of England, without a substantial increase in CO2 emissions.
By 2050, UK aviation’s CO2 emissions are expected to be broadly in line with levels recommended
by the Committee on Climate Change. Further improvements in the industry’s carbon intensity can
be expected post-2050.
The historic agreement for a global market based measure (MBM) at this year’s ICAO Assembly
will support the global aviation industry’s drive for carbon neutral growth from 2020. It is also a
major step towards the global industry’s longer term goal of halving its net CO 2 emissions by 2050
versus 2005 levels. The industry’s focus is now, with Government support, to ensure the
successful implementation of this global measure from 2020. Our Road-Map shows the level of
contribution required from MBMs, additional to the within-sector improvements listed above, if UK
aviation is also to halve its net CO2 emissions relative to 2005 levels whilst accommodating a
more than doubling of demand over the same period.
www.sustainableaviation.co.uk Page 3 of 83
Sustainable Aviation CO2 Road-Map 2016 © Sustainable Aviation, Dec 2016
Improvements to our Road-Map since 2012
Our demand-growth assumptions now take account of additional runway capacity in the South-
East of England, using forecasts from the Airports Commission.
Recent international agreements concerning new-aircraft fuel-efficiency and market based
measures for aviation have been taken into account.
Our assessment of the potential for fleet fuel-efficiency improvements has been refined, taking
more accurate account of the existing fleet and including recently-announced new aircraft types.
Significant advances in sustainable aviation fuels have been taken into account.
We have refined our analysis of near-term air traffic management efficiency improvements related
to the target set by NATS, the UK’s air navigation service provider.
Where Government can help
Recognising aviation’s benefits to the economy, to employment and to connectivity, the UK
Government has provided resource and assistance to enable a vibrant aviation and aerospace
manufacturing industry in the UK. This report demonstrates how that support is yielding significant
dividends.
However, delivery of the full range of improvement initiatives set out in this document will require not
only continued focus from the industry itself but also appropriate levels of ongoing support from
Government - on both Research and Development (R&D) and policy - in the following specific areas:
Airspace Reform: The Government should continue to support airspace modernisation in the UK,
and maintain momentum towards improved air traffic management (ATM) collaboration across
Europe.
Supporting Research and Development (R&D): Just as the fuel-efficiency of new engines and
aircraft today is the result of past investment in R&D, so the improved fuel-efficiency and
commercial competitiveness of future engines and aircraft will hinge on R&D investment made
today and in the future. In the coming years, the Government must ensure that access by UK
aerospace industry to ongoing funding for high-value collaborative R&D remains in place.
Sustainable Fuel Strategy: We welcome the UK Government's recent consultation on the
inclusion of Sustainable Aviation Fuels (SAF) in future policy for renewable transport fuels. We
urge the Government to introduce binding legislation and to provide clear long-term policy as soon
as possible to enable the UK to realise the opportunities for UK sustainable fuels production. The
UK should develop a new vision and strategy for SAF, to ensure the development of UK expertise
and innovation, to enable the UK to benefit from global opportunities in these emerging
technologies and to deliver on the jobs and growth identified in our 2014 Sustainable Fuels Road-
Map.
Market Based Measures (MBMs): We welcome the role played by the UK Government in
negotiations towards ICAO’s Global MBMs agreement, which supports as far as 2035 the global
aviation industry’s carbon neutral growth ambition. Government should now focus on
implementation details including avoiding duplication of coverage with regional schemes.
Government should also start the process towards the global mechanism for 2035 onwards, which
will be essential in supporting the global aviation industry’s commitment to reduce net aviation
CO2 emissions by 50% by 2050, relative to 2005 levels, while increasing capacity in support of
economic growth.
www.sustainableaviation.co.uk Page 4 of 83
Sustainable Aviation CO2 Road-Map 2016 © Sustainable Aviation, Dec 2016
Aviation in the UK
UK aviation, comprising domestic and international flights departing from UK airports,
accounted for some 7.4% of UK CO2 emissions in 2014.
The UK aviation sector has a turnover of over £60 billion, contributes over £52 billion to our
1
GDP and almost £9 billion in taxes, and directly or indirectly supports almost one million UK
jobs.
Our aerospace manufacturing sector generates annual exports of £26 billion and has a global
market opportunity of £3.5 trillion over the next twenty years.
As this document shows, the UK aviation industry is working hard to enhance its economic benefits
while managing its carbon footprint through a better than doubling of carbon efficiency between
2010 and 2050.
Sustainable Aviation members’ progress
Airspace Management – by introducing more efficient aircraft routes and a range of other
measures, NATS has made strong progress towards a target of reducing CO 2 from aircraft
under their control by 10% by 2020 relative to 2006 levels. Improvements made so far are
saving more than a million tonnes of CO2 per year.
Airlines & Airports
o Airline members are investing billions of pounds in significant upgrades to their fleets,
adopting the latest, most fuel-efficient aircraft. Since 2005, UK airlines have brought in
470 new aircraft. Alongside reductions in emissions, these aircraft offer further benefits
such as lower noise levels. Between 2005 and 2015, Sustainable Aviation’s member
airlines have improved their fuel efficiency by almost 12%, equivalent to a saving of 20
million tonnes of CO2.
o Airline and airport members are identifying and adopting a wide range of improved
operational practices such as reducing the use of aircraft APUs, and taxiing on a
reduced number of engines. This complements broader on-airport work to reduce
carbon emissions from energy use in buildings and by vehicles. Between 2010 and
2012, the combined carbon footprint of the UK’s 18 biggest airports – representing
95% of passengers using UK airports – reduced by 3%, whilst passenger numbers
increased by 5%.
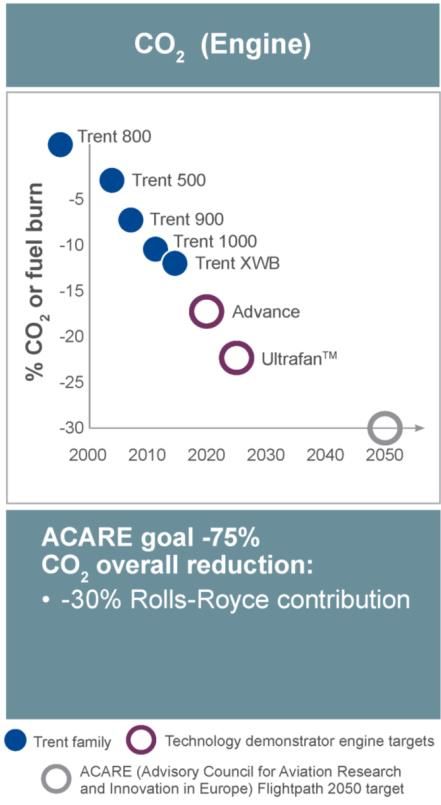
Manufacturers - Aerospace manufacturers, having created the latest generation of efficient
aircraft, are already investing heavily in the cutting edge technology that will ensure the next
generation of aircraft and engines will be able to reduce CO 2 emissions further.
Fuels – Aerospace manufacturers, airlines and fuel companies have worked collaboratively to
approve new fuels that can be manufactured from sustainable sources. Additionally, SA
members are actively involved in developing new supply chains.
Market based measures - Between 2012 and 2015, 6 million tonnes of CO2 emissions
reductions were made by UK airlines through the EU Emissions Trading System (ETS).
1
including direct, indirect and induced economic benefits
www.sustainableaviation.co.uk Page 5 of 83
Sustainable Aviation CO2 Road-Map 2016                                                                         © Sustainable Aviation, Dec 2016

Contents

1        Introduction and Context ........................................................................................................... 8
         1.1        What Is the CO2 Road-Map? ............................................................................................. 8
         1.2        Sustainable Aviation .......................................................................................................... 8
         1.3        UK Aviation’s Social and Economic Value ........................................................................ 8
         1.4        Aviation and the Environment ............................................................................................ 9
         1.5        UK Aviation in the National and International Context ...................................................... 9
         1.6        Motivation for an Updated Road-Map .............................................................................. 10
         1.7        Methodology .................................................................................................................... 11
         1.8        Options for Reducing CO2 ............................................................................................... 11
         1.9        The Role of Government ................................................................................................. 12
         1.10       Document Structure ......................................................................................................... 12
2        Hypothetical “No-Improvements” Scenario ........................................................................... 13
         2.1        Introduction ...................................................................................................................... 13
         2.2        Defining “Growth in Aviation Activity” .............................................................................. 13
         2.3        Data Sources, Key Assumptions, and Calculations ........................................................ 14
         2.4        The Hypothetical “No-Improvements” Scenario .............................................................. 14
3        Improvements in Air Traffic Management and Operations ................................................... 16
         3.1        Introduction ...................................................................................................................... 16
         3.2        Air Traffic Management (ATM) ........................................................................................ 16
         3.3        APU Substitution .............................................................................................................. 19
         3.4        Aircraft Operations ........................................................................................................... 20
         3.5        Potential Mitigation Impact – ATM and Operations ......................................................... 20
4        Improvements in Aircraft and Engine Efficiency ................................................................... 21
         4.1        Introduction and Framework ............................................................................................ 22
         4.2        Issues to Consider ........................................................................................................... 23
         4.3        Baseline Fleet Composition ............................................................................................. 26
         4.4        “Imminent” Aircraft – Efficiency Characteristics and EIS Dates ...................................... 28
         4.5        “Imminent” Aircraft – Impact on Fleet Fuel Efficiency ...................................................... 28
         4.6        “Future” Aircraft – Approach Taken ................................................................................. 30
         4.7        “Future” Aircraft – Assumptions by Category .................................................................. 33
         4.8        “Future Aircraft” - Sense-Check and Context .................................................................. 33
         4.9        “Future” Aircraft – Impact on Fleet Fuel Efficiency .......................................................... 34
         4.10       “Future” Aircraft Efficiency – Enabling Technologies....................................................... 34
5        Sustainable Aviation Fuels ...................................................................................................... 41
         5.1        Introduction ...................................................................................................................... 41
         5.2        Progress Since 2012 ....................................................................................................... 42
         5.3        Sustainability .................................................................................................................... 44
         5.4        Potential for Sustainable Aviation Fuels – Risks and Opportunities ................................ 45
         5.5        Assessment of Potential Mitigation Impact ...................................................................... 46
6        Market-Based Measures ........................................................................................................... 47
         6.1        Context ............................................................................................................................. 47
         6.2        Implementation of MBMs ................................................................................................. 48
         6.3        Representation of MBMs in our CO2 Road-Map ............................................................. 48
         6.4        “Asks” for Government ..................................................................................................... 49
7        The Sustainable Aviation CO2 Road-Map ............................................................................... 50
         7.1        Introduction ...................................................................................................................... 50
         7.2        The 2016 CO2 Road-Map ................................................................................................ 50
         7.3        Discussion........................................................................................................................ 51
         7.4        Conclusions ..................................................................................................................... 54
References ........................................................................................................................................... 55

www.sustainableaviation.co.uk                                                                                                              Page 6 of 83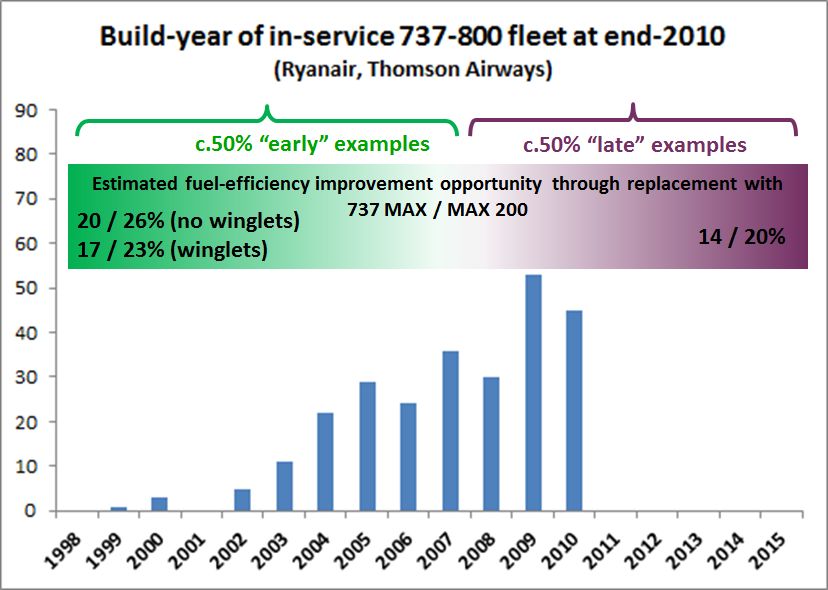
Sustainable Aviation CO2 Road-Map 2016                                               © Sustainable Aviation, Dec 2016

APPENDIX A – Comparing the 2012 and 2016 CO2 Road-Maps ..................................................... 57
APPENDIX B – Hypothetical “No-Improvements” Scenario – Details ........................................... 59
APPENDIX C – NATS 10% Target and UK Aviation CO2 Emissions............................................... 65
APPENDIX D – Characteristics of “Imminent” Aircraft Types ........................................................ 68
APPENDIX E – Fleet Fuel-Efficiency Impact of “Imminent” Aircraft .............................................. 71
APPENDIX F – Deriving “Future” Aircraft Assumptions ................................................................. 78
APPENDIX G – “Future” Aircraft Assumptions: Sense-Check ....................................................... 81

www.sustainableaviation.co.uk                                                                              Page 7 of 83
Sustainable Aviation CO2 Road-Map 2016                                           © Sustainable Aviation, Dec 2016

1        Introduction and Context

1.1      What Is the CO2 Road-Map?

Put simply, this document (like its predecessor [SA, 2012]) sets out Sustainable Aviation’s latest view
of the likely trajectory of UK aviation’s carbon dioxide (CO2) emissions to 2050. It takes into account
expected growth in UK aviation activity in the coming decades and explores the likely impact of a
number of CO2 mitigation measures. It is based on the latest information available to us at the time of
writing.

The Road-Map’s purpose is to inform debate, to highlight the efforts being taken by the aviation
industry to reduce its carbon intensity, to assess the likely effectiveness of those efforts in the specific
context of UK aviation, and to identify areas where Government can help.

This document does not represent a target set by Sustainable Aviation for the industry to deliver, and
should not be viewed as a promise or commitment. It does not warrant that UK aviation emissions will
follow a particular path.

However, neither is this document an aspirational statement. Wherever possible we have based our
position on quantitative analysis of hard data. In some areas we have needed to exercise informed
judgement, and in the text we make clear where this is the case.

As with our previous CO2 Road-Maps, we interpret “UK aviation” to mean “flights which depart from
UK airports”. This is consistent with the accounting convention used by the UK to assess emissions
from UK aviation. Our use of this interpretation is motivated by the need for consistency with published
figures and does not imply support for or agreement with the corresponding accounting practice.

Besides carbon dioxide, emissions from aviation also include oxides of nitrogen (NO x), water vapour,
particulates, carbon monoxide, unburned hydrocarbons, soot and oxides of sulphur (SO x). The climate
impact of many of these is discussed in a separate paper [SA, 2014a]. This Road-Map focuses purely
on CO2.

1.2      Sustainable Aviation

Launched in 2005, Sustainable Aviation (SA) brings together the main players from UK airlines,
airports, aerospace manufacturers and air navigation service providers to set out a collective long term
strategy to ensure a sustainable future for UK aviation.

We are focused on finding collaborative ways of becoming cleaner, quieter and smarter to enable the
more sustainable development of our industry and the economy. We continue to promote the
principles of our strategy, both within the UK and internationally.

SA has set a range of goals and commitments covering climate change, local air quality and noise to
                                             2
deliver a sustainable future for our industry . We regularly report on our progress towards these
objectives, monitoring and tracking the practical cooperative work being undertaken by SA’s
signatories. Our Progress Reports can be found at www.sustainableaviation.co.uk.

1.3      UK Aviation’s Social and Economic Value
             3
[SA, 2016] sets out the importance to the UK of aviation and its various sub-sectors, both from an
economic standpoint and a social standpoint. The UK aviation sector has a turnover of over £60
2
    SA’s goals can be found at http://www.sustainableaviation.co.uk/our-goals/
3
    See references at the end of this document

www.sustainableaviation.co.uk                                                                        Page 8 of 83
Sustainable Aviation CO2 Road-Map 2016 © Sustainable Aviation, Dec 2016
4
billion, contributes over £52 billion to our GDP, and directly or indirectly supports almost one million
UK jobs. Our aerospace manufacturing sector generates annual exports of £26 billion and has a
global market opportunity of £3.5 trillion over the next twenty years.
As this document shows, the aviation industry is working hard to enable these benefits to continue into
the future while substantially reducing CO2 emissions per unit of delivered benefit.
1.4 Aviation and the Environment
The aviation industry takes extremely seriously its responsibility to reduce its environmental impact, as
its track record illustrates. Over the last half-century, fuel-burn per passenger-kilometre has been
reduced by some 70 percent against a backdrop of progressively tightening regulations for noise and
NOx emissions. The industry remains resolute in its drive to reduce its emissions intensity even further,
as demonstrated not only by the commitments of aircraft operators to refreshing their fleets with
newer, more efficient aircraft, but also by significant research and development investment within the
aerospace design and manufacturing sector to ensure that future generations of engines and aircraft
are even more efficient.
However, aviation’s social and economic contribution to society is such that underlying demand for air
travel continues to rise, placing upward pressure on emissions. Several years ago, the global aviation
industry agreed an overall strategy for managing its CO 2 emissions [IATA, 2009].
Our UK-specific Road-Map brings together analysis from the various sectors of the UK industry,
together with a demand-growth projection based on forecasts from the UK’s Airports Commission, to
set out Sustainable Aviation’s view of the likely trajectory of CO2 emissions from UK aviation over the
period to 2050.
1.5 UK Aviation in the National and International Context
5
CO2 emissions from global aviation account for some 2% of all human-attributable CO2 emissions .
6
Furthermore, CO2 emissions from UK aviation currently correspond to around one twentieth of CO2
7
emissions from aviation worldwide . Whilst forecast growth in UK aviation activity to 2050 will average
8
up to 2.4% per annum , global aviation activity growth rates are expected to be considerably higher
9,10
due to the rapid development of emerging markets in Asia and elsewhere . As a result, the
proportion of global aviation’s CO2 emissions attributable to the UK is likely to diminish substantially
over time. The most compelling opportunity for the UK to exert an influence over CO2 emissions from
aviation is therefore not by heavily constraining demand for UK aviation, but rather through 1)
11
investment in advanced technologies which can be deployed globally, earning export revenues for
the UK while contributing to a more environmentally efficient industry world-wide, and 2) continuing to
engage at the international level to ensure that decarbonisation happens in the most cost effective
way possible, through the use of market-based measures.
4
including direct, indirect and induced economic benefits
5
Source: http://www.atag.org/facts-and-figures.html, viewed 3rd Oct 2016
6
Our interpretation of this phrase is set out in section 1.1
7
Source: SA analysis of data from [CAA], [NAEI], and http://www.atag.org/facts-and-figures.html, viewed 3rd Oct 2016
8
Demand growth is discussed in detail in section 2
9
See page 7 of http://www.airbus.com/company/market/global-market-forecast-2016-
2035/?eID=maglisting_push&tx_maglisting_pi1%5BdocID%5D=109228
10
See page 5 of http://www.boeing.com/resources/boeingdotcom/commercial/about-our-
market/assets/downloads/cmo_print_2016_final_v6.pdf
11
This would include not only engine and aircraft technologies, but also technologies related to sustainable aviation fuels and
to air-traffic management.
www.sustainableaviation.co.uk Page 9 of 83Sustainable Aviation CO2 Road-Map 2016 © Sustainable Aviation, Dec 2016
Since CO2 is a well-mixed greenhouse gas, the distribution of CO 2 emissions between sectors of
activity or geographical locations does not influence the climate system’s response to those
emissions. Accordingly, the pursuit of the most cost-effective mitigation opportunities, irrespective of
sector or geography, should be incentivised. We welcome the agreement of a global market-based
measures scheme to address CO2 emissions from international aviation, which will enable reductions
in UK aviation’s net CO2 emissions over and above the substantial reductions made within the aviation
industry itself.
Looking closer to home, CO2 emissions from UK aviation accounted in 2014 for some 7.4% of the
12 13
UK’s total CO2 emissions . This figure has risen - from slightly under 3% in 1990 - as aviation
activity has continued to grow strongly while over the same period the UK as a whole (comprising all
sectors of activity including international aviation and international shipping) has reduced its total CO2
emissions by around a quarter. Aviation’s proportion of UK emissions is likely to continue to rise into
the future as other sectors of economic activity - particularly electrical power generation and sectors
amenable to increased electrification such as light duty road-transport and domestic space heating –
reduce their carbon intensity very substantially over the coming decades. The UK’s Committee on
Climate Change recognises that cost-effective opportunities for deep decarbonisation vary between
different sectors of activity, and that some sectors - particularly aviation, agriculture and parts of
industry - are not expected to reach zero emissions by 2050 [CCC, 2016a].
Nonetheless, UK aviation CO2 emissions per terminal passenger reduced by 20% between 2000 and
14
2014 , and our CO2 Road-Map shows how the carbon-intensity of UK aviation can be reduced very
substantially between 2010 and 2050 through a combination of measures. Additional reductions in UK
aviation’s carbon intensity post 2050 are likely but lie largely beyond the scope of this document.
1.6 Motivation for an Updated Road-Map
Since our CO2 Road-Map was last updated in 2012, the following significant developments have taken
place:
The Airports Commission has published demand growth scenarios encompassing a range of
economic futures and various options for additional runway capacity in the South East of the
UK [AC, 2015].
Several new aircraft types have been announced, and will enter service in the next few years.
These include the Airbus A330neo, the Boeing 777X, the Boeing 787-10 and the Airbus
A321LR.
The marketplace success of the Airbus A320neo family and Boeing 737 MAX family, and the
resulting very large order-books, means that their production runs will likely be longer than we
previously supposed. As a result, our view of the timescale within which their respective
successor aircraft types will enter service has changed materially.
A further three classes of alternative fuel for aviation have been certified for commercial use,
and together with a significant expansion in the range of suppliers offering these fuels this has
expanded the options available to aircraft operators wishing to employ them. This area
continues to develop rapidly, both technically and commercially.
The UN’s International Civil Aviation Organization (ICAO) has agreed an international fuel-
efficiency standard for new aircraft, to enter force from 2020.
ICAO has also agreed a global market-based measures scheme applicable to international
aviation, which will enable aviation to fund cost-effective emissions reduction activities in other
12
Data source: [NAEI], UK total includes CO2 emissions from bunker fuels (aviation and marine)
13
Data source: [NAEI], UK total includes CO2 emissions from bunker fuels (aviation and marine)
14
Source: SA analysis of data from [NAEI] and [CAA]
www.sustainableaviation.co.uk Page 10 of 83Sustainable Aviation CO2 Road-Map 2016 © Sustainable Aviation, Dec 2016
sectors through the purchase of offsets. We note that a high proportion of UK aviation CO 2
emissions is due to international routes, and so this development has considerable relevance
to the UK.
In December 2015, over 190 of the world’s nations reached an agreement, known as the Paris
Agreement, which aims to limit rises in global average temperature (relative to pre-industrial
levels) to well below 2 degrees C, with an aspiration to limit the rise to 1.5 degrees C. The
Paris Agreement goes beyond the basis upon which the UK’s current climate policy is
founded. In [CCC, 2016a], the Committee on Climate Change (CCC) explores the implications
of the Paris Agreement for UK climate policy, recommending that “the Government does not
alter the level of existing carbon budgets or the 2050 target now” and that “The priority for now
should be robust near-term action to close the gap to existing targets and open up options to
reach net zero emissions”. [CCC, 2016a] also re-iterates the CCC’s “central” scenario to 2050,
representing CCC’s “best assessment of the technologies and behaviours required to meet
targets cost-effectively while meeting the other criteria in the Climate Change Act”, in which
UK aviation emissions in 2050 are “around 2005 levels”.
Following the outcome of a referendum held in mid-2016, the UK is now on a path towards
leaving the European Union. [CCC, 2016b] considers the implications of this development for
UK climate policy, concluding that "The UK’s 2050 target for reducing greenhouse gas
emissions and the legislated carbon budgets (including the fifth carbon budget set in July
2016) remain appropriate as part of a UK contribution to global efforts to tackle climate
change". Nonetheless, there will no doubt be implications for UK travel patterns and the
strength of the UK economy, with a resulting impact upon levels of UK aviation activity. [IATA,
2016] provides a preliminary analysis of the topic, discussing relevant factors and suggesting
that “the number of UK air passengers could be 3-5% lower by 2020”. Subsequent analysis by
15
IATA suggests that UK passenger traffic, as measured by number of passengers, could by
2035 be 6% smaller in a “hard” Brexit case than in a “soft” Brexit case. Our view is that the
consequences of the 2016 referendum result will play out over a number of years, and that
future updates of our Road-Map will be better placed than this one to assess any resulting
impact upon levels of demand for UK aviation. In this edition of our Road-Map, we do not take
explicit account of any effects related to the 2016 referendum result.
1.7 Methodology
As with our previous Road-Maps, we first consider the likely growth in demand for UK aviation, using it
to derive a hypothetical “no-improvements” CO2 emissions scenario. We then consider the potential
for mitigation due to improvements in air-traffic management and operational practices, more efficient
engines and aircraft, and the increasing use of sustainable aviation fuels. We also consider the further
contribution from market-based measures which will be required to supplement the expected
reductions from the sources described immediately above if UK aviation is to reduce its net CO 2
emissions in 2050 to half of their 2005 levels.
1.8 Options for Reducing CO2
Section 3.3 of our 2012 CO2 Road-Map [SA, 2012] set out a number of broad approaches for reducing
CO2 from aviation. One item that was missing from that list, and whose prospects have strengthened
considerably since 2012, is the partial or complete electrification of aircraft propulsion for certain
sectors of the market. This is a topic that is explored more deeply in section 4.10.2 below.
15
http://www.iata.org/publications/Pages/brexit-impact-uk.aspx
www.sustainableaviation.co.uk Page 11 of 83Sustainable Aviation CO2 Road-Map 2016 © Sustainable Aviation, Dec 2016
1.9 The Role of Government
This document explores the substantial efforts being made across all parts of the aviation industry to
improve fuel-efficiency and reduce CO2-intensity, and sets out SA’s view of how those efforts will
impact CO2 emissions from UK aviation relative to a hypothetical no-improvements scenario.
However, bringing to fruition the projections set out in our CO2 Road-Map will not only require the
continued commitment and focus of the aviation industry itself, but will also rely on engagement from
Government.
Government should continue to support airspace modernisation in the UK, and maintain
momentum towards improved Air Traffic Management (ATM) collaboration across Europe.
We acknowledge the significant levels of government support to the UK aerospace industry
provided through initiatives such as the Aerospace Growth Partnership (AGP). In the coming
years Government must ensure that access by UK aerospace industry to ongoing funding for
high-value collaborative R&D remains in place.
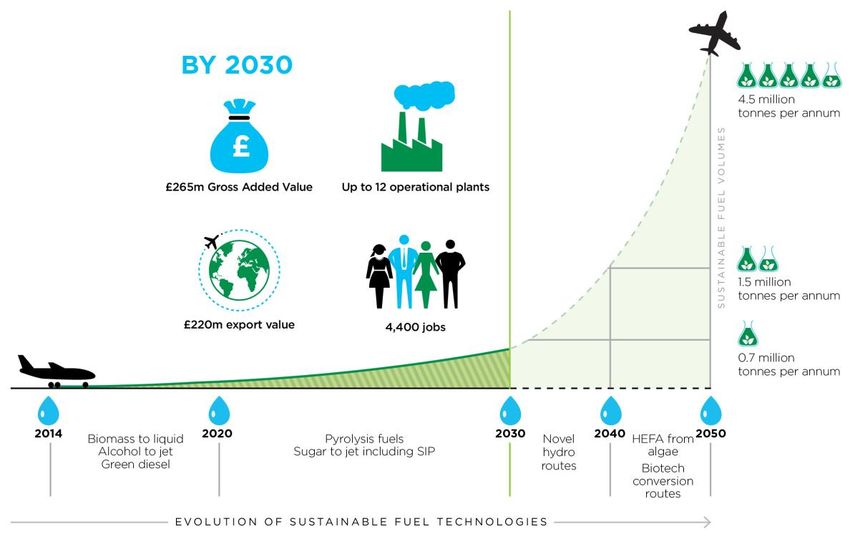
SA believes that there is great potential for the development of new supply chains for
Sustainable Aviation Fuels (SAF) in the UK. The SA Fuels Road-Map [SA, 2014] identified the
potential for 5-12 UK production facilities producing a range of sustainable fuels and
chemicals in the period to 2030. Government has recently indicated that there will be a role for
SAF in future transport policy. A lack of policy certainty has damaged investor confidence and
deterred investment in new UK infrastructure. We urge the Government to introduce binding
legislation and to provide clear long-term policy as soon as possible to enable the UK to
realise the opportunities for UK sustainable fuels production.
We welcome the role played by the UK Government in negotiations towards the ICAO global
MBMs agreement, which supports as far as 2035 the global aviation industry’s carbon neutral
growth ambition. Government should now focus on implementation details including avoiding
duplication of coverage with regional schemes. Government should also start the process
towards the global mechanism for 2035 onwards, which will be essential in supporting the
global aviation industry’s commitment to reduce net aviation CO 2 emissions by 50% by 2050,
relative to 2005 levels, while increasing capacity in support of economic growth.
In reaching our view of the extent to which mitigation options identified in this document will reduce
CO2 emissions from UK aviation, we have assumed that suitable levels of Government engagement
will be achieved with respect to each of the above areas.
1.10 Document Structure
The remainder of this document is structured as follows:
Section 2 sets out our hypothetical “no-improvements” scenario detailing the notional growth
in CO2 emissions from UK aviation that would take place assuming no improvements in fleet
fuel efficiency, no improvements in operational practices, and no adoption of sustainable
aviation fuels.
In sections 3 to 5 we set out our assumptions and analysis concerning the potential for
aviation to improve its carbon intensity through a variety of within-sector measures.
Section 6 discusses opportunities to reduce aviation’s net emissions further through market-
based measures which enable aviation to fund mitigation actions in other sectors in cases
where they can be implemented more cost effectively than within the aviation industry itself.
Finally, section 7 summarises the assumptions and presents the Road-Map itself along with a
discussion of its key messages.
www.sustainableaviation.co.uk Page 12 of 83Sustainable Aviation CO2 Road-Map 2016 © Sustainable Aviation, Dec 2016
2 Hypothetical “No-Improvements” Scenario
SUMMARY
This hypothetical scenario uses as its starting point the Airports Commission’s “Global
Growth” economic scenario, assuming new runway capacity in South East England and
assuming a “carbon-traded” framework.
Given these assumptions and choices, in the absence of any improvements in fleet fuel
efficiency or in operational practices, and assuming no use of sustainable aviation fuels, CO2
emissions from UK aviation would rise by 155% between 2010 and 2050, implying an average
annual growth rate of 2.37%. This is a slightly higher average growth rate than that used in our
2012 Road-Map, representing a balance between a number of factors as described in this
chapter.
Subsequent chapters of this document use this hypothetical “no-improvements” scenario as a
reference against which the potential impact of CO2 mitigation measures can be assessed.
2.1 Introduction
In this section we identify the hypothetical trajectory that UK aviation’s CO2 emissions could be
expected to follow in the absence of any action to improve the industry’s carbon intensity. Our
hypothetical “no-improvements” scenario therefore assumes a constant level of technology,
operational procedures and sustainable aviation fuel penetration, in which more aviation activity is
delivered at the same load factors using an increasing number of the same types of aircraft without
changing over time the manner in which they are operated or the type of fuel used. This hypothetical
“no-improvements” trajectory for UK aviation CO2 therefore follows forecast growth in aviation
16
activity , and serves as a reference against which the potential impact of our anticipated improvement
activities can be assessed.
Clearly, this hypothetical scenario does not correspond to a “business as usual” scenario, since
“business as usual” involves the rigorous pursuit of cost-reduction opportunities of which improving
fuel efficiency - and hence carbon intensity - is a major part.
2.2 Defining “Growth in Aviation Activity”
Growth in aviation activity can be expressed in many different ways, not all of them representative of
the corresponding growth in CO2 emissions that would take place in a hypothetical “no-improvements”
scenario. For example, growth could be expressed in terms of numbers of passengers, or number of
air transport movements. However, neither of those metrics captures the distance travelled by each
passenger or aircraft, and therefore they do not capture fundamental shifts in the market, for example
shifts in the balance between long-haul and short-haul flights. A more appropriate unit is the Revenue
Passenger Kilometre (RPK) which captures both the number of passengers carried and the distance
of travel. Growth in freight activity can be similarly represented using Freight Tonne Kilometres
(FTKs), capturing both the number of tonnes uplifted and the distance travelled.
Overall air-freight activity comprises two elements – firstly freight carried in the lower hold of
passenger aircraft (known as “bellyfreight” or “bellyhold”) and secondly freight carried on dedicated
freighter flights. Fuel-efficiency figures for passenger aircraft typically take account of the carriage of
bellyfreight, which often forms a significant element of the business models of aircraft operators.
Clearly, significant changes in the amount of bellyfreight carried can affect fuel-burn of a flight and
hence the apparent fuel efficiency per passenger kilometre on that flight. Based on evidence
16
A term which we define below
www.sustainableaviation.co.uk Page 13 of 83Sustainable Aviation CO2 Road-Map 2016 © Sustainable Aviation, Dec 2016
presented below, we make the assumption that bellyfreight tonnage is growing no more quickly than
passenger numbers.
A full picture of changing levels of aviation activity can thus be conveyed by considering growth in
RPKs on passenger flights and, separately, growth in FTKs on dedicated freighter flights.
2.3 Data Sources, Key Assumptions, and Calculations
This section provides a summary of our choice of data sources, key assumptions, and calculation
methods. Full details can be found in APPENDIX B.
Our demand growth forecasts for passenger flights are based on those published by the Airports
Commission [AC, 2015]. Starting with the family of demand growth forecast trajectories corresponding
17
to the Airports Commission’s “Global Growth” economic scenario in a “carbon-traded” framework , we
have taken the three RPK forecasts corresponding to the three additional-runway-capacity options and
18
averaged them to produce a single trajectory corresponding to our assumed growth in passenger
flights.
We have then shown that it is reasonable to assume that growth in FTKs on freighter flights will grow
no more quickly than RPKs on passenger flights. This has enabled us to estimate an “upper bound”
demand growth trajectory for freighter flights. Combining the two gives us our hypothetical “no-
improvements” demand growth trajectory. Full details can be found in APPENDIX B.
2.4 The Hypothetical “No-Improvements” Scenario
Table 1 summarises our hypothetical “no-improvements” scenario and the method used to combine
growth in passenger RPKs and freighter FTKs.
Hypothetical “No-Improvements” CO2 trajectory for UK aviation, relative to 2010
Pax RPKs Freighter FTKs Combined
% Growth
Year
Growth Growth Growth
Weighting Weighting
factor factor Factor 2016 2012
Road-Map Road-Map
2010 1 1 1 0 0
2020 1.32 1.1 1.31 31 35
2030 1.75 0.976 1.46 0.024 1.75 75 72
2040 2.14 1.79 2.13 113 113
2050 2.56 2.14 2.55 155 150
Average growth rate 2.37 % p.a. 2.32 %p.a.
Table 1 – Key figures relating to the hypothetical “no-improvements” emissions
trajectory used in this CO2 Road-Map. Scope: UK aviation. Source: SA analysis of
data from [AC, 2015], [AC, 2015a], [DfT, 2013] and [CAA] as described in the main text.
Comparing the last two columns of the table, we can see that the demand-growth trajectory is only
slightly higher than that which we employed in our 2012 Road-Map [SA, 2012]. This outcome is co-
incidental and is the result of a balance between a number of factors:
17
Reasons for these choices are given in APPENDIX B.
18
Sustainable Aviation does not have a position on the relative attractiveness of the three additional runway capacity options
www.sustainableaviation.co.uk Page 14 of 83Sustainable Aviation CO2 Road-Map 2016 © Sustainable Aviation, Dec 2016
For our 2016 Road-Map we have used recent aviation demand-growth forecasts which take
account of the strong economic downturn experienced in recent years, and its long-term
negative impact on demand for aviation.
Our assumptions for growth in freighter activity are no longer based on what with hindsight
was an overly ambitious growth forecast. Nonetheless we expect that our new assumptions
still overestimate slightly the likely out-turn for freighter FTKs.
CO2 emissions from freighters in our baseline year of 2010 are now believed to be 0.8 MtCO 2
[DfT, 2013] rather than the 1.1 MtCO2 [DfT, 2011] which we used in our 2012 Road-Map. As a
result, not only is the rate of growth in freighter FTKs less strong in our 2016 Road-Map than
in our 2012 Road-Map, but it is starting from a lower baseline position.
Increased runway capacity enabling greater aviation activity through reduction in capacity
constraints.
Carbon pricing, with a resulting upward pressure on ticket prices and corresponding downward
pressure on demand for aviation, is employed both in the [AC, 2015] forecasts upon which our 2016
Road-Map is based, and also in the [DfT, 2011] forecasts upon which our 2012 Road-map was based.
The assumed price of carbon in 2050 is respectively £196 (in 2008 pounds, figure 4.1 of [AC, 2015])
and £200 (in 2009 pounds, box 2.4 of [DfT, 2011]).
In a hypothetical “no-improvements” scenario such as that illustrated in Figure 1, CO2 emissions from
UK aviation would rise by 155% during the period from 2010 to 2050, implying an average annual
growth rate of 2.37%. In subsequent sections of this document we examine opportunities for mitigating
this growth-driven upward pressure on CO2 emissions from UK aviation.
Figure 1 – UK aviation CO2 emissions, relative to 2010, in a hypothetical “no-
improvements” scenario in which technology levels, operational practices, and
sustainable aviation fuel penetration levels remain unchanged from 2010. Scope:
UK aviation. Source: SA analysis of data from [AC, 2015], [AC, 2015a], [DfT, 2013] and
[CAA] as described in the main text.
www.sustainableaviation.co.uk Page 15 of 83Sustainable Aviation CO2 Road-Map 2016 © Sustainable Aviation, Dec 2016
3 Improvements in Air Traffic Management and Operations
SUMMARY
Improvements in air traffic management and operational practices are likely to improve the
carbon intensity of UK aviation by around 8.7% by 2050 relative to 2010, with the potential for
additional savings which we do not at this stage include in our assumptions. This result is very
similar to the 2012 Road-Map, although we have substantially improved the calculation
methodology in one area within this category.
To enable these improvements, Government must continue to support airspace modernisation
in the UK, and maintain momentum towards improved Air Traffic Management (ATM)
collaboration across Europe.
3.1 Introduction
As with our 2012 Road-Map [SA, 2012], this section sets out our view of likely improvements in UK
aviation’s carbon intensity arising from more efficient air traffic management (ATM), more efficient
aircraft operations, and the substitution of some aircraft auxiliary power unit (APU) usage with more
efficient and/or lower-carbon airport-based alternatives. A useful discussion of the range of
opportunities for fuel-efficiency improvement through improved ATM and operational practices can be
found in [ATAG, 2016]. Here we focus on assessing the scale of the available improvements, specific
to UK aviation.
3.2 Air Traffic Management (ATM)
3.2.1 Introduction
Section 4.2 of our 2012 CO 2 Road-Map provides an overview of this
topic and the broad areas in which efficiency improvements may be
obtained, as well as listing some of the initiatives underway at that
time. A more in-depth discussion of improvement opportunities has
19
since been published by NATS . In this 2016 Road-Map, we again
consider ATM-related CO2 mitigation opportunities in three
categories – 1) near term in NATS controlled airspace, 2) near term
in non-NATS airspace, and 3) longer term. We also list some recent
developments and achievements that have taken place since 2012.
3.2.2 Near-Term ATM-related CO2 Mitigation Opportunities – on ground and in NATS airspace
In 2008, NATS committed to a target of reducing CO 2 emissions from aircraft under NATS control by
10% per flight by 2020 relative to a 2006 baseline. However, the scope of “aircraft under NATS
control” is rather different from the scope of “UK aviation”. In APPENDIX C, we present our updated
and expanded analysis of how the NATS target translates into a reduction of 2.8% in CO2 from UK
aviation by 2020, relative to 2010.
Although the above discussion refers to a stated target for 2020, much progress has already been
made towards the achievement of that target. [NATS, 2016] describes recent achievements and
ongoing work to improve ATM efficiency, of which some highlights are as follows:
19
http://www.nats.aero/wp-content/uploads/2013/05/11001_NATS_Swatch-book_Online_Linked_240413_HS.pdf
www.sustainableaviation.co.uk Page 16 of 83Sustainable Aviation CO2 Road-Map 2016 © Sustainable Aviation, Dec 2016
A 4.3% reduction in CO2 emissions (relative to the 2006 baseline) has been achieved so far,
equivalent to reducing CO2 emissions from aircraft under NATS control by some 1.1 MtCO 2
per year relative to 2006 emissions.
XMAN (Cross Border Arrival Management) allows airborne holding time to be reduced by
instructing aircraft to reduce slightly their cruise speed at a distance of up to 350 nautical miles
from their destination airport, thus timing their arrival more precisely. Previous arrangements
for London-inbound flights meant that such speed reduction could be instructed only 80
nautical miles from the destination. In the coming years, XMAN will be deployed more widely
across Europe, enabling the benefits to apply to UK-outbound flights (within scope of our
Road-Map) as well as to UK-inbound flights (out of scope).
As part of the Borealis alliance, the implementation of Free Route Airspace, firstly in parts of
Scottish airspace and then more widely across UK airspace, will allow aircraft greater scope to
follow fuel-optimal routings (including taking account of weather conditions) rather than
20
following pre-defined routes. The iTEC system , which entered operational service in 2016,
will support the introduction of Free Route Airspace above 28,000 feet.
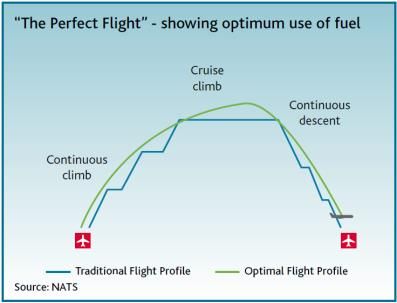
The number of continuous descent operations continues to increase, with work underway to
optimise the altitude at which continuous descent commences, increasing the efficiency
21
improvement .
3.2.3 Near-Term ATM-related CO2 Mitigation Opportunities – Non-NATS airspace
We anticipate that other ANSPs will also deliver improvements in ATM efficiency within the 2010-2020
22,23
timeframe , and that these will yield CO2 reductions during the en-route and arrival phases of
outbound international flights once they leave NATS airspace. We conservatively estimate that the
benefit to these flights corresponds to two tenths of the 10% efficiency improvement targeted by
24
projects such as the Single European Sky (SES) . In 2006, CO2 emissions outside NATS airspace
25
attributable to flights which departed from UK airports amounted to 28.1 MtCO2 . Saving 2% of these
emissions would yield a reduction of 0.56 MtCO 2 relative to 2006 emissions, corresponding to 1.5% of
total UK aviation CO2 emissions in 2006. Again, due to the anticipated delivery timescale of these
savings, we assume that this 1.5% also applies to the Road-Map’s 2010 baseline. To take account of
possible uncertainties, in our Road-Map we assume 1.0% as the likely contribution from this source.
3.2.4 Longer-Term ATM-related CO2 Mitigation Opportunities
In this category, we have no additional information relative to that available in 2012. As a result we
again assume a 2.5% efficiency improvement from longer-term (2020-2050) ATM improvements
including restructuring of airspace boundaries and improved separation minima allowing more
optimum flight profiles.
As with our 2012 Road-Map, it has not been possible in this longer-term ATM category to produce a
calculation-based estimate, and we rely on judgement to underpin our assumption in this category.
20
http://www.nats.aero/news/next-generation-air-traffic-technology-goes-live-at-nats-prestwick/, viewed 14th July 2016
21
Although CDO will yield genuine reductions in aviation CO2 emissions, only the savings relating to domestic arrivals are
within scope of our Road-Map, while those relating to international arrivals are not.
22
See for example http://www.navcanada.ca/EN/about-us/Documents/CIFER_English_Final_Medium_Res.pdf, which
describes ATM improvements implemented and planned by NAV CANADA which are expected to save some 15 million
tonnes of CO2e (cumulative) between 2010 and 2020. A proportion of this saving is attributable to flights from Europe to
North America.
23
http://www.sesarju.eu/sites/default/files/documents/reports/SESAR_Demo_Brochure_2012_2014.pdf
24
http://www.sesarju.eu/benefits/environment/how-sesar-contributing-environmental-flight-performance, viewed 14th July 2016
25
38.1 MtCO2 total [NAEI, 2011], minus the 10.0 MtCO2 taking place in NATS airspace, leaves 28.1MtCO2 outside NATS
airspace.
www.sustainableaviation.co.uk Page 17 of 83Sustainable Aviation CO2 Road-Map 2016 © Sustainable Aviation, Dec 2016
However, we anticipate that greater clarity will emerge over time, and we shall revise our assumptions
in this category as and when substantially better information becomes available.
3.2.5 Supporting Products, Technologies and Research Programmes
In addition to the examples of improvement initiatives listed in section 3.2.2 above, other
technologies, products and research programmes offering opportunities for efficiency improvement in
ATM and/or aircraft operations over a variety of timescales include the following:
26
NATS is investing significantly to transform operations in support of the Single European Sky
project, helping to reduce inefficiency between different areas of NATS airspace.
The TRANSIT research programme, announced during 2016, will develop opportunities to
optimise aircraft taxi routings around airports, reducing “aeroplane taxi times, operating costs
27
and environmental impact at airports around the world” .
NASA’s Traffic Aware Planner application searches for “route and/or altitude changes that
28
could save fuel or flight time and displays those solutions directly to the flight crew” .
Boeing’s Wind Updates service “delivers timely, accurate weather information to the FMC
29
while in flight to enhance flight efficiency and on-time performance” .
Boeing’s Direct Routes service “identifies and communicates emergent in-flight opportunities
30
to reduce one minute or more of flight time” .
NASA’s Terminal Sequencing and Spacing tool “will allow pilots to better use flight deck
31
automation to fly fuel-efficient, optimized profile descents” .
Required Navigation Performance (RNP) and the Global Navigation Satellite Landing System
(GLS) use navigation satellites for precision guidance of aircraft. Although most commercial
aircraft today are equipped with RNP and GLS capability, further opportunities exist to deploy
that capability to full effect and thus further efficiency improvement opportunities exist.
Advantages of full RNP/GLS deployment include reductions in track miles flown, and an
increase in airport capacity (with possible reductions in airborne holding) enabled by
concurrent approach and landing operations on parallel runways.
The TOPFLIGHT collaborative project - involving NATS, Airbus ProSky, Boeing and British
Airways - tested sustainable gate-to-gate transatlantic flight optimisation, demonstrating a
potential reduction in CO2 emissions of up to 2% for each transatlantic flight, without detriment
to other airspace users [SA, 2015].
Rolls-Royce VisiumFUEL enables operators “to quickly understand their current fuel usage
and implement immediate fuel saving initiatives…..Whether it is a pilot making confident fuel-
related decisions without compromising safety, or control centre staff improving the routing of
26
http://www.nats.aero/news/next-generation-air-traffic-technology-goes-live-at-nats-prestwick/, viewed 21st Sept 2016
27
https://alumni.cranfield.ac.uk/Public/News_Item.aspx?Id=1467&Ref=en0816, viewed 16th Aug 2016
28
http://www.nasa.gov/press-release/nasa-developed-technology-aims-to-save-commercial-airlines-fuel-time, viewed 14th July
2016
29
http://www.boeing.com/resources/boeingdotcom/commercial/services/assets/brochure/fs-windupdates.pdf, viewed 30th
August 2016
30
http://www.boeing.com/resources/boeingdotcom/commercial/services/assets/brochure/directroutes.pdf, viewed 20th August
2016
31
http://www.nasa.gov/press-release/nasa-developed-air-traffic-management-tool-flies-into-use, viewed 14th July 2016
www.sustainableaviation.co.uk Page 18 of 83You can also read