Cognitive Heterogeneity across Schizophrenia and Bipolar Disorder: A Cluster Analysis of Intellectual Trajectories
←
→
Page content transcription
If your browser does not render page correctly, please read the page content below
Journal of the International Neuropsychological Society (2020), 26, 860–872
        Copyright © INS. Published by Cambridge University Press, 2020. This is an Open Access article, distributed under the terms of the Creative Commons
        Attribution licence (http://creativecommons.org/licenses/by/4.0/), which permits unrestricted re-use, distribution, and reproduction in any medium, provided
        the original work is properly cited.
        doi:10.1017/S1355617720000442

        Cognitive Heterogeneity across Schizophrenia and Bipolar
        Disorder: A Cluster Analysis of Intellectual Trajectories

        Anja Vaskinn1,2,*            , Beathe Haatveit1, Ingrid Melle1,2, Ole A. Andreassen1,2, Torill Ueland1,3 and Kjetil Sundet1,3
        1
         Norwegian Centre for Mental Disorders Research, Oslo University Hospital, Oslo, Norway
        2
         Institute of Clinical Medicine, University of Oslo, Oslo, Norway
        3
         Department of Psychology, University of Oslo, Oslo, Norway

        (RECEIVED November 21, 2019; FINAL REVISION February 10, 2020; ACCEPTED March 13, 2020; FIRST PUBLISHED ONLINE May 19, 2020)

        Abstract
        Objective: Cognitive dysfunction cut across diagnostic categories and is present in both schizophrenia and bipolar
        disorder, although with considerable heterogeneity in both disorders. This study examined if distinct cognitive
        subgroups could be identified across schizophrenia and bipolar disorder based on the intellectual trajectory from the
        premorbid phase to after illness onset. Method: Three hundred and ninety-eight individuals with schizophrenia
        (n = 223) or bipolar I disorder (n = 175) underwent clinical and neuropsychological assessment. Hierarchical and
        k-means cluster analyses using premorbid (National Adult Reading Test) and current IQ (Wechsler Abbreviated Scale
        of Intelligence) estimates were performed for each diagnostic category, and the whole sample collapsed. Resulting
        clusters were compared on neuropsychological, functional, and clinical variables. Healthy controls (n = 476) were
        included for analyses of neuropsychological performance. Results: Cluster analyses consistently yielded three clusters:
        a relatively intact group (36% of whole sample), an intermediate group with mild cognitive impairment (44%), and an
        impaired group with global deficits (20%). The clusters were validated by multinomial logistic regression and differed
        significantly for neuropsychological, functional, and clinical measures. The relatively intact group (32% of the
        schizophrenia sample and 42% of the bipolar sample) performed below healthy controls for speeded neuropsychological
        tests. Conclusions: Three cognitive clusters were identified across schizophrenia and bipolar disorder using premorbid
        and current IQ estimates. Groups differed for clinical, functional, and neuropsychological variables, implying their
        meaningfulness. One-third of the schizophrenia sample belonged to the relatively intact group, highlighting that
        neuropsychological assessment is needed for the precise characterization of the individual.
        Keywords: Schizophrenia, Bipolar disorder, Cognition, Heterogeneity, Neuropsychology, Psychosis

        INTRODUCTION                                                                             bipolar disorder (Baune & Malhi, 2015). This has paved
                                                                                                 the way for new treatment interventions with cognition as
        Although not a diagnostic criterion, cognition has been at the
                                                                                                 the primary target (Wykes, Huddy, Cellard, McGurk, &
        core of a large body of research that over the last quarter of a
                                                                                                 Czobor, 2011).
        century has increased our understanding of severe mental dis-
                                                                                                     While cognitive impairments are central to severe mental
        order substantially. In addition to studies that have estab-
                                                                                                 illness, there is substantial cognitive heterogeneity in both
        lished that individuals with schizophrenia (Kahn & Keefe,
                                                                                                 schizophrenia and bipolar disorder. A recent review of the
        2013) and bipolar disorder (Arts, Jabben, Krabbendam, &
                                                                                                 literature on schizophrenia spectrum disorders (Carruthers,
        van Os, 2008; Bora, Yucel, & Pantelis, 2009) experience cog-
                                                                                                 Van Rheenen, Gurvich, Sumner, & Rossell, 2019a) con-
        nitive impairments (Bortolato, Miskowiak, Köhler, Vieta, &
                                                                                                 cluded that most commonly three distinct cognitive sub-
        Carvalho, 2015), research has shown that variation in cogni-
                                                                                                 groups emerge, regardless of the methodology used to
        tion is an important determinant of functional outcome in
                                                                                                 tease out the heterogeneity. The subgroups that emerge are
        schizophrenia (Green, Kern, & Heaton, 2004) as well as
                                                                                                 a relatively intact group with high cognitive performance,
                                                                                                 an intermediate group with mild–moderate cognitive impair-
           *Correspondence and reprint requests to: Anja Vaskinn, Oslo University                ment, and a globally impaired subgroup characterized by
        Hospital, Division Mental Health and Addiction, Psychosis Research Unit/
        TOP, PO Box 4956 Nydalen, 0424 Oslo, Norway. E-mail: anja.vaskinn@                       substantial cognitive impairment (Carruthers et al., 2019a).
        medisin.uio.no                                                                           Different approaches have been taken to arrive at these
                                                                                           860
Downloaded from https://www.cambridge.org/core. IP address: 46.4.80.155, on 16 Dec 2020 at 02:22:24, subject to the Cambridge Core terms of use, available at https://www.cambridge.org/core/terms
. https://doi.org/10.1017/S1355617720000442
Cognitive subgroups in severe mental illness 861
cognitive subgroups. Whereas some studies have applied has substantial impairments present in all domains
clinical classification criteria, others have used data-driven (Lewandowski et al., 2014; Van Rheenen et al., 2017;
approaches. Further, some research has been based on current Lewandowski et al., 2018). These cross-diagnostic cognitive
neuropsychological test performance, while cognitive trajec- subgroups have been shown to differ in a step-wise manner
tories have been examined in other studies. with regard to functioning, with the severely impaired sub-
One specific line of studies has focused on intellectual tra- group evidencing the most pronounced deficits in community
jectories from the premorbid phase to after illness onset in functioning (Lewandowski et al., 2018).
examinations of cognitive heterogeneity in schizophrenia. The substantial heterogeneity of schizophrenia and bipolar
Clinical classification methods have used premorbid and disorder tampers our efforts to provide adequate treatment.
current IQ scores to arrive at three cognitive subgroups. One step toward providing better and optimized treatment
The preserved group is defined by a premorbid IQ score is to increase our understanding of cognitive heterogeneity.
> 90 and < 10 points of decline from premorbid to current The question of whether identified cognitive subgroups are
IQ, the deteriorated group has ≥ 10 IQ points decline, and meaningful and important can only be answered through their
the compromised group has a premorbid IQ < 90 (and a IQ external validation, that is, by showing that they are neurobio-
decline < 10 points) (Weickert et al., 2000). Studies using this logically different and have different psychosocial outcomes
clinical classification method have confirmed the groups or treatment responses (Carruthers et al., 2019a). In order to
using empirical clustering methods (Weickert et al., 2000; embark on that journey, we need studies that examine the
Wells et al., 2015). The subgroups have been shown to differ cognitive heterogeneity from a variety of angles, providing
in cognitive profile (Weickert et al., 2000; Wells et al., 2015), evidence to either support or question the existence of cogni-
functional outcome (Wells et al., 2015), symptom profile tive subgroups.
(Wells et al., 2015), and brain volume or cortical thickness For instance, it is unclear if using the intellectual trajectory
(Weinberg et al., 2016; Van Rheenen et al., 2018). as a means to understand cognitive heterogeneity will pro-
Specifically, the compromised subgroup has been reported duce the same cognitive subgroups for bipolar disorder as
to have impairments in some cognitive domains that are has been shown for schizophrenia. Whereas schizophrenia
not impaired in the other subgroups, that is, language and vis- is considered a neurodevelopmental disorder, with early, pre-
ual processing (Weickert et al., 2000) and visuospatial abil- morbid cognitive impairment, further decline around disease
ities (Wells et al., 2015). Further, although brain volume and onset, and a static course after illness onset, the picture is less
thickness reductions are present in all cognitive subgroups clear for bipolar disorder (Sheffield, Karcher & Barch, 2018).
compared to healthy controls, the compromised subgroup In fact, important differences between schizophrenia and
seems to show additional abnormalities in some brain regions bipolar disorder have been reported in that both high child-
(Van Rheenen et al., 2018). They also have lower global hood IQ (Koenen et al., 2009; Smith et al., 2015) and excel-
functioning scores (Wells et al., 2015). Although these stud- lent school performance in adolescence (MacCabe et al.,
ies can provide indications of cognitive development, they 2010) as well as low premorbid IQ (Tiihonen et al., 2005)
are cross sectional in nature and therefore present putative may confer risk for bipolar disorder. This is in contrast to
development. schizophrenia (Bora, 2015) for which low childhood
In the case of bipolar disorder, data-driven cluster analytic (Khandaker, Barnett, White, & Jones, 2011) or low adoles-
studies have also identified three discrete cognitive sub- cent (Kendler, Ohlsson, Sundquist, & Sundquist, 2015) IQ
groups (Burdick et al., 2014; Jensen, Knorr, Vinberg, is considered a risk factor. Cognitive impairments thus appear
Kessing, & Miskowiak, 2016; Van Rheenen et al., 2017); to provide a linear risk for schizophrenia, but a U-shaped risk
severely impaired, mildly impaired, and relatively intact that for bipolar disorder, with above-average cognitive function-
also extend to schizophrenia in cross-diagnostic studies (Van ing increasing the risk more than low IQ (Parellada, Gomez-
Rheenen et al., 2017). In some studies, a fourth moderately Vallejo, Burdeus, & Arango, 2017). This clearly implies
impaired group appears, with neuropsychological perfor- the existence of different cognitive subgroups within the
mance which is intermediate to the severely and mildly diagnostic category of bipolar disorder. Inconsistent results
impaired subgroups (Lewandowski, Sperry, Cohen & concerning cognitive course after illness onset may be
Öngur, 2014; Lewandowski, Baker, McCarthy, Norris, & explained by cognitive heterogeneity. Although one review
Öngur, 2018). Generally, in cross-diagnostic research, the concluded that bipolar disorder (affective psychosis) seems
relatively intact group performs in line with healthy controls to be characterized by cognitive deficits that worsen over time
(Van Rheenen et al., 2017) or normative data (Lewandowski after illness onset, suggesting neuroprogressive processes
et al., 2014) on neuropsychological tests, sometimes with (Sheffield et al., 2018), other studies indicate stability of cog-
slightly worse performance in some domains (Van nitive functioning over time (Demmo et al., 2018; Torres
Rheenen et al., 2017) and slightly better performance in other et al., 2020). Thus, it is currently unknown whether bipolar
domains (Lewandowski et al., 2014; Van Rheenen et al., disorder is characterized by cognitive stability or progression
2017). The intermediate cognitive subgroups show signifi- after illness onset (Van Rheenen et al., 2020). Most likely,
cant impairments in all domains, roughly within 1–1.5 stan- both notions are correct. A meta-analysis of studies that
dard deviations of healthy controls (Van Rheenen et al., 2017; included participants with schizophrenia and bipolar disorder
Lewandowski et al., 2018). The severely impaired group in direct comparisons concluded that significant premorbid
Downloaded from https://www.cambridge.org/core. IP address: 46.4.80.155, on 16 Dec 2020 at 02:22:24, subject to the Cambridge Core terms of use, available at https://www.cambridge.org/core/terms
. https://doi.org/10.1017/S1355617720000442862 A. Vaskinn et al.
deficits are present in schizophrenia and that both disorders symptoms were indexed by the Positive and Negative
are characterized by cognitive decline after illness onset, with Syndrome Scale (PANSS; Kay, Fizsbein, & Opler, 1987).
larger impairments in schizophrenia (Trotta, Murray, & Depression was assessed with the Inventory of Depressive
MacCabe., 2015). Indeed, there is evidence for neurodeve- Symptoms, clinician rated (IDS-C; Rush, Guillon, Basco,
lopmental and neuroprogressive cognitive trajectories in Jarrett, & Trivedi, 1996) and mania with the Young
both disorders (Menkes, Armstrong, Balckford, Heckers, & Mania Rating Scale (YMRS; Young, Biggs, Ziegler, &
Woodward, 2019). Meyer, 1978). See Table 1 for clinical information. The mean
The aim of this study is to provide an independent depression scores indicate mild depression, whereas the
replication of previous research that has identified distinct mania scores are in line with a normal (non-manic) state
cognitive schizophrenia groups using premorbid and current (definition of euthymia: IDS-C ≤ 12; YMRS < 8: Tohen
IQ estimates (Weickert et al., 2000; Wells et al., 2015). et al., 2009).
Through empirical classification, we will expand previous
studies by including individuals with bipolar disorder along
with participants with schizophrenia. To our knowledge, this Neuropsychological tests
is the first study to examine intellectual trajectories in bipolar
Current IQ was assessed with the Wechsler Abbreviated
disorder. Cognitive subgroups will be compared on neuro-
Scale of Intelligence (WASI; Wechsler, 2007). Premorbid
psychological test results and on measures of functioning
IQ was measured with the Norwegian version of the
and clinical symptoms/psychopathology.
National Adult Reading Test (NART; Sundet & Vaskinn,
2008). See Table 1 for the IQ scores of the three participant
METHODS groups. We attribute the somewhat high IQ scores to the
properties of the Norwegian WASI, which uses US norms,
Participants suspected to yield higher IQs than versions used in other
countries (Siqveland, Dalsbø, Harboe, & Leiknes, 2014).
Participants recruited to the ongoing TOP study at Oslo Our remaining neuropsychological test battery was con-
University Hospital, Norway, from 2003–2017 were structed to cover domains relevant to severe mental disorder.
included. In all, 476 healthy control participants (HC), 223 Attention was assessed with Digit Span (forward and
individuals with schizophrenia, and 175 with bipolar disorder backward collapsed) (Wechsler Adult Intelligent Test III
were subjected to analyses of neuropsychological, psycho- (WAIS-III; Wechsler, 2003). Digit Symbol, also from
pathological, and functional differences across IQ-defined WAIS-III, was the measure of Psychomotor speed. Motor
cognitive subgroups. We focused on narrow schizophrenia function was measured with the Grooved Pegboard test
or bipolar disorder and only included individuals with (Kløve, 1963). Verbal memory was assessed with the long
DSM-IV schizophrenia or bipolar I disorder. Diagnoses were delay free recall condition of the CVLT-II (Delis et al.,
based on the SCID interview (First, Spitzer, Gibbon, & 2004). The total number of list A words recalled during the
Williams, 1995) conducted by trained clinical psychologists learning trials on the CVLT-II was our measure of verbal
or medical doctors/psychiatrists. Participants were included learning along with the Logical Memory Test from
regardless of IQ level, but individuals with poor test effort Wechsler Memory Scale (WMS-III; Wechsler, Wycherly,
defined as committing > 2 errors on the forced recognition & Benjamin, 1998), whereas visual learning was assessed
trial of the California Verbal Learning Test-II (CVLT-II; with Rey-Osterrieth Complex Figure Test (RCFT) (Meyers
Delis, Kramer, Kaplan, & Ober, 2004) were excluded. & Meyers, 1995). Working memory was indexed by Letter
Further, only those with Norwegian as mother tongue or, if Number Sequencing (LNS) from WAIS-III. Finally, two
this was not the case, who had completed all formal education subtests from the Delis-Kaplan Executive Function System
in Norway were included. Other exclusion criteria were dys- (D-KEFS) (Delis, Kaplan, & Kramer, 2005) were included
lexia, head trauma requiring hospitalization, or neurological as measures of executive function: Category Fluency from
disease. Participants were provided with oral and written the Verbal Fluency Test and the Stroop condition from the
information before they signed informed consent and Color-Word Interference Test. The RCFT and LNS were
assessed in a clinically stable state. The study was completed added to the battery after some time, thereby yielding missing
in accordance with the Helsinki Declaration and approved by scores for some participants. The exact number of partici-
the regional committee for medical research ethics. pants that underwent assessment with any given test is
provided in Table 3.
Measures
Clinical measures NART and premorbid IQ
Psychopathology was assessed with four instruments. The A previously recommended NART formula was based on
Global Assessment of Functioning, symptoms subscale normative data from a cohort of healthy control participants
(GAF-s; Pedersen, Hagtvedt, & Karterud, 2007) provided a (HC) (n = 270), validated in samples of individuals with
measure of global symptom load. Positive and negative schizophrenia spectrum (n = 110) and bipolar spectrum
Downloaded from https://www.cambridge.org/core. IP address: 46.4.80.155, on 16 Dec 2020 at 02:22:24, subject to the Cambridge Core terms of use, available at https://www.cambridge.org/core/terms
. https://doi.org/10.1017/S1355617720000442Cognitive subgroups in severe mental illness 863
Table 1. Demographic and clinical characteristics, functioning and IQ in participants with schizophrenia or bipolar I disorder and in healthy
participants
Participants with Participants with bipolar I Healthy control
schizophrenia disorder participants
n = 223 n = 175 n = 476 Statistic
Demographics
Age 30.8 (9.5) 34.0 (12.3) 34.6 (10.1) F = 10.1, p < 0.001
SZ < BD, HC
Gender (m/f) 134/89 79/96 232/244 x2 = 10.8, p = 0.005
WASI IQ 103.0 (13.8) 107.7 (12.4) 113.2 (9.6) F = 63.0, p < 0.001
SZ < BD < HC
NART IQ 110.1 (7.0) 112.2 (6.6) 114.1 (5.4) F = 32.3, p < 0.001
SZ < BD < HC
IQ decline 7.2 (10.8) 4.5 (10.2) 0.8 (8.5) F = 35.6, p < 0.001
SZ > BD > HC
Education (years) 12.3 (2.4) 13.4 (2.4) 14.2 (2.3) F = 50.0, p < 0.001
SZ < BD < HC
Clinical characteristics
GAF-s 40.6 (10.2) 56.6 (12.8) - t = -13.9, p < 0.001
PANSS positive 15.4 (5.3)1 10.3 (3.8)2 - t = 10.7, p < 0.001
PANSS negative 16.2 (6.3)3 10.5 (3.9)2 - t = 10.5, p < 0.001
IDS-C 16.0 (10.9)4 15.5 (11.6)5 - t = 0.4, p = 0.722
YMRS 5.4 (5.3)6 3.4 (5.1)2 - t = 3.8, p < 0.001
Antipsychotic medication
n (%)
-atypical 184 (82.5%) 98 (56%) - x2 = 48.3, p < 0.001
-typical 15 (6.7%) 6 (3.4%) -
Antiepileptic medication 31 (13.9%) 78 (44.6%) - x2 = 46.4, p < 0.001
n (%)
Lithium n (%) 0 (0%) 38 (21.7%) - x2 = 53.5, p < 0.001
Antidepressants n (%) 75 (32.3%) 57 (32.6%) - x2 < 0.1, p = 0.952
Functioning
GAF-f 42.1 (9.7) 53.0 (13.1) - t = -9.57, p < 0.001
SFS withdrawal 100.7 (10.7)7 106.0 (11.3)8 120.1 (8.7) F = 331.3, p < 0.001
SZ < BD < HC
SFS interpersonal 113.1 (18.3)7 119.5 (20.1)8 138.4 (12.1) F = 223.2, p < 0.001
communication SZ < BD < HC
SFS prosocial behavior 103.9 (11.4)9 106.0 (11.8)8 117.9 (8.2) F = 185.9, p < 0.001
SZ, BD < HC
SFS recreation 108.3 (12.8)7 109.6 (11.9)8 121.8 (5.0) F = 213.4, p < 0.001
SZ, BD < HC
SFS independence 105.5 (14.3)7 110.6 (16.1)8 126.5 (12.5) F = 199.7, p < 0.001
competence SZ < BD < HC
SFS independence 105.7 (13.9)7 112.1 (14.3)8 123.4 (10.0) F = 172.9, p < 0.001
performance SZ < BD < HC
SFS employment10 104.0 (11.3) 110.1 (12.3)11 121.6 (3.3) F = 360.8, p < 0.001
SZ < BD < HC
GAF-s = Global Assessment of Functioning, symptoms subscale. PANSS = Positive and Negative Syndrome Scale. YMRS = Young Mania Rating Scale.
IDS-C = Inventory of Depressive Symptoms-Clinician rated. GAF-f = Global Assessment of Functioning, function subscale. SFS = Social Functioning Scale.
1
n = 220 due to missing data; 2 n = 174 due to missing data; 3 n = 221 due to missing data; 4 n = 178 due to missing data; 5 n = 166 due to missing data; 6 n = 211
due to missing data; 7 n = 210 due to missing data; 8 n = 173 due to missing data; 9 n = 209 due to missing data; 10 n = 207 due to missing data; 11 n = 172 due to
missing data.
(n = 100) disorders, all from our center (Sundet & Vaskinn, Vaskinn, 2008). The publication of several formulas may have
2008). The formula used number of NART errors, age, and edu- caused some confusion. For the current study, we simplified the
cation and yielded possible premorbid IQ scores from 82.0 to previously recommended formula, without compromising the
126.6. Other formulas, without age and education, were also range of possible premorbid IQ scores, by excluding education
presented, but were not recommended for use (Sundet & from the regression equation:
Downloaded from https://www.cambridge.org/core. IP address: 46.4.80.155, on 16 Dec 2020 at 02:22:24, subject to the Cambridge Core terms of use, available at https://www.cambridge.org/core/terms
. https://doi.org/10.1017/S1355617720000442864 A. Vaskinn et al.
NART IQ ¼ 129:5 þ ðNART errors x 0:79Þ where N is the number of individuals, k is the number of clus-
ters, SSB is the between-cluster variation, and SSW is the
þ ðAge x 0:12Þ
within-cluster variation. VRCs were calculated from the
K-means cluster analyses for participants with schizophrenia,
This was done using a new, larger, and independent sample of
with bipolar I disorder, and for the two diagnostic categories,
HCs (n = 613), included after the first Norwegian NART
collapsed. Pooled between and within cluster sum of squares
publication (Sundet & Vaskinn, 2008), that is, 2008–2017.
(SSB and SSW), that is, for WASI and NART collapsed, were
The new, simpler formula yielded a comparable range
used in the VRC calculations. A higher VRC indicates a bet-
(82.2–127.3) to the old formula, but a wider range compared
ter cluster solution (Calinski & Harabasz, 1974; Milligan &
to a formula without age (87.8–124.8). This new formula was
Cooper, 1985). To validate the clusters from the consensus
validated in individuals with schizophrenia (n = 102) or bipo-
decision in the cross-diagnostic sample, multinomial logistic
lar I disorder (n = 101), also included from 2008 to 2017, by
regression was used to predict cluster membership (depen-
comparing the difference between premorbid IQ, current IQ,
dent variable) in individuals with schizophrenia or bipolar
and IQ decline between HCs and the two clinical groups. This
disorder from NART IQ and WASI IQ (independent varia-
was done using three separate univariate analyses of variance
bles). As an additional validation of the clusters, a multivari-
(ANOVA). See Supplementary Table 1 for demographic,
ate analysis of variance (MANOVA) was performed with the
clinical, and IQ data for these three participant groups.
10 neuropsychological tests as dependent variables and diag-
nostic group (schizophrenia, bipolar I disorder) and cluster
membership (cognitive subgroup) as independent variables.
Measures of functioning Thereafter, the cross-diagnostic cognitive subgroups yielded
Global functioning was assessed with GAF, function sub- from the K-means cluster analysis (with the chosen number
scale (GAF-f; Pedersen et al., 2007). Social functioning of clusters) were subjected to group comparisons using
was measured with the Norwegian version of the Social ANOVAs or MANOVAs. Due to missing data on single tests,
Functioning Scale (SFS; Birchwood, Smith, Cochrane, neuropsychological group differences were investigated
Wetton, & Copestake, 1994), validated for schizophrenia with a series of ANOVAs, albeit bonferroni-corrected for
and bipolar disorder (Hellvin et al., 2010). SFS is a self-report multiple comparisons (p-level of 0.05/10 neuropsychological
questionnaire consisting of seven scales that assess various tests = new p-level 0.005). GAF-f was examined with an
social behaviors. All seven scales were used. See Table 1 ANOVA, whereas the seven SFS subscales were analyzed
for information on functioning. with a MANOVA. In case of a significant overall group effect
for SFS, follow-up ANOVAs for each SFS subscale were
conducted. Finally, the five symptom measures were sub-
Statistical analyses jected to five ANOVAs, but with correction for multiple
testing (p-level of 0.05/5 symptom measures = new p-level
All analyses were done using SPSS, version 25.0. The cluster 0.01). HCs (n = 476) were included in the statistical analyses
analyses were conducted in participants with schizophrenia of neuropsychological group differences.
and bipolar I disorder (n = 398). First, in line with previous
studies, participants were subjected to hierarchical cluster
analysis with complete linkage (furthest neighbor) and
RESULTS
squared Euclidian distances using NART IQ and WASI
IQ. This was done first in participants with schizophrenia (n The dendrograms and scree plots from the hierarchical cluster
= 223) or bipolar I disorder (n = 175), separately, then for the analyses for schizophrenia, bipolar disorder, and the samples
two diagnostic categories, collapsed. A consensus decision collapsed all indicated three clusters (see Supplementary
on number of clusters, that is, cognitive subgroups, was Material for scree plots). The VRCs from the K-means
undertaken in two steps. First, the dendrograms and scree cluster analyses are presented in Supplementary Table 2.
plots (of agglomeration coefficients) from the hierarchical For bipolar disorder and the sample collapsed, the highest
cluster analyses were subjected to visual inspection. This VRCs appeared for a three-cluster solution. For schizophre-
included the “elbow test” for the scree plots. Second, variance nia, the VRCs for two- and three-cluster solutions were
ratio criterions (VRCs) according to Calinski and Harabasz almost identical. Since the dendrograms and scree plots were
(1974) were calculated from K-means cluster analyses with deemed consistent with a three-cluster solution, the consen-
number of clusters ranging from two to five. VRC is one sus decision for schizophrenia was also three clusters. The K-
of many clustering validity criteria and was found to rank means cluster analysis of the whole sample with number “3”
among the best in an investigation of 40 such criteria was used to create three clusters, or cognitive subgroups.
(Vendramin, Campello, & Hruschka, 2010). The VRC is See Figure 1 for a graphical presentation of the clusters.
defined as: The multinomial logistic regression found the final model
with premorbid NART IQ and WASI IQ as predictors for
SSB N k cluster membership to be highly significant (x2 = 834.6,
SSW k 1 df = 4, p < 0.001, Nagelkerke = 1.00). The MANOVA yielded
Downloaded from https://www.cambridge.org/core. IP address: 46.4.80.155, on 16 Dec 2020 at 02:22:24, subject to the Cambridge Core terms of use, available at https://www.cambridge.org/core/terms
. https://doi.org/10.1017/S1355617720000442Cognitive subgroups in severe mental illness 865
Table 2. IQ and demographics in cognitive subgroups across diagnostic categories (schizophrenia n = 223; bipolar disorder n = 175) based on
empirical clustering (n = 398)
Cluster 1: Intact Cluster 2: Intermediate Cluster 3: Impaired Statistic
N n = 145 n = 175 n = 78 -
Proportion of sample across diagnoses 36% 44% 20% -
Proportion of schizophrenia sample 32% 42% 26% -
Proportion of bipolar disorder sample 42% 46% 12% -
Diagnostic distribution: schizophrenia/bipolar 72/73 94/81 57/21 x2 = 12.0
disorder n (%) (50/50) (54/46) (73/27) p = 0.003
NART IQ Mean (SD) 116.2 (4.8) 109.8 (5.4) 104.2 (6.0) F = 138.36
Min-max 102.8 – 123.7 91.9 – 121.1 91.1 – 119 p < 0.001
1>2>3
WASI IQ Mean (SD) 118.3 (6.5) 103.1 (4.5) 85.0 (7.2) F = 837.94
Min-max 108 – 138 92 – 113 54 – 95 p < 0.001
1>2>3
IQ decline - 6.7 (7.0) 19.2 (8.3) F = 209.71
p < 0.001
13
Fig. 1. Cluster plot of the three cognitive subgroups created from current and premorbid IQ scores.
Cluster 1 = Relatively intact cognitive function. Cluster 2 = Intermediate cognitive function. Cluster 3 = Globally impaired cognitive
function. SZ = schizophrenia. BD = bipolar I disorder. Current IQ = Wecshler Abbreviated Scale of Intelligence. Premorbid
IQ = National Adult Reading Test.
a highly significant main effect of cluster membership neuropsychological test results, lending support to the valid-
(F = 15.8, Wilk’s Lambda = 0.43, p < 0.001, η2 = 0.35) and ity of the empirical clustering. The cluster x group interaction
a marginally significant main effect of diagnostic group effect was also significant (F = 2.0, Wilk’s Lambda = 0.88,
(F = 1.9, Wilk’s Lambda = 0.94, p = 0.049, η2 = 0.06) on p = 0.006, η2 = 0.06). See Table 2 for the premorbid
Downloaded from https://www.cambridge.org/core. IP address: 46.4.80.155, on 16 Dec 2020 at 02:22:24, subject to the Cambridge Core terms of use, available at https://www.cambridge.org/core/terms
. https://doi.org/10.1017/S1355617720000442866 A. Vaskinn et al.
(a) SZ
100%
BD
90% (27%)
BD BD
80% (46%)
(50%)
26% 70%
32% Intact
60%
Intermediate
50%
SZ
Impaired 40%
SZ (73%)
30% SZ
42% (50%) (54%)
20%
10%
0%
Intact Intermediate Impaired
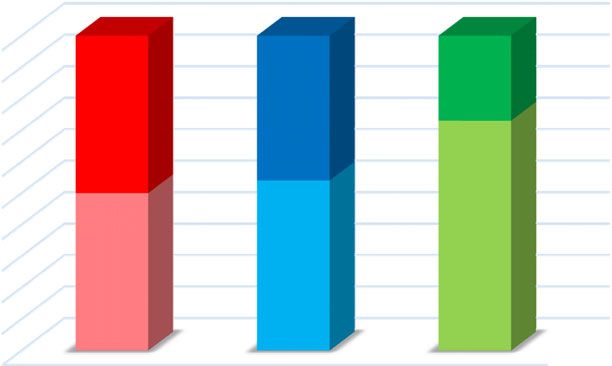
(b) BD
Fig. 3. Proportion of participants with schizophrenia and bipolar
disorder in the three cognitive clusters.
12% BD = bipolar I disorder. SZ = schizophrenia. Intact = Relatively
Intact intact cognitive function. Intermediate = Intermediate cognitive
42% function. Impaired = Globally impaired cognitive function.
Intermediate
Impaired
46% psychomotor speed, motor function, and executive function
(see Table 3 and Figure 4).
For functioning, a significant group difference appeared
for global functioning, GAF-f (relatively intact > intermedi-
Fig. 2. Distribution of participants falling into each cluster within ate > impaired), but not for SFS (see Table 4).
(a) the schizophrenia sample and (b) the bipolar I disorder sample. Finally, for psychopathology, there were significant group
BD = bipolar I disorder. SZ = schizophrenia. Intact = Relatively differences for global symptom load (GAF-s) and for positive
intact cognitive function. Intermediate = Intermediate cognitive and negative symptoms as assessed with the PANSS; with the
function. Impaired = Globally impaired cognitive function. impaired group experiencing more severe symptoms than the
other two groups. There were no differences for depressive or
NART IQ, current WASI IQ, and IQ decline for the three manic symptoms (see Table 5).
clusters, that is, cognitive subgroups.
Compared to healthy controls, the first cognitive subgroup
had normal premorbid IQ (116.2) with no decline from pre-
DISCUSSION
morbid to current IQ (relatively intact group). The second This study found that a sample consisting of individuals
cognitive subgroup had near-normal premorbid IQ (109.8) with schizophrenia or bipolar I disorder could be divided into
and a small decline (6.7 IQ points) from premorbid to current three distinct cognitive subgroups based on the intellectual
IQ (intermediate group). The third cognitive subgroup had trajectory from the premorbid phase to after illness onset:
reduced premorbid IQ (104.2) and additionally experienced a relatively intact group, an intermediate group with mild-
a substantial decline (19.2 IQ points) from premorbid to cur- moderate cognitive impairment, and a globally impaired group.
rent IQ (impaired group). The three cognitive subgroups did These groups differed in neuropsychological profile, for posi-
not differ in age or gender distribution, but had different tive and negative symptoms, and for global functioning.
length of education (relatively intact > intermediate > Our study replicates previous findings in two ways. First,
impaired). The distribution of participants from the two by identifying three distinguishable cognitive subgroups that
diagnostic categories differed significantly across clusters cut across diagnostic boundaries (Van Rheenen et al., 2017).
(x2 = 12.0, p = 0.003). There were more individuals with This suggests that the same cognitive heterogeneity is present
schizophrenia than individuals with bipolar disorder in the regardless of whether the diagnosis is schizophrenia or
impaired group (73% versus 27%), but the other two groups bipolar I disorder, although there were more individuals with
had an equal number of persons from the two diagnostic schizophrenia in the impaired cognitive subgroup. Second,
groups (intermediate group: 54% versus 46%; relatively our results confirm the existence of three different intellectual
intact group: 50% versus 50%). For the exact distribution trajectories from the premorbid phase to after illness onset in
of participants see Figure 2 (distribution of clusters within schizophrenia (Weickert et al., 2000). However, our results
each diagnostic category) and Figure 3 (distribution of diag- also differ from earlier work (Weickert et al, 2000; Van
nostic categories within each cluster). Rheenen et al., 2017), instead providing new insights. We
The cognitive subgroups differed significantly for all show that the three cognitive subgroups, across severe mental
neuropsychological tests, corrected for multiple comparisons illness, can be identified not only using neuropsychological
(relatively intact > intermediate > impaired). The relatively tests that assess current functioning (Burdick et al., 2014;
intact group performed significantly below HCs for Van Rheenen et al., 2017) but also with tests that identify
Downloaded from https://www.cambridge.org/core. IP address: 46.4.80.155, on 16 Dec 2020 at 02:22:24, subject to the Cambridge Core terms of use, available at https://www.cambridge.org/core/terms
. https://doi.org/10.1017/S1355617720000442Cognitive subgroups in severe mental illness 867
Table 3. Neuropsychological test performance (standardized scores) in healthy controls and in cognitive subgroups (with schizophrenia or
bipolar disorder)
Healthy control Cluster 1: Cluster 2: Cluster 3: Statistic
participants Intact Intermediate Impaired Between group-
n = 476 n = 145 n = 175 n = 78 comparison
Digit Span (SS) 9.5 (2.4) 9.8 (2.3) 8.0 (1.7) 6.8 (1.9) F = 50.2
p < 0.001*
ηp2 = 0.15
HC, 1 > 2 > 3
Digit Symbol (SS) 10.4 (2.5) 9.1 (2.3) 7.1 (2.1) 5.9 (1.8) F = 145.0
p < 0.001*
ηp2 = 0.33
HC > 1 > 2 > 3
Grooved Pegboard Test (T) 48.1 (8.7) 43.4 (9.9) 37.8 (10.9) 33.1 (9.9) F = 89.5
p < 0.001*
ηp2 = 0.24
HC > 1 > 2 > 3
CVLT-II learning (T) 56.5 (10.3) 55.4 (11.2) 48.9 (10.7) 41.4 (12.0) F = 58.8
p < 0.001*
ηp2 = 0.17
HC, 1 > 2 > 3
CVLT-II delayed recall (z) 0.56 (0.95) 0.36 (0.93) −0.06 (1.02) −0.87 (1.25) F = 54.3
p < 0.001*
ηp2 = 0.16
HC, 1 > 2 > 3
Logical Memory learning (SS) 10.8 (2.5) 10.9 (2.8) 8.6 (2.5) 6.8 (2.4) F = 80.2
p < 0.001*
ηp2 = 0.22
HC, 1 > 2 > 3
Rey–Oesterrith Complex 49.0 (12.9) 46.6 (14.0) 38.0 (12.8) 28.2 (15.7) F = 60.4
Figure Test (T) p < 0.001*
ηp2 = 0.20
HC, 1 > 2 > 3
Letter Number 10.9 (2.8) 10.2 (2.5) 8.2 (2.2) 6.7 (2.0) F = 73.6
Sequencing (SS) p < 0.001*
ηp2 = 0.22
HC, 1 > 2 > 3
Category Fluency (SS) 13.9 (3.1) 13.1 (3.6) 9.9 (3.4) 8.5 (3.6) F = 105.4
p < 0.001*
ηp2 = 0.27
HC > 1 > 2 > 3
Color-Word Interference Test 11.0 (2.4) 10.0 (2.6) 8.4 (3.3) 6.9 (3.8) F = 72.4
(SS) p < 0.001*
ηp2 = 0.20
HC > 1 > 2 > 3
*Significant after bonferroni correction for multiple comparisons: new p-value (0.05/10) = 0.005.
Digit Span: Cluster 3 n = 77. Digit Symbol: Cluster 2 n = 174; Cluster 3 n = 77. Grooved Pegboard: Healthy controls n = 474; Cluster 2 n = 173; Cluster
3 n = 77. CVLT-II: Healthy controls n = 475; Cluster 1 n = 144. Logical Memory: Healthy controls n = 474; Cluster 1 n = 142; Cluster 2 n = 173; Cluster 3 n
= 77. Rey–Oesterrith Complex Figure Test: Healthy controls n = 419; Cluster 1 n = 121; Cluster 2 n = 145; Cluster 3 n = 63. Letter Number Span: Healthy
controls n = 455; Cluster 1 n = 119; Cluster 2 n = 140; Cluster 3 n = 63. Category Fluency: Healthy controls n = 475. Color-Word Interference Test:
Healthy controls n = 473.
cognitive development from the premorbid phase to after spectrum disorder sample using the Wisconsin Card Sorting
illness onset. In fact, the current literature base suggests that Test to examine executive function. Our results also diverge
this tripartition does not depend on the neuropsychological from earlier studies of intellectual trajectories. Whereas
measures used (Carruthers et al., 2019a). Further support two of our empirically derived cognitive subgroups were
for this was recently provided by Carruthers et al. (2019b) characterized by a decline (intermediate: 6.7 points, impaired:
who identified three cognitive subgroups in a schizophrenia 19.2 points), this was the case only for the deteriorated group
Downloaded from https://www.cambridge.org/core. IP address: 46.4.80.155, on 16 Dec 2020 at 02:22:24, subject to the Cambridge Core terms of use, available at https://www.cambridge.org/core/terms
. https://doi.org/10.1017/S1355617720000442868 A. Vaskinn et al.
Table 4. Global and social functioning in cognitive subgroups
Cluster 1: Cluster 2: Cluster 3:
Intact Intermediate Impaired
n = 145 n = 175 n = 78 Statistic
GAF-f 49.6 (12.9) 46.7 (12.5) 42.2 (10.8) F = 9.11, p < 0.001
ηp2 = 0.04
1, 2 > 3
SFS withdrawal 102.7 (10.7) 103.9 (11.5) 101.8 (11.9)
SFS interpersonal communication 116.5 (20.0) 116.3 (19.3) 113.8 (18.8)
SFS prosocial behavior 106.3 (11.7) 104.1 (11.6) 103.4 (11.5) Wilks Lambda = 0.94
SFS recreation 110.4 (10.8) 108.9 (13.2) 105.8 (13.1) F = 1.53, p = 0.095,
SFS independence competence 109.3 (14.8) 107.1 (15.3) 105.7 (16.0) ηp2 = 0.03
SFS independence performance 109.2 (13.3) 109.6 (14.4) 104.7 (16.1)
SFS employment 108.3 (10.8) 106.4 (12.8) 105.1 (12.3)
GAF-f = Global Assessment of Functioning, function subscale. SFS = Social Functioning Scale: Cluster 1 n = 136; Cluster 2 n = 169; Cluster 3 n = 73.
HC Intact Intermediate Impaired
0.5
0
–0.5
–1
–1.5
–2
Fig. 4. Neuropsychological profile of the three cognitive subgroups: relatively intact cognitive function, intermediate cognitive function, and
globally impaired cognitive function.
CVLT = California Verbal Learning Test. RCFT = Rey–Oesterrith Complex Figure Test. LNS = Letter Number Span. Fluency = Category
Fluency. “Stroop” = Color-Word Interference Test.
(≥ 10 points) in Weickert et al’s (2000) study. The most The results of our study suggest that information regarding
obvious difference between our study and Weickert et al.’s the cognitive course from pre- to post illness onset is relevant
(2000) study is our inclusion of individuals with bipolar for the understanding of cognitive heterogeneity also in
disorder in addition to those with schizophrenia. This can, bipolar I disorder. This is, as far as we know, the first study
however, not explain the diverging premorbid/current IQ of intellectual trajectories using premorbid and current IQ
patterns, since we conducted the analyses also in the two measures in bipolar disorder. The findings of three cognitive
diagnostic groups separately. A more plausible explanation subgroups align with the existing literature indicative of sub-
for the differences in premorbid/current IQ patterns is the stantial cognitive heterogeneity in bipolar disorder. This
use of a predefined cutoff of ≥ 10 points decline in heterogeneity is seen in the U-shaped risk of the disorder,
Weickert et al.’s (2000) clinical classification criteria, where both high and low IQ increase the risk (Parellada
whereas our empirical approach had no a priori assumptions et al., 2017), and in inconsistent results regarding the pres-
of such cutoffs. Further, Weickert and colleagues (2000) used ence of neuroprogression (Sheffield et al., 2018) or cognitive
an IQ measure where both processing speed and working stability (Torres et al., 2020) over time. Whereas we found
memory were represented. We used the WASI which does some individuals with bipolar disorder to be characterized
not include these indexes. Due to these issues, a direct com- by cognitive stability, others experienced decline, some of
parison of the exact premorbid/current IQ patterns may not be them substantially. Thus, our results support the existence
entirely justified. of both cognitive stability as well as neuroprogression in
Downloaded from https://www.cambridge.org/core. IP address: 46.4.80.155, on 16 Dec 2020 at 02:22:24, subject to the Cambridge Core terms of use, available at https://www.cambridge.org/core/terms
. https://doi.org/10.1017/S1355617720000442Cognitive subgroups in severe mental illness 869
Table 5. Clinical symptoms in cognitive subgroups 2000; Carruthers et al., 2019a). We would like to suggest two
possible explanations. First, the relatively intact subgroup
Cluster 1: Cluster 2: Cluster 3: may be larger in bipolar disorder samples. For instance,
Intact Intermediate Impaired Burdick and colleagues (2014) found that 32% belonged
n = 145 n = 175 n = 78 Statistic
to the cognitively intact group. Second, the younger age of
GAF-s 50.7 (14.4) 47.6 (13.2) 42.1 (13.0) F = 10.16 our participants may have contributed to a larger proportion
p < 0.001* of the sample being allocated to the relatively intact subgroup.
ηp2 = 0.05 A cross-diagnostic study of schizophrenia and bipolar
1, 2 > 3 disorder found significant age differences between the
PANSS 12.6 (5.0) 12.8 (5.4) 15.0 (5.5) F = 6.12 relatively intact (34.0 þ 10.9 years) and the impaired (40.6 þ
positive p = 0.002*
11.2 years) cognitive subgroups (Lewandowski et al., 2014).
ηp2 = 0.03
1, 2 < 3 Our participants were younger (32 years) without differences
PANSS 12.3 (5.3) 13.6 (5.9) 16.3 (6.8) F = 11.28 between cognitive subgroups. Our speculation, therefore, is
negative p < 0.001* that the inclusion of individuals with bipolar disorder, in com-
ηp2 = 0.05 bination with the age of our sample, has contributed to the
1, 2 < 3 larger relatively intact group compared to other studies.
YMRS 4.3 (5.0) 4.4 (5.6) 5.0 (5.2) F = 0.55 Since schizophrenia is characterized by more severe
p = 0.579 cognitive impairment than bipolar disorder (Bortolato
ηp2 < 0.01 et al., 2015), the fact that there were more individuals with
IDS-C 15.1 (10.0) 16.0 (12.0) 16.3 (11.8) F = 0.33 schizophrenia than with bipolar disorder in the impaired
p = 0.722
group was expected. Interestingly, however, 32% of the
ηp2 < 0.01
schizophrenia sample belonged to the relatively intact group,
*Significant after bonferroni correction for multiple comparisons: new and the distribution of individuals with schizophrenia or with
p-value (0.05/5) = 0.01. bipolar I disorder within this cognitive cluster was even.
GAF-s = Global Assessment of Functioning, symptoms subscale. Given studies that have found good premorbid abilities to
PANSS = Positive and Negative Syndrome Scale: Cluster 1 n = 143; Cluster
2 n = 173. YMRS = Young Mania Rating Scale: Cluster 1 n = 141; Cluster be associated with bipolar disorder (Koenen et al., 2009;
2 n = 168; Cluster 3 n = 76. IDS-C = Inventory of Depressive Symptoms- MacCabe et al., 2010; Smith et al., 2015), it is not surprising
Clinician rated: Cluster 1 n = 126; Cluster 2 n = 153; Cluster 3 n = 65. that 42% of the individuals with this diagnosis belonged
to a relatively intact cognitive subgroup. But the fact that
bipolar disorder, pointing to substantial cognitive hetero- one-third of the schizophrenia sample, and just as many peo-
geneity within this disorder (Van Rheenen et al., 2020). ple with schizophrenia as with bipolar disorder, presented
Interestingly, we identified a relatively intact group with relatively intact cognition is evidence that cognitive
performing largely in line with HCs. This could be interpreted heterogeneity within schizophrenia is substantial. A diagno-
as evidence against the view that cognitive impairment is a sis of schizophrenia alone, therefore, provides little informa-
core feature of severe mental disorder (Green, Horan & tion concerning cognitive abilities at the individual level.
Lee, 2019). It should be noted, however, that this relatively Validation for the meaningfulness of the three cognitive
intact cognitive subgroup performed significantly below clusters was provided by significant group differences in
HCs for neuropsychological tests with a speeded component, positive, negative, and global symptoms and in global
that is, psychomotor speed, motor function, and executive functioning. We believe that nonsignificant differences in
function. We interpret this as evidence that even high-func- affective symptoms may be due to low symptom load as
tioning individuals with severe mental illness have some participants at our center are usually assessed in a euthymic
degree of cognitive impairment. This is in accordance with or near-euthymic state. Surprisingly, we did not identify any
previous findings that 98% of persons with schizophrenia group differences in social functioning. A possible reason is
perform worse on neuropsychological tests than expected that the self-report format of the measure used, the SFS.
from maternal education or premorbid IQ (Keefe, Eesley & Perhaps social functioning, if assessed by an observer, would
Poe, 2005) and that individuals with superior intelligence have yielded significant group differences. This would be in
and schizophrenia have neurocognitive decrements com- line with studies that have shown that many with schizophre-
pared to IQ-matched HCs (Vaskinn et al., 2014). That the nia inaccurately rate their own functioning, compared to the
worse performance appeared for neuropsychological tests ratings of case managers (Bowie et al., 2007) or interviewers
that depend on psychomotor speed is also in agreement (Sabbag et al., 2012). The allocation of a person to a specific
with the finding that this cognitive domain is more affected cognitive cluster did not depend on their age or their gender,
than others (Dickinson, Ramsey & Gold, 2007; Schaefer, as no significant differences of the distribution of these
Giangrande, Weinberger, & Dickinson, 2013). variables were found.
Our relatively intact group comprised more than a third of Our study implies that the psychiatric diagnosis that spec-
our participants with severe mental disorder. This subgroup ifies which severe mental disorder a person suffers from falls
was larger than in other schizophrenia studies where around short of providing any useful information about that person’s
25% present with relatively intact cognition (Weickert et al., neuropsychological profile. This underscores the need to
Downloaded from https://www.cambridge.org/core. IP address: 46.4.80.155, on 16 Dec 2020 at 02:22:24, subject to the Cambridge Core terms of use, available at https://www.cambridge.org/core/terms
. https://doi.org/10.1017/S1355617720000442870 A. Vaskinn et al.
conduct a neuropsychological examination as part of struc- patients and their first-degree relatives. Psychological Medicine,
tured assessment. This is especially important since neuro- 38, 771–785.
psychological status has been found to impact functioning Baune, B.T. & Malhi, G.S. (2015). A review of the impact of
in both schizophrenia (Green et al., 2004) and in bipolar dis- cognitive dysfunction on social, occupational, an general
order (Baune & Malhi, 2015). functional outcomes in bipolar disorder. Bipolar Disorders, 17-
(suppl.2), 41–55.
Among the limitations of the study is the relatively
Birchwood, M., Smith, J., Cochrane, R., Wetton, S., & Copestake, S.
high mean IQ of our participants, both HCs and participants (1994). The Social Functioning Scale: the development and
with clinical diagnoses. The WASI IQs are higher than in validation of a new measure of social adjustment for the use in
studies from other countries and contexts. An evaluation of family intervention programs with schizophrenic patients.
the Norwegian WASI, which uses US norms, concluded British Journal of Psychiatry, 157, 853–859.
that it probably overestimates IQ (Siqveland et al., 2014). Bora, E., Yucel, M., & Pantelis, C. (2009). Cognitive endopheno-
Therefore, we believe that the high WASI IQ is likely a result types of bipolar disorder: a meta-analysis of neuropsychological
of the properties of the test and the standardization of it, not deficits in euthymic patients and their first-degree relatives.
that our participants in fact have cognitive skills above Journal of Affective Disorders, 113, 1–20.
the population average. The mean scores of our HCs for Bora, E. (2015). Developmental trajectory of cognitive impairment
the neuropsychological tests indicate that this is the case. in bipolar disorder: comparison with schizophrenia. European
Neuropsychopharmacology, 25, 158–168.
As can be seen in Table 4, the HCs perform very close to
Bortolato, B., Miskowiak, K.W., Köhler, C.A., Vieta, E., Carvalho,
the standardized means. Finally, assessment of premorbid A.F. (2015). Cognitive dysfunction in bipolar disorder and
functioning using retrospective measures such as the schizophrenia: a systematic review of meta-analyses.
NART has some degree of uncertainty compared to assess- Neuropsychiatric Disease and Treatment, 11, 3111–3125.
ment conducted concurrently prior to illness onset. Bowie, C.R., Twamley, E.W., Anderson, H., Halpern, B., Patterson,
In conclusion, three cognitive subgroups resulted from T.L, & Harvey, P.D. (2007). Self-assessment of functional status in
cluster analysis of test performance on measures of premorbid schizophrenia. Journal of Psychiatric Research, 41, 1012–1018.
and current intelligence in a combined sample of individuals Burdick, K.E., Russo, M., Frangou, S., Mahon, K., Braga, R.J.,
with schizophrenia or bipolar I disorder. Differences in Shanahan, M., & Malhotra, A.K. (2014). Empirical evidence
neuropsychological functioning, symptom level, and global for discrete neurocognitive subgroups in bipolar disorder: clinical
functioning between the groups of relatively intact, inter- implications. Psychological Medicine, 44, 3083–3096.
Calinski, T. & Harabasz, J. (1974). A dendrite method for cluster
mediate, and globally impaired cognition suggest that these
analysis. Communications in Statistics, 3, 1–27.
are meaningful and valid groups. The fact that they cut across Carruthers, S.P, Van Rheenen, T.E., Gurvich, C., Sumner, P.J., &
diagnostic categories underscores the need to move beyond Rossell, S.L. (2019a). Characterising the structure of cognitive
the diagnosis when planning treatment interventions and in heterogeneity in schizophrenia spectrum disorders: a systematic
scientific studies of their possible etiological and pathophy- review and narrative synthesis. Neuroscience and Biobehavioral
siological underpinnings. Reviews, 107, 252–278.
Carruthers, S.P., Gurvich, C.T., Meyer, D., Australian Research
Bank, Bousman, C., Everall, I.P., : : : Rossell, S.L. (2019b).
ACKNOWLEDGMENTS
Exploring heterogeneity on the Wisconsin Card Sorting Test in schizo-
This work was supported by The Southern & Eastern Norway phrenia spectrum disorders: a cluster analytic investigation. Journal
Regional Health Authority (A.V. grant numbers 2010007, of the International Neuropsychological Society, 25, 750–760.
2017069) and The Research Council of Norway (grant number Delis, D., Kaplan, E., & Kramer, J.H. (2005). Delis-Kaplan
223273). The authors wish to thank Linn Sofie Sæther for her Executive Function System: Examiner’s Manual. Stockholm:
help in creating the figures and extend their gratitude to the par- Pearson Assessment.
Delis, D., Kramer, J.H., Kaplan, E., & Ober, B.A. (2004). California
ticipants for contributing their time to research and to research
Verbal Learning Test: CVLT-II. Stockholm: Pearson Assessment.
personnel for conducting the clinical and neuropsychological Demmo, C., Lagerberg, T.V., Kvitland, L.R., Aminoff, S.R.,
assessments. Hellvin, T., Simonsen, C., : : : Ueland, T. (2018). Neuro-
cognitive functioning, clinical course and functional outcome
CONFLICT OF INTEREST in first-treatment bipolar I disorder patients with and without
clinical relapse: a 1-year follow-up study. Bipolar Disorders,
The authors have nothing to disclose. 20, 228–237.
Dickinson, D., Ramsey, M.E., & Gold, J.M. (2007). Overlooking the
SUPPLEMENTARY MATERIAL obvious: a meta-analytic comparison of digit symbol coding tasks
and other cognitive measures in schizophrenia. Archives of
To view supplementary material for this article, please visit General Psychiatry, 64, 533–542.
https://doi.org/10.1017/S1355617720000442 First, M., Spitzer, R., Gibbon, M., & Williams, J. (1995). Structured
clinical interview for DSM-IV Axis I disorders, patient edition
(SCID-P), version 2. New York: New York State Psychiatric
REFERENCES Institute, Biometrics Research.
Arts, B., Jabben, N., Krabbendam, L., & van Os, J. (2008). Green, M.F., Kern, R.S., & Heaton, R.K. (2004). Longitudinal
Meta-analyses of cognitive functioning in euthymic bipolar studies of cognition and functional outcome in schizophrenia:
Downloaded from https://www.cambridge.org/core. IP address: 46.4.80.155, on 16 Dec 2020 at 02:22:24, subject to the Cambridge Core terms of use, available at https://www.cambridge.org/core/terms
. https://doi.org/10.1017/S1355617720000442Cognitive subgroups in severe mental illness 871
implications for MATRICS. Schizophrenia Research, 72, Pedersen, G., Hagtvedt, K.A., & Karterud, S. (2007).
41–51. Generalizability studies of the global assessment of function-
Green, M.F., Horan, W.P., & Lee, J. (2019). Nonsocial and ing-split version. Comprehensive Psychiatry, 48, 88–94.
social cognition in schizophrenia: current evidence and future Rush, A.J., Guillon, C.M., Basco, M.R., Jarrett, R.B., & Trivedi, M.H.
directions. World Psychiatry, 18, 146–161. (1996). The Inventory of Depressive Symptomatology (IDS):
Hellvin, T., Sundet, K., Vaskinn, A., Simonsen, C., Ueland, T., psychometric properties. Psychological Medicine, 26, 477–486.
Andreassen, O.A., & Melle, I. (2010). Validation of the Sabbag, S., Twamley, E.W., Vella, L., Heaton, R.K., Patterson, T.L., &
Norwegian version of the Social Functioning Scale for schizophre- Harvey, P.D. (2012). Predictors of the accuracy of self assessment of
nia and bipolar disorder. Scandinavian Journal of Psychology, 51, everyday functioning in people with schizophrenia. Schizophrenia
525–533. Research, 137, 190–195.
Jensen, J.H., Knorr, U., Vinberg, M., Kessing, L.V., & Miskowiak, Schaefer, J, Giangrande, E., Weinberger, D.R., & Dickinson, D.
K.W. (2016). Discrete neurocognitive subgroups in fully or (2013). The global cognitive impairment in schizophrenia:
partially remitted bipolar disorder: associations with functional consistent over decades and around the world. Schizophrenia
abilities. Journal of Affective Disorders, 205, 378–386. Research, 150, 42–50.
Kahn, R.S. & Keefe, R.S. (2013). Schizophrenia is a cognitive illness: Sheffield, J.M., Karcher, N.R., & Barch, D.M. (2018). Cognitive
time for a change in focus. JAMA Psychiatry, 70, 1107–1112. deficits in psychotic disorders: a lifespan perspective. Neuro-
Kay, S.R., Fiszbein, A., & Opler, L.A. (1987). The positive and neg- psychology Review, 28, 509–533.
ative syndrome scale (PANSS) for schizophrenia. Schizophrenia Siqveland, J., Dalsbø, T.K., Harboe, I., & Leiknes, K.A. (2014).
Bulletin, 13, 261–276. Psychometric Evaluation of the Norwegian Version of the
Keefe, R.S., Eesley, C.E., & Poe, M.P. (2005). Defining a cognitive Wechsler Abbreviated Scale of Intelligence. Oslo, Norway:
function decrement in schizophrenia. Biological Psychiatry, 57, Norwegian Knowledge Center for the Health Services.
688–391. Smith, D.J., Amderson, J., Zammit, S., Meyer, T.D., Pell, J.P., &
Kendler, K.S., Ohlsson, H., Sundquist, J., & Sundquist, K. (2015). Mackay, D. (2015). Childhood IQ and risk of bipolar disorder
IQ and schizophrenia in a Swedish national sample: their causal in adulthood: Prospective birth cohort study. The British Journal
relationship and the interaction of IQ with genetic risk. American of Psychiatry Open, 1, 74–80.
Journal of Psychiatry, 172, 259–265. Sundet, K. & Vaskinn, A. (2008). Estimating premorbid IQ (in
Khandaker, G.M., Barnett, J.H., White, I.R., & Jones, P.B. (2011). A Norwegian with English abstract). Journal of the Norwegian
quantitative meta-analysis of population-based studies of premor- Psychological Association, 45, 1108–1115.
bid intelligence and schizophrenia. Schizophrenia Research, 132, Tiihonen, J., Haukka, J., Henriksson, M., Cannon, M., Kieseppä, T.,
220–227. : : : Lönnqvist, J. (2005). Premorbid intellectual functioning in
Kløve, H. (1963). Clinical neuropsychology. Medical Clinics of bipolar disorder and schizophrenia: results from a cohort study of
North America, 47, 1647–1658. male conscripts. American Journal of Psychiatry, 162, 1904–1910.
Koenen, K.C., Moffitt, T.E., Roberts, A.L., Martin, L.T., Tohen, M., Frank, E., Bowden, C.L., Colom, F., Ghaemi, S.N.,
Kubzansky, L., Harrington, H., & Caspi, A. (2009). Childhood Yatham, L.N., : : : Berk, M. (2009). The International Society
IQ and adult mental disorders: a test of the cognitive reserve for Bipolar Disorders (ISBD) Task Force report on the nomenclature
hypothesis. American Journal of Psychiatry, 166, 50–57. of course and outcome in bipolar disorders. Bipolar Disorders, 11,
Lewandowski, K.E., Sperry, S.H., Cohen, B.M., Öngur, D. 453–473.
(2014). Cognitive variability in psychotic disorders: a Torres, I.J., Qian, H., Basivireddy, J., Chakrabarty, T.,
cross-diagnostic cluster analysis. Psychological Medicine, Wong, H., Lam, R.W., & Yatham, L.N. (2020). Three-year
44, 3239–3248. longitudinal cognitive function in patients recently diagnosed with
Lewandowski, K.E., Baker, J.T., McCarthy, J.M., Norris, L.A., & bipolar disorder. Acta Psychiatrica Scandinavica, 141, 98–109.
Öngur, D. (2018). Reproducibility of cognitive profiles using cluster Trotta, A., Murray, R.M, & MacCabe, J.H. (2015). Do premorbid
analysis. Journal of the International Neuropsychological Society, and post-onset cognitive functioning differ between schizophre-
24, 382–390. nia and bipolar disorder? A systematic review and meta-analysis.
MacCabe, J.H., Lambe, M.P, Cnattingius, S., Sham, P.C, Psychological Medicine, 45, 381–394.
David, A.S., Reichenberg, A., : : : Hultman, C.E. (2010). Van Rheenen, T.E., Lewandowski, K.E., Tan, E.J., Ospina, L.H.,
Excellent school performance at age 16 and risk of adult bipolar Ongur, D., Neill, E., : : : Burdick, K.E. (2017). Characterizing
disorder. British Journal of Psychiatry, 196, 109–115. cognitive heterogeneity on the schizophrenia-bipolar disorder
Menkes, M.W., Armstrong, K., Balckford, J.U., Heckers, S., & spectrum. Psychological Medicine, 47, 1848–1864.
Woodward, N.D. (2019). Neuropsychological functioning in Van Rheenen, T.E., Cropley, V., Zalesky, A., Bousman, C.,
early and chronic stages of schizophrenia and psychotic bipolar Wells, R., Bruggemann, J., : : : Pantelis, C. (2018). Widespread
disorder. Schizophrenia Research, 206, 413–419. volumetric reductions in schizophrenia and schizoaffective patients
Meyers, J.E. & Meyers, K.R. (1995). Rey Complex Figure Test displaying compromised cognitive abilities. Schizophrenia Bulletin,
and Recognition Trial. Odessa, FL: Psychological Assessment 44, 560–574.
Resources. Van Rheenen, T.E., Lewandowski, K.E., Bauer, I.E., Kapczinski, F.,
Milligan, G.W. & Cooper, M.C. (1985). An examination of Miskowiak, K., Burdick, K.E., & Balanzá-Martìnez, V. (2020).
procedures for determining the number of clusters in a data set. Current understandings of the trajectory end emerging correlates
Psykometrika, 50, 159–179. of cognitive impairment in bipolar disorder: an overview of evi-
Parellada, M., Gomez-Vallejo, S., Burdeus, M., & Arango, C. dence. Bipolar Disorders, 22, 13–27.
(2017). Developmental differences between schizophrenia and Vaskinn, A., Ueland, T., Melle, I., Agartz, I., Andreassen, O.A., &
bipolar disorder. Schizophrenia Bulletin, 43, 1176–1189. Sundet, K. (2014). Neurocognitive decrements are present
Downloaded from https://www.cambridge.org/core. IP address: 46.4.80.155, on 16 Dec 2020 at 02:22:24, subject to the Cambridge Core terms of use, available at https://www.cambridge.org/core/terms
. https://doi.org/10.1017/S1355617720000442You can also read