Combining Associations Between Emotional Intelligence, Work Motivation, and Organizational Justice With Counterproductive Work Behavior: A Profile ...
←
→
Page content transcription
If your browser does not render page correctly, please read the page content below
ORIGINAL RESEARCH
                                                                                                                                            published: 19 May 2020
                                                                                                                                    doi: 10.3389/fpsyg.2020.00851

                                            Combining Associations Between
                                            Emotional Intelligence, Work
                                            Motivation, and Organizational
                                            Justice With Counterproductive
                                            Work Behavior: A Profile Analysis via
                                            Multidimensional Scaling (PAMS)
                        Edited by:
                    Renato Pisanti,
      Niccolò Cusano University, Italy
                                            Approach
                       Reviewed by:         Aharon Tziner 1,2* , Erich C. Fein 3* , Se-Kang Kim 4 , Cristinel Vasiliu 5 and Or Shkoler 2
               Valentina Sommovigo,
                                            1
              University of Pavia, Italy     Peres Academic Center, Rehovot, Israel, 2 Netanya Academic College, Netanya, Israel, 3 School of Psychology and
                      Arun Aggarwal,        Counselling, University of Southern Queensland, Toowoomba, QLD, Australia, 4 Department of Psychology, Fordham
             Chitkara University, India     University, New York, NY, United States, 5 Academia de Studii Economice din Bucuresti, Bucharest, Romania
                           Amit Mittal,
             Chitkara University, India
                                            The need for better incorporation of the construct emotional intelligence (EI) into
                  *Correspondence:
                         Aharon Tziner      counterproductive work behavior (CWB) research may be achieved via a unified
                 aetziner@gmail.com;        conceptual framework. Accordingly, the purpose of this paper is to use the Profile
                 atziner@netanya.ac.il
                          Erich C. Fein
                                            Analysis via Multidimensional Scaling (PAMS) approach, and a conceptual framework
                erich.fein@usq.edu.au       that unifies motivational process with antecedents and outcomes, to assess differences
                                            in EI concerning a variety of constructs: organizational justice, CWB, emotional
                   Specialty section:
         This article was submitted to      exhaustion, job satisfaction, and intrinsic motivation. Employing established scales
          Organizational Psychology,        within a framework unifying CWB, intrinsic motivation, EI, organizational justice, and
               a section of the journal
                                            outcome constructs, two EI-based profiles displayed associations with CWB based
               Frontiers in Psychology
                                            on responses from 3,293 employees. Both the first core profile, high overall justice
         Received: 05 October 2019
           Accepted: 06 April 2020          and low emotional intelligence, and the second core profile, high emotional intelligence
           Published: 19 May 2020           and low work motivation, displayed associations with interpersonal deviance and
                              Citation:     organizational deviance, as well as emotional exhaustion and job satisfaction. The results
           Tziner A, Fein EC, Kim S-K,
       Vasiliu C and Shkoler O (2020)       are discussed with respect to possible underlying theory and an overarching unified
    Combining Associations Between          motivation framework that incorporates goal choice, intrinsic motivation, antecedents,
          Emotional Intelligence, Work
                                            and outcomes. We also provide directions for future research and implications for
Motivation, and Organizational Justice
        With Counterproductive Work         managers in the workplace based on heuristic conceptual frameworks that combine
       Behavior: A Profile Analysis via     multiple motivational perspectives into a unified model.
     Multidimensional Scaling (PAMS)
  Approach. Front. Psychol. 11:851.         Keywords: emotional intelligence, counterproductive work behavior, organizational deviance, profile analysis,
     doi: 10.3389/fpsyg.2020.00851          multidimensional scaling, emotional exhaustion, job satisfaction, organizational justice

Frontiers in Psychology | www.frontiersin.org                                    1                                               May 2020 | Volume 11 | Article 851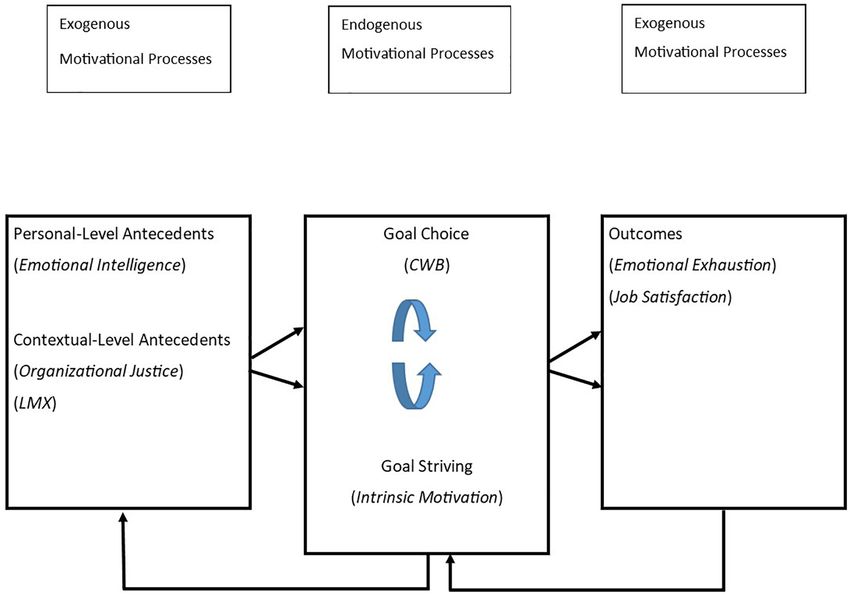
Tziner et al.                                                                                              Profile Analysis via Multidimensional Scaling

INTRODUCTION                                                               (Dalal, 2005; Miao et al., 2017), the stability of this relationship
                                                                           bears further consideration because nuanced contextual factors
A current gap in the literature concerning counterproductive               can change the strength of this relationship. For example, the
work behavior (CWB) is how to incorporate an increased range               effect of EI on OCB is stronger in settings that require and likely
of individual differences, including emotional intelligence (EI),          habituate employees to engage in emotional labor, such as service
into the network of associations surrounding CWB (Penney                   and health care settings (Miao et al., 2017).
and Spector, 2005; Bolton et al., 2010; Ones, 2018). This gap is               It would be appropriate, therefore, to use workplace
significant because of the recognized role of individual differences       sensitivities, such as justice perceptions, to help explain variations
in the overall nomological network that underpins the motivation           in relationships between traits such as EI and processes such
of behavior at work (Yau and Sculli, 1990; Colquitt et al.,                as CWB, with the help of frameworks uniting individual
2011; Budnick et al., 2020). For example, EI has been shown                and contextual differences with types of motivation and goal
to be a critical antecedent of work outcomes (Kashif et al.,               constructs and relevant work outcomes.
2017; Klein et al., 2020), and a critical mediating factor for                 The need for better incorporation of the construct emotional
emotional regulation (Newman et al., 2010; Cheung and Tang,                intelligence (EI) into CWB research may be achieved via a unified
2012). In addition, as CWB has continued to generate extensive             conceptual framework. Accordingly, the purpose of this paper is
research in the organizational literature, failure in emotional            to use the Profile Analysis via Multidimensional Scaling (PAMS)
regulation has been increasingly traced to associations with CWB           approach, a conceptual framework that unifies motivational
(Bragg and Bowling, 2018).                                                 process with antecedents and outcomes, to assess differences in EI
    Understanding EI and its associations with emotional                   concerning a variety of constructs: organizational justice, CWB,
regulation and CWB is critical for managers when staffing                  emotional exhaustion, job satisfaction, and intrinsic motivation.
and assessing personnel because they are related to essential              Within a framework unifying CWB, intrinsic motivation, EI,
organizational outcomes such as work quality (Bragg and                    organizational justice, and outcome constructs and employing
Bowling, 2018). However, to comprehend fully the context in                established scales, two EI-based profiles displayed associations
which EI operates, it is necessary to use networks of attitudes            with CWB based on responses from 3,293 employees.
and personal states such as the experience of meaningful work                  However, what is often lacking in the organizational
(Simonet and Castille, 2020). In essence, researchers must                 psychology literature is research conducted within a unified
bridge conceptual frameworks at separate levels by examining               conceptual framework that connects goal choice and goal-
goal choice and goal-striving and engagement in conjunction                striving perspectives to intrinsic work motivation and personal
with models of personality and contextual antecedents (Tisu                and contextual-level antecedents. This lack relates to a critical
et al., 2020). Within the research presented in this paper, we             problem within the work motivation literature, which is that
focus accordingly on connections between EI, CWB, and a                    motivational phenomena are studied within multiple theoretical
delimited, parsimonious set of attitudes, namely, perceptions              frameworks (e.g., goal choice, goal-striving) that are generally
of organizational justice and job satisfaction, and the dynamic            operationalized in isolation (Van den Broeck et al., 2019).
personal states of leader-member exchange (LMX), work                      Consequently, in this paper, we employ a recent integrative
motivation, and emotional exhaustion. These attitudes and                  motivational framework (Van den Broeck et al., 2019) as a
personal states have been shown to explain consistently large              heuristic to understand and operationalize interrelations between
amounts of variability in critical work outcomes such as                   goal content, intrinsic motivation, personal and contextual-level
turnover (Wright and Cropanzano, 1998; Bernerth and Walker,                antecedents, and important work outcomes. Employing this
2012); job performance (Wang et al., 2010), and burnout                    framework, we model (a) CWB within goal choice processes
(Faragher et al., 2013).                                                   and intrinsic motivation within goal-striving processes, (b)
    Therefore, it would be important, for example, for staffing            organizational justice and EI as antecedents to goal content
managers to realize that perceived organizational injustice is a           and intrinsic motivation, and (c) emotional exhaustion and job
key driver of workplace misbehavior (Everton et al., 2007) and             satisfaction as outcomes.
that this effect may be enhanced by incorporating the particularly             Specifically, the central purpose of this research is to
relevant individual difference construct of EI. We might further           investigate how (a) a representative individual difference
note the centrality of perceptions of fairness and justice to well-        (EI), (b) two critical contextually related perception variables
being at work (Johnston et al., 2016) and the strong and persistent        (organizational justice and LMX), and (c) a contextually related
meta-analytic evidence of the predominant contribution of                  motivational state (intrinsic motivation) can model differences in
justice as a critical antecedent to job satisfaction and performance       (d) CWB and (e1) a core positive work outcome (job satisfaction)
(Cohen-Charash and Spector, 2001; Viswesvaran and Ones, 2002;              and (e2) a core negative work outcome (emotional exhaustion).
Tziner et al., 2011).                                                      Thus, using EI, organizational justice, LMX, and intrinsic
    Accordingly, it is important that future research goes                 motivation, as input variables, we wished to examine associations
further in examining work context variability, and differences             with CWB, job satisfaction, and emotional exhaustion. As the
in contextually related perceptions, as significant influences             key organizing framework for our study, we present in Figure 1,
in critical work outcomes. For example, despite a general                  an adaption of the unified conceptual framework of Van den
consensus in the literature that indicates that there is generally         Broeck et al. (2019), which is centered on goal choice and
a consistent, negative relationship between EI and CWB                     goal content.

Frontiers in Psychology | www.frontiersin.org                          2                                           May 2020 | Volume 11 | Article 851
Tziner et al. Profile Analysis via Multidimensional Scaling FIGURE 1 | Conceptual framework unifying goal choice and goal striving with personal and contextual antecedents and outcomes. Figure based on a complex model from Van den Broeck et al. (2019). Goal choice describes the selection of one or more goals with a In the next section, we articulate the importance of four particular type of content that is valued by the individual, along critical constructs – EI, work motivation, organizational justice, with the selection of the person’s higher-level objectives within and CWB – that are focal to our investigation. Additionally, we personal hierarchies that reflect personal values based on the highlight research pertinent to the related constructs of LMX, job achievement of complex and long-range goals (Van den Broeck satisfaction, and emotional exhaustion. et al., 2019). At lower levels of personal hierarchies, multiple action-oriented objectives serve to advance the achievement of the higher-level goals. For example, a person may have set CRITICAL CONSTRUCTS a goal of increasing feelings of mastery by applying newly acquired knowledge and skill in the workplace. However, to Emotional Intelligence accomplish this goal, the individual must first accomplish the Personality traits and individual differences in ability, such lower-level goal of acquiring supervisor support for training as EI, can have important associations with organizational transfer (Zumrah et al., 2012). stressors and CWB (e.g., Bowling and Eschleman, 2010; The term goal striving refers to the individual allocation Dixit and Singh, 2019). In addition, researchers have of cognitive and behavioral effort toward achieving goals demonstrated that levels of EI in key staff are significant within personal hierarchies. With respect to higher-level goals, personal factors related to the success and productivity individuals often strive to achieve these goals through lower- of organizations (e.g., Newman et al., 2010; Karimi et al., level goal attainment, such as in the above example of acquiring 2020). In that context, EI may be defined as the ability to supervisor support for training transfer. Accordingly, goal choice recognize and also monitor one’s own and other people’s and goal striving are phenomena embedded within hierarchies emotions, to understand feelings, and subsequently to of goals, and these concepts are modeled within the endogenous use emotional information to guide thinking and adapt motivational processes section of Figure 1, adapted from behavior to suit the environment (Furnham and Taylor, 2020; Van den Broeck et al. (2019). Robinson et al., 2020). Frontiers in Psychology | www.frontiersin.org 3 May 2020 | Volume 11 | Article 851
Tziner et al.                                                                                              Profile Analysis via Multidimensional Scaling

   Regulation of the emotions helps employees to maintain                   an individual’s being, to initiate work-related behavior and to
“positive affect,” a positive outlook that influences work behaviors        determine its form, direction, intensity, and duration.”
favorably (Newman et al., 2010); additionally, the regulation                  Intrinsic motivation occurs when individuals engage in
also restrains “negative affect” (Cheung and Tang, 2012).                   goal striving because goal-pursuit activities are psychologically
Hence, employees with high EI have the tools to regulate                    rewarding in themselves without links to external rewards
their emotions and to cope with adversities, and they tend to               (Ryan and Deci, 2017). Because those goal-pursuit activities are
create emotional and behavioral balance by utilizing self-control           centered in the organizational environment, it follows that this
and self-regulation (Mayer et al., 2008). However, because EI               type of work motivation (as well as other extrinsic types of
incorporates both trait and state-based characteristics, we use EI          motivation) results from the interaction between an individual’s
as a critical component within the PASM model.                              characteristics and the external environment (Latham and
   Related to the study of EI and emotional regulation,                     Pinder, 2005), which we illustrate in the components of Figure 1.
researchers suggest there are numerous opportunities for                    Research indicates that although compared to the intrinsic
integrating justice, CWB, and job performance through the                   nature of goal-striving tasks and rewards in the external
integration of social exchange, affect states and processes,                environment, individual difference characteristics may carry
and emotional regulation (Colquitt et al., 2013). In general,               less weight in determining motivation, they are still critical
negative affect shows negative associations with justice, while             components of determining the worth of outcomes because they
positive affect shows positive associations with justice (Colquitt          are always active in determining motivation (Klein and Fein,
et al., 2013). Based on these meta-analytic relationships, a clear          2005; Fein and Klein, 2011).
direction for future research is to test the roles of positive                 Intrinsic and extrinsic motivation are also key factors strongly
and negative affect and emotional regulation as mediators                   related to goal content (Ryan and Deci, 2017). Goal content
between justice and performance, and justice and CWB                        may reflect some mixture of intrinsic content, where behavior is
(Colquitt et al., 2013).                                                    pursued for the sake of engagement with an activity itself, and
   At work, individuals with high EI often experience a high level          extrinsic content, which signals goals are pursued for the sake of
of control, low levels of stress, and high levels of satisfaction and       external rewards. The literature strongly supports that intrinsic
commitment to their work (Petrides and Furnham, 2006). High-                and extrinsic elements of goal content are differentially related
EI individuals are also less prone to emotional exhaustion and              to well-being outcomes, with intrinsic goals as antecedents of
burnout and are more likely to perform their jobs successfully.             well-being (Dittmar et al., 2014).
In the light of these positive attributes, and the associations                Organizational justice is a state-based perception defined as
articulated in Figure 1, we suggest that emotional intelligence             the extent to which employees think or feel they are provided
also relieves frustration. Thus, for example, when employees are            with appropriate, fair, and respectful treatment, adequate and
faced with demotivating factors such as perceived injustice and             accurate information, and reasonable resources and rewards
symptoms of burnout, high-EI employees are less likely to turn              (Cohen-Charash and Spector, 2001; Colquitt et al., 2001). These
to work misbehaviors. Furthermore, based on the integrative                 perceptions are a product of organizational occurrences and
framework articulated in Figure 1, we expect that EI will also              systems, often based on specific “organizational components,”
relate to higher positive work outcomes such as job satisfaction.           such as leaders and co-workers (Hollensbe et al., 2008). Typically,
This anticipated association accords with research that indicates           organizational justice as an overall construct can be broken
that leaders’ EI is significantly and positively associated with            down into three facets, namely, distributive justice (fairness
subordinate’s jobs, and that suggests that high EI leaders can serve        associated with decision outcomes and distribution of resources),
as “mood managers” within organizations (Miao et al., 2016).                procedural justice (fairness of the processes leading to outcomes),
                                                                            and interactional justice (the treatment an individual receives
                                                                            as decisions are made) (for further reading, see Niehoff and
Intrinsic Work Motivation and                                               Moorman, 1993; Cohen-Charash and Spector, 2001; Colquitt
Organizational Justice                                                      et al., 2001). In the present study, we incorporated all three
Another variable we investigated regarding the predictor–                   components to account for the full range of the justice construct.
outcome relationship articulated in Figure 1 is intrinsic work                 Equity theory is the most important organizing principle
motivation. In general, work motivation is defined as the                   surrounding the justice–motivation relationship (Adams, 1965).
psychological force that generates complex cycles of goal-directed          Namely, equity theory supposes that if employees experience
thought and behavior (Tziner et al., 2012). Motivation is what              some type of imbalance between their personal, perceived inputs
animates individuals to persist in courses of action until the              into the workplace system, relative to their benefits received from
acts are completed (Pinder, 2014). Accordingly, scholars studying           the work system and structures, they will experience an adverse
work motivation attempt to articulate the processes by which                emotional state (due to perceived injustice, in this instance),
an individual’s internal, psychological forces – in conjunction             and they will likely aspire to regain and maintain balance
with external, environmental forces – determine the direction,              through some form of corrective behavior (Adams, 1965). In
intensity, and persistence of personal behavior aimed at goal               the case of experiencing organizational injustice, employees
attainment (Kanfer et al., 2017). Pinder (2014, p. 11) provides an          have been found to reduce their motivation and performance
alternative definition of work motivation as “a set of energetic            (Cohen-Charash and Spector, 2001; Viswesvaran and Ones,
forces that originate within individuals, as well as beyond                 2002). Moreover, the tenets of social exchange theory (SET) logic

Frontiers in Psychology | www.frontiersin.org                           4                                          May 2020 | Volume 11 | Article 851
Tziner et al. Profile Analysis via Multidimensional Scaling
(Blau, 1986; see also Cole et al., 2002), suggest that lowering one’s (Chernyak-Hai and Tziner, 2014). This is consistent with
motivation would appear to be a reasonable measure by which to the notion that if employees experience aversion and imbalance
address such imbalance. (due to perceived injustice, in this instance), they will likely
It is clear that all sub-types of justice show positive associations aspire to regain and maintain balance (Adams, 1965).
with OCB, whether targeted to the organization or supervisor Moreover, following the logic of SET, work misbehaviors
(Colquitt et al., 2013). This same meta-analytic evidence suggests would appear to be a reasonable measure by which to achieve
that all sub-types of justice are negatively related to CWB, and that balance (Blau, 1986).
in general the focus of CWB on organization or supervisor We also note that constructs that are antecedents to CWB
does not result in a difference in effect size (Colquitt et al., may also serve as antecedents to Organizational Citizenship
2013). Trust, which is a crucial element within positive LMX Behavior (OCB). In fact, the antecedents for OCB and CWB
and overall LMX quality, is also associated with higher levels are very similar and should be related in opposing directions to
of justice across all sub-types of justice (Colquitt et al., 2013). job satisfaction, commitment, and justice (Dalal, 2005). Finally,
Thus, trust and LMX appear as key moderators of the justice- concerning EI and its concordance with emotional regulation,
OCB relationship. Based on the integrative model presented and consistency with the mood regulation literature, both OCB
in Figure 1, we expect intrinsic motivation and organizational and CWB can be considered adaptions – whereby the adaptive
justice to be inversely related to CWB. behaviors are meant to provide enhanced mood or satisfaction in
the future (Dalal, 2005). Thus, such adaptions inherent in OCB
Counterproductive Work Behavior (CWB) and CWB may be geared toward the same goal of changing affect.
In recent years, CWB has gained much research attention because To increase our understanding of the nomological network
it has been shown to have important economic, sociological, around profiles of EI, work motivation, and justice, in the present
and psychological implications in the workplace, including study, we model CWB within the goal content component
associations with unethical leader behavior (Bodankin and of Figure 1. Base on contingent relationships between CWB
Tziner, 2009; Ho, 2012; Nei et al., 2018). Such dysfunctional and other variables, as illustrated in Figure 1, we also decided
behaviors include theft, sabotage, withdrawal, and harassment, to include three other critical constructs, described in the
among others (Bennett and Robinson, 2000; Spector et al., organizational psychology literature, that have been strongly
2006). CWB almost invariably violates important organizational associated with EI, namely, work motivation, justice, and CWB.
norms and harms organizations in ways associated with the These constructs are (a) leader-member exchange (LMX), which
organization’s goals, employees, procedures, productivity, and has been linked to CWB (Chernyak-Hai and Tziner, 2014); (b)
profitability (Spector et al., 2006). These behaviors may be job satisfaction, which has been associated with perceptions of
directed against the organization itself or against its members, organizational justice (Pignata et al., 2016); and (c) burnout (via
workers, and management alike, and hence they are costly emotional exhaustion), which is associated with a negative impact
to both individuals and organizations (Bennett and Robinson, on employees’ attitudes toward work and work performance
2000). Specific types of CWB include acting on negative feelings (Maslach et al., 2001) as well as rates of employee turnover
toward the organization via decreased motivation; manifesting (Wright and Cropanzano, 1998; Urien Angulo and Osca, 2012).
distrust (toward the workplace and/or the managers); and even
acting against the organization (Skarlicki and Folger, 1997). Leader–Member Exchange (LMX)
It makes sense that dysfunctional attitudes and behaviors of The underlying proposition underlying LMX theory is that
this nature are indicants of lack of job satisfaction, thus managers tend to employ different management styles for each
leading researchers in the field to hypothesize that work of their subordinates (Graen and Uhl-Bien, 1995; see also
misbehavior is negatively associated with job satisfaction Waismel-Manor et al., 2010). In turn, each specific relationship
(e.g., Malhotra and Kathuria, 2017). and corresponding management style induces corresponding
While most research has been conducted within the differential responses and attitudes in subordinates, including
framework of goal content that benefits organizations, it is also different types of engagement (Aggarwal et al., 2020) and
appropriate to envision a type of negative goal content relative performance behaviors (Ilies et al., 2007). Capitalizing on
to organizational interests. Because CWB is considered to be an reciprocity theory (Gouldner, 1960), employees in good or bad
intentional behavior that is detrimental to organization interests, relationships with their managers (i.e., with high or low LMX)
it could reflect a type of goal construct related to employee will feel obliged or reluctant to reciprocate these respective
attempts to change their affective state within an organization relationships (see also Adams, 1965).
(Dalal, 2005), which accords with evidence linking aggressive Thus, high- or low-quality LMX results in correspondingly
behaviors to attempts to change affective states (Bushman et al., high or low levels of mutual trust, respect, and commitment.
2001; Spector and Fox, 2002). This is consistent with several Accordingly, subordinates with high LMX relations are likely
observations that the desire to change or maintain emotional to receive more rewards (both formal and informal) than
states may serve as a common antecedent to both CWB and OCB their colleagues with lower LMX relations. These benefits
(Spector and Fox, 2002; Dalal, 2005). include tangible resources, career opportunities, emotional
Furthermore, the relationship between CWB and support (including emotional encouragement), and enhanced
organizational justice has been demonstrated, but that feedback (Graen and Uhl-Bien, 1995; Zagenczyk et al., 2015).
relationship seems to be contingent on other variables Consequently, high LMX employees are more likely to engage
Frontiers in Psychology | www.frontiersin.org 5 May 2020 | Volume 11 | Article 851Tziner et al. Profile Analysis via Multidimensional Scaling
in positive behaviors, including forgiving supervisor errors (Toker and Biron, 2012) and has also been found to be related
(Radulovic et al., 2019), while those low on LMX will be more to the increased risk of hyperlipidemia (Shirom et al., 2013),
prone to negative behaviors (Tziner et al., 2010; Breevaart et al., type-2 diabetes (Melamed et al., 2006), and inflamed levels
2015). Conversely, and with respect to enlarging the network of biomarkers such as C-reactive protein (Toker et al., 2005).
of constructs investigated in this study, it is important to note Burnout is also an important component of general health
that poor relations between managers and their employees will outcomes that are related to total work hours and work–life
almost certainly result in reciprocal counterproductive behavior conflict (Fein and Skinner, 2015).
(Chernyak-Hai and Tziner, 2014). This evidence suggests that burnout has clear implications
While LMX’s role as a potential mediator of workplace for organizations, taking into account its negative impact on
misbehaviors has been investigated (e.g., He et al., 2017), most employees’ attitudes toward work and their work performance
studies emphasize contextual-level or job-level predictors (e.g., (Maslach et al., 2001). As burnout intensifies, it tends to induce
He et al., 2017; Sharif and Scandura, 2017). However, less is lower levels of work satisfaction, which, in turn, enhance the
known about the effects of individuals’ dispositional differences rates of employee turnover (Wright and Cropanzano, 1998;
on LMX (e.g., Maslyn et al., 2017; Hao et al., 2019). In addition, Urien Angulo and Osca, 2012). Burned out employees may
there is even less emphasis on the effects of cultural and also influence colleagues negatively (Bakker et al., 2005) and
demographic parameters on leader–member interrelations (for burned out managers may exhaust the entire system they
further reading, see Rockstuhl et al., 2012; Zagenczyk et al., 2015), manage (Pines and Aronson, 1988). In the current study, of
which makes LMX worth including as a key state in this study. the three dimensions comprising burnout, we opted to survey
only emotional exhaustion because, as reported in two recent
Job Satisfaction meta-analyses, emotional exhaustion emerged as the most closely
Job satisfaction is defined as the pleasurable or positive attitude related to antecedents and outcomes of burnout (Lee et al., 2011;
resulting from the overall positive evaluation of one’s job or Cieslak et al., 2014). In addition, these three items of emotional
work experiences. Job satisfaction is related to the extent that exhaustion provided a uniform focus and maximum clarity of
an individual’s needs are met in the work setting (Tziner wording when measuring burnout.
et al., 2012), and consequently, job satisfaction can be linked Within intrinsic motivation frameworks, burnout can also be
to intrinsic factors, deriving from internally mediated rewards related to the failure to achieve goals based on corresponding
related to the essence of the job, and can also be linked to failures of social exchange and affect regulation processes
factors extrinsic to the individual, resulting from externally (Vansteenkiste and Ryan, 2013). These observations can be
mediated rewards, such as adequate and appropriate pay (Porter linked to the work of Colquitt et al. (2013), where the authors
and Kramer, 2004). For the purpose of enlarging the number suggest numerous opportunities for integrating justice, CWB,
of constructs investigated in this study, we note that job and OCB through the integration of social exchange and affect
satisfaction is also associated with state-based perceptions of processes as mediators. Although more work needs to be
organizational justice (Tziner et al., 2011; Pignata et al., 2016). done regarding the relationship between social exchange and
In addition, job satisfaction has also been shown to be related to affect processes, Rupp et al. (2014) provide one explanation
individual characteristics, such as personal traits or dispositions that includes social exchange as an amplifying mechanism that
(Tziner et al., 2008). enhances the role of organizational justice. Based on these
Meta-analytic evidence also suggests that job satisfaction and findings and the comprehensive model illustrated in Figure 1,
motivation are mediators that serve to enhance the relationship we expect job satisfaction to be positively related to intrinsic
between LMX and performance (Martin et al., 2016) and that motivation and emotional exhaustion to be negatively related to
high LMX reduces the incidences of CWB. These findings suggest intrinsic motivation.
that the damaging effects of low LMX may more seriously affect Within the present research, the framework we present in
performance through CWBs than previous research indicates Figure 1 allows us to accomplish several important objectives:
(Martin et al., 2016).
• First, we can anchor the constructs of CWB and intrinsic
Burnout and Emotional Exhaustion motivation as central endogenous motivational processes.
As opposed to job satisfaction, burnout is a progressive • Second, in line with our reasons for conducting the
psychological response to chronic work stress that can present study, we were able to follow a model connecting
be construed as a multidimensional construct involving key personal-level antecedents and reactions derived from
three distinct but interrelated aspects, namely: (a) emotional the work context to the central endogenous motivational
exhaustion, (b) depersonalization (negative or cynical attitudes processes at the heart of our study, as well as to important
and feelings toward the organization and service recipients), and work outcomes. As noted, the core purpose of our
(c) a decline in personal accomplishment and in the perceived use of the Van den Broeck et al. (2019) model was
ability to perform effectively (Maslach, 2003). Notably, Shirom the integration of the endogenous motivational processes
and Melamed (2006) also added physical fatigue to these surrounding CWB and intrinsic motivation with one
dimensions of burnout. critical personal level antecedent (EI) and two critical
Burnout has negative implications for employees’ state contextual-level antecedents (justice and LMX), which have
of health. For example, burnout is related to depression been linked across numerous meta-analyses and previous
Frontiers in Psychology | www.frontiersin.org 6 May 2020 | Volume 11 | Article 851Tziner et al. Profile Analysis via Multidimensional Scaling
studies (Dalal, 2005; Colquitt et al., 2013; Martin et al., 2016; TABLE 1 | Demographic information of study participants.
Van den Broeck et al., 2016).
Parameter Category Sample 1 (n = 3,293)
• Third, the use of the model afforded a logical link (%)
from antecedents (EI, justice, and LMX) and motivational
processes (CWB and intrinsic motivation) to work Gender Males 60.00
outcomes, namely, job satisfaction (positive) and emotional Females 40.00
exhaustion (negative), links which have been supported by Age 18–25 53.60
previous studies (Vansteenkiste and Ryan, 2013; Martin 26–35 23.20
36–45 12.30
et al., 2016; Miao et al., 2017).
46+ 10.90
Thus, the use of the Van den Broeck et al. (2019) Education High-school 31.2
model allowed us to broaden the scope of the current Tertiary 7.70
study to include antecedent constructs (EI, LMX, justice) Student/B.A. graduate 41.40
endogenous motivational constructs (CWB, intrinsic motivation) Student/M.A. graduate and above 19.70
and outcome-based constructs (job satisfaction and emotional Tenure 0–5 66.10
exhaustion) in the same PAMS study. We note that because 5–10 14.50
the PAMS approach is well suited to collective capturing and 10–15 7.50
bringing together the impact of a relatively broad range of related 15–20 4.60
variables, it was an appropriate method to use in testing the 20–25 2.80
relationships with the framework displayed in Figure 1. Based 25+ 4.40
on these associations, we outline how individuals’ perceptions Team worka No 83.40
of organizational justice serve as antecedents to motivation, as Yes 16.60
Responsibilityb No 74.20
illustrated in Figure 1.
Unit/team manager 15.70
Department manager 6.80
Director 3.40
MATERIALS AND METHODS
a Working in a team. b Responsibility for other people’s work.
Participants
In the present study, we collected data from 3,293 Romanian University of Economic Studies, and Romanian is his maternal,
participants, all employees from various telecommunications education, and work language. The first author, who has equally
organizations (including high-tech, communications, and mastered both the Romanian and English languages, compared
telemarketing, among others). The field research was based the translations into Romanian against original English versions
on the administration of questionnaires by students who and essentially back-translated items from English to Romanian.
participated as research assistants. The participation of the Amendments to items were made if needed to ensure semantic
respondents in the survey was voluntary. In the questionnaire, equivalence. Only then was the questionnaire administered to
the participants were assured of our respect for the principle of participants. These instruments have already been in use in
data confidentiality throughout the entire collection, processing, previous investigations in Romania.
storage, dissemination, and archiving flow. Data regarding A pencil and paper survey was given to working people
gender, age, professional experience, education level, and the in four telecommunications companies representative of the
exercise of a management activity were aggregated. Thus, the telecommunications industry, Vodafone, Orange, RCS&RDS,
data become anonymous, making it impossible to identify and Telekom, to complete voluntarily. After we collected the data,
the respondents. There are no questions in the questionnaire it was analyzed using the SPSS (v. 22.0) and AMOS (v. 22.0)
regarding the names, e-mail addresses, telephone numbers software packages to assess multivariate normality. Consistent
or other personal data of the respondents. In this way, the with the very large sample size, all variables were normally
information was treated responsibly, according to European distributed. We considered the issue of common method variance
Union legislation in the field of personal data. (CMV) during the design of the study, and we used a number of
To minimize any potential nested effects of differences design modifications to lower the risk of CMV. Although it was
in organizational culture, because the Romanian corporate impossible for us to obtain data external to the questionnaire, we
culture within telecommunications firms is relatively uniform, were able to position items measuring the CWB outcome further
we focused exclusively on four telecommunications companies away from items assessing EI, motivation, and justice. We also
representative of the telecommunications industry. These reduced the emotional exhaustion items to the three items most
included Vodafone, Orange, RCS&RDS, and Telekom. Table 1 clearly assessing burnout. Both of these adjustments are effective
incorporates the demographic information for these participants. procedural remedies for CMV (Podsakoff et al., 2003).
Procedure Measures
The questionnaire was translated into Romanian by the fourth Emotional intelligence (EI) was measured using the Trait
author of this paper, who is associated with the Bucharest Emotional Intelligence Questionnaire-Short Form (TEIQue-SF;
Frontiers in Psychology | www.frontiersin.org 7 May 2020 | Volume 11 | Article 851Tziner et al. Profile Analysis via Multidimensional Scaling
Petrides and Furnham, 2003), which includes 30 Likert-type the three dimensions of burnout, in this paper, we used only
items between 1 (very little) and 6 (very much); for instance, “I’m emotional exhaustion (EE), comprising nine Likert-type items
usually able to find ways to control my emotions when I want between 1 (a few times a year) and six (every day); for instance,
to.” Half the items were reverse-scored. In previous studies, the “I feel emotionally drained from my work.” In a previous study
reliability coefficient (Cronbach’s α) of the questionnaire ranged (Smith and Tziner, 1998), Cronbach’s α of this measure was 0.89.
between 0.82 and 0.89 (Pérez et al., 2005; Petrides and Furnham, In the current study, the measure had strong reliability: α = 0.92
2006; Cooper and Petrides, 2010). In the current study, the (M = 2.76; SD = 1.06).
measure had strong reliability: α = 0.91 (M = 4.26; SD = 0.96).
Work motivation (MO) was gauged by the Work Extrinsic Control Variables
and Intrinsic Motivation Scale (WEIMS; Tremblay et al., 2009), Past empirical research has found no evidence of a meaningful
consisting of 18 Likert-type items ranging from 1 (does not relationship between demographic characteristics and research
correspond at all) to 6 (corresponds exactly); for example, “The variables. In this study, all correlations between the demographic
reason for being involved in my job is for the satisfaction I variables (age, education, tenure, teamwork, and responsibility)
experience when I am successful at doing difficult tasks.” In the and the investigated variables were below 0.1; therefore, none of
present study, we used the intrinsic dimension of the scale. The these variables were controlled in subsequent analyses.
measure had high reliability: α = 0.92 (M = 4.12; SD = 0.87). Table 2 presents the validity indices for the measures used in
Organizational justice (OJ) was measured using the Justice the research, based on confirmatory factor analysis (CFA).
Scale (Niehoff and Moorman, 1993), which includes 20 Likert-
type items between 1 (completely disagree) and 6 (completely PAMS Approach
agree); for instance, “I consider my workload to be quite fair.” In the social sciences, one of the most popular representations of
The mean reliability coefficient of the questionnaire was 0.84 data is a tabular form where rows represent cases (e.g., people)
(Niehoff and Moorman, 1993). In the current study, the measure and columns represent measurements of variables (e.g., items
had strong reliability: α = 0.96 (M = 4.13; SD = 0.96). The or subscales). We can view rows – arrays of column subscale
three subscales of this construct were measured as follows: scores – as person profiles. Each person profile carries two types
organizational justice-distributive (DI) comprised five items of information: (1) the summary statistics (quantitative) that
(α = 0.83; M = 4.11; SD = 1.07); organizational justice-procedural represent the profile level or height, and (2) the contextual pattern
(FP) consisted of six items (α = 0.88; M = 4.10; SD = 1.03), and that the profile exhibits (qualitative) in each individual’s person
organizational justice-interactive (IJ) was gauged by nine items profile of observed score.
(α = 0.89; M = 4.19; SD = 1.02). In the present study, using Profile Analysis via
CWB was measured by employing the Interpersonal Deviance Multidimensional Scaling (PAMS; Kim et al., 2017; Kim
(ID) and Organizational Deviance (OD) Scale (IODS; Bennett and Kim, unpublished), we analyzed 3,293 cases or individuals
and Robinson, 2000), which includes 18 Likert-type items who were measured by six subscales (EI = emotional intelligence;
between 1 (never) and 6 (every day); for instance, “I deliberately MO = work motivation; LMX = leader-member exchange;
worked slower than I could.” The mean reliability coefficient of DI = organizational justice-distributive; FP = organizational
the questionnaire was 0.80 (Bennett and Robinson, 2000). In justice-procedural; IJ = organizational justice-interactive)
the current study, the measure had strong reliability: α = 0.96 to capture both quantitative profile-level information and
(M = 1.98; SD = 1.03). Moreover, the reliability for interpersonal contextual profile pattern information (i.e., two core profile
deviance (ID) was 0.87 (six items, M = 1.98; SD = 1.08) and the patterns identified in the present study). The profile level is the
reliability for organizational deviance (OD) was 0.94 (12 items, average of input variable scores. In the present study, the profile
M = 2.0; SD = 1.05). level was, in fact, the average of six subscale scores, and there
LMX was gauged by the LMX7 questionnaire (LMX7; Graen
and Uhl-Bien, 1995), consisting of seven Likert-type items;
TABLE 2 | Validity indices for the measures used in the research, based on CFA.
however, each item had a different scale, from 1 (rarely, not
a bit, not at all, none, strongly disagree, extremely ineffective) Measure CR AVE MaxR(H)
to 6 (very often, a great deal, fully, very high, strongly agree,
extremely effective). Original reliability was α = 0.91. In the Emotional exhaustion 0.92 0.53 0.92
current research, reliability was: α = 0.86 (M = 4.11; SD = 0.91). CWB (interpersonal) 0.87 0.53 0.92
CWB (organizational) 0.94 0.58 0.95
Job satisfaction (SA) was tapped with the MSQ 20-item
EI 0.91 0.44a 0.93
questionnaire (Weiss et al., 1967). Each item of the questionnaire
Work motivation 0.92 0.41a 0.94
assesses a facet of work satisfaction; for instance, “To what extent Job satisfaction 0.96 0.57 0.97
are you satisfied with the chance to do something that makes LMX 0.86 0.46a 0.87
use of your abilities?” The responses were given on a six-point Distributive justice 0.83 0.50 0.83
scale. In a previous study (Smith and Tziner, 1998), the reliability Procedural justice 0.88 0.55 0.89
coefficient of this measure was 0.82. The reliability in this paper Interactional justice 0.89 0.48a 0.92
was: α = 0.96 (M = 4.35; SD = 0.88). a Convergent validity issue as the average variance extracted (AVE) < 0.50. CR,
Emotional exhaustion was measured using the Maslach composite reliability. MaxR(H), maximum reliability. CWB, counterproductive work
Burnout Inventory (MBI; Maslach et al., 1986). As indicated, of behavior. EI, emotional intelligence. LMX, leader–member exchange.
Frontiers in Psychology | www.frontiersin.org 8 May 2020 | Volume 11 | Article 851Tziner et al. Profile Analysis via Multidimensional Scaling
were 3,293 profile levels. The profile pattern information appears (two or three) out of numerous person profiles of observed scores
in ipsatized scores around the person level. in a sample. Note that PAMS views cases (or rows) in a dataset
For example, we can assume person p’s level to be Cp (p = 1, as arrays of observed column variable scores, which are called
. . ., 3,293 in the study) and each subscore to be Mpj (j = 1, “person profiles” in PAMS terms.
. . ., 6) since there were six subscores used as input variables for However, there are fundamental differences between PAMS
PAMS in this study, and then an array of person p’s ipsatized and other dimension-reduction methods, especially factor
subscores, (Mp1 – Cp), . . ., (Mp6 – Cp), represents the person p’s analysis (FA) (either exploratory or confirmatory). First,
profile pattern. PAMS uses only this person pattern information extracted factors represent certain latent traits included in a
to identify core profiles. In the present study, PAMS analyzed sample (e.g., intelligence or personality); PAMS, however, does
3,293 arrays of six ipsatized subscores to identify two core profiles not “seek” latent traits in a given sample.
(see Figure 2) (see Kim, 2013; Kim and Kim, 2017, for details). Second, in the present study, PAMS identifies and extracts two
Notably, the PAMS approach can be interpreted as a type of core profiles from a dataset compiled from a sample of 3,293
dimensionality reduction technique for person profiles. Thus, person profiles of six observed scale scores (EI, MO, LMX, DI, FP,
regarding the option to choose between person-centering and and IJ). Peaks on certain subscales represent high scores (because
group-centering (organization-level centering in our case), of personal skills, inclinations, or preferences on the subscale
estimation of core profiles in the PAMS model is based on measurements) and valleys represent low scores (because of lack
a person-centering, but not on a group-centering because of skills or inappropriateness on the subscale measurements) (For
PAMS estimates within-person variation in a given population. details, see Kim et al., 2004, 2007; Kim, 2013).
Therefore, organization-level centering is not considered Third, unlike factors or FA results, PAMS is designed to
in the PAMS model. replicate person profiles that incorporate core profiles, based on
PAMS attempts to identify the most typical response the assumption that (a) person profiles are linearly related to core
patterns (called dimensional profiles) in a population and profiles as in multiple regression, and (b) that person profiles
then summarizes individuals as linear combinations of these are considered as response variables (as in regression), and core
dimensional profiles. PAMS identifies two or three of the profiles as predictor variables.
dimensional profiles that represent the most typical response Finally, FA “attempts” to group homogeneous variables (by
profiles in a dataset. One can thus describe each individual’s a rotation method) in several clusters and interprets these
profile as the linear combination of these dimensional profiles. clustered variables as factors, pursuing “a simple structure” where
This representation is parameterized by regression coefficients a variable is assumed to be loaded onto one factor to enhance
(known as person weights), one for each dimensional profile. interpretation of factors, and factor loadings are considered
Notably, person weights are useful because they relate individual to be unidirectional (usually positive). However, in PAMS,
profiles to core profiles in an interpretable way. the directions of core profile coordinates (analogous to factor
Furthermore, although PAMS is a multivariate statistical loadings) are irrelevant; and no rotation is required to enhance
method, unlike traditional methods, it does not require the interpretation because all the input variables (six subscales in
assumption of normality, is easy to use, and effects can be our study) are used to characterize each core profile pattern.
detected in smaller samples (even sample sizes of fifty or less). For these reasons, rather than employ multivariate analytical
We applied the PAMS paradigm to the Romanian sample data methods, such as factor analysis, SEM, or HLM, we used PAMS
to identify dimensional profiles regarding organizational justice as our primary analysis tool.
perceptions and personal states. In Table 3, a few person In addition, convergent and discriminant validity is addressed
parameter estimates are included by way of example. via the correlations between two core profiles and a third variable
Regarding Table 3, if someone (e.g., #3) has a high correlation such as emotional exhaustion (EE), interpersonal deviance
with core profile 1 (based on the partial correlation for corDim1 (ID), organizational deviance (OD), and job satisfaction (SA).
x #3), that person’s profile pattern would be similar to the core For convergent validity we can use the examples of r(EE,
profile 1 pattern. Thus, the data from Table 3 shows that the dimension 1) = –0.56∗∗ and r(EE, dimension 2) = –0.060∗∗ with
profile of #3 is essentially identical to the core profile 1. On the r(SA, dimension 1) = 0.65∗∗ and r(SA, dimension 2) = 0.07∗∗
other hand, if someone has a high correlation with core profile 2, as reflected in Table 2. Convergent validity is indicated because
it is expected that that person’s profile would be similar to core correlation coefficients for dimensions 1 and 2, for both
profile 2. In the case of the data in Table 3, this relationship is EE and SA, the same directions were indicated, although
revealed for #32. For details, please consult the previous PAMS the magnitudes were different. Within PAMS this indicates
studies (Kim et al., 2004, 2007, 2017; Frisby and Kim, 2008; evidence of convergent validity for the dimension profiles.
Kim and Kim, 2017). Conversely, for discriminant validity we use the example of r(ID,
We chose PAMS instead of other methods of multivariate dimension 1) = –0.43∗∗ and r(ID, dimension 2) = 0.10∗ with
data analysis because we wanted to identify the central response r(OD, dimension 1) = –0.44∗∗ and r(OD, dimension 2) = 0.13∗∗ .
patterns (the so-called “core” profiles in the present study) in a Here the different directions of correlation coefficients between
given sample. The core profiles are similar to factors extracted the two core profiles within both ID and OD are evidences
in exploratory factor analysis in terms of a dimension-reduction of discriminant validity for the dimension profiles. Also, the
technique. However, the PAMS approach was better suited to correlation between the dimension profiles was r(dimension 1,
this project because researchers can extract a few core profiles dimension 2) = 0.12∗∗ . Because of a extremely reduced standard
Frontiers in Psychology | www.frontiersin.org 9 May 2020 | Volume 11 | Article 851Tziner et al. Profile Analysis via Multidimensional Scaling
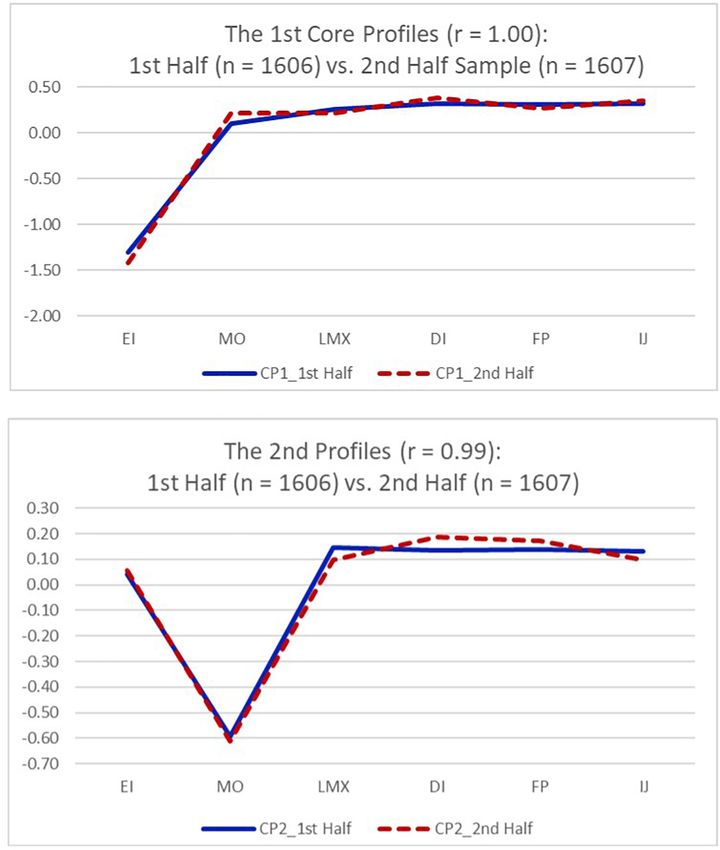
FIGURE 2 | Patterns of dimensional profiles, where 1 = emotional intelligence; 2 = work motivation; 3 = leader-member exchange; 4 = organizational
justice-distributive; 5 = organizational justice-procedural; 6 = organizational justice-interpersonal.
TABLE 3 | Example data for interpretation of person weights.
id w1 w2 level R∧ 2 corDim1 corDim2
#1 0.83 −1.78 3.28 0.47 0.57 −0.56
#3 1.88 −0.19 4.46 1.00 1.00 −0.72
#32 −0.47 1.78 3.85 0.89 −0.83 0.93
Where w1 = person regression weight_1; w2 = person regression weight_2; level = person average score for six subscales included as input variables in PAMS; R∧ 2
= R-
squared (which is a proportion of person variance occurring in his/her profile accounted for by two core profiles); corDim1 = partial correlation of a person between a
person profile and core profile_1; corDim2 = partial correlation of a person between a person profile and core profile.
error caused by a large sample size (N = 3,293), this small We identified two core profiles from the present dataset based
correlation coefficient was statistically significant at a = 0.01, on two criteria: stress and interpretability. Stress is analogous
but the squared of 0.124 equals to 0.015 means that about 1.5% to Steiger’s RMSEA (root mean square error of approximation)
variance was shared between two core profiles (extracted from the or inverse of TLI (Tucker–Lewis Index) in SEM, and a value
present data set). This correlational result implies discriminant of 0.05 or less of stress signifies goodness-of-fit (to data) for
validity for the core profiles extracted from the current data set. proposed dimensionality. The stress value of the proposed two-
dimensional solution in our study was 0.0022, and its bootstrap
empirical confidence interval was (0.0011, 0.0058), verifying the
RESULTS stability of the two-dimensional solution. From 3,293 person
profiles of the six observed measurements, using PAMS, we
Next, to describe the network of associations among the study’s identified two core profiles that accounted for 68% of variance
variables, a Pearson correlation matrix was derived, as presented occurring in 3,293 person profiles.
in Table 4. Also, this two-dimensional solution satisfied the
Utilizing the enhanced PAMS (Kim et al., 2017; Kim and interpretability of the dimensions based on our judgment
Kim, unpublished), we identified two two-dimensional profiles from the standpoint of organizational psychology.
from the six predictor variables included in the current The person weights are in fact regression weights/coefficients
data, namely: emotional intelligence (EI); work motivation estimated by regressing the person profiles of the six observed
(MO); leader–member-exchange (LMX); organizational justice- measurements (EI, MO, LMX, DI, FP, and IJ) included in our data
distributive (DI); organizational justice-procedural (FP); and matrix that consisted of 3,293 cases (rows) and six organizational
organizational justice-interactive (IJ). measures loaded on to two core profiles. The “person” weights
Frontiers in Psychology | www.frontiersin.org 10 May 2020 | Volume 11 | Article 851Tziner et al. Profile Analysis via Multidimensional Scaling
−0.05**
0.05**
−0.12**
0.08**
0.06**
0.27**
0.33**
0.34**
0.32**
0.35**
0.04**
0.17**
0.12**
function as matching statistics between person profiles and core
−0.04*
−0.01
16
1
profiles in terms of their patterns and they are often expressed
0.14** in terms of the correlations between them (Kim and Kim, 2017):
−0.06**
−0.05**
0.10**
0.47**
−0.17**
−0.13**
−0.28**
−0.27**
−0.23**
0.31**
0.84**
Each person (of the 3,293) is assigned two “person” weights in
−0.01
0.03
15
1
our study because we identified two core profiles.
With the coordinates included in Table 4, we generated
0.15**
−0.06**
−0.05**
0.11**
0.43**
−0.10**
−0.07**
−0.23**
−0.23**
−0.18**
0.28**
patterns of the dimensional profiles (see Figure 2). According
−0.02
−0.01
14
1
to the profile pattern information generated, we labeled the
dimension 1 profile as high overall justice and low emotional
0.07**
0.53**
−0.14**
−0.27**
−0.28**
−0.28**
−0.29**
intelligence and the dimension 2 profile as high emotional
−0.03
0.00
−0.02
0.00
−0.01
13
1
intelligence and low work motivation. With reference to the
integrated framework in Figure 1, each of these profiles
−0.06**
−0.06**
−0.22**
0.53**
0.58**
0.86**
0.88** represents a different state or arrangement of variables with the
−0.01
0.03
−0.01
0.03
12
1
*p < 0.05, **p < 0.01. (1) Pearson correlations are shown above. Frequencies for Gender, Age, Education, Tenure, Teamwork and Managerial Level appear in Table 1.
framework. Specifically, for the dimension 1 profile, we assume
that justice perceptions are fixed at a high level within this state
−0.08**
−0.07**
−0.24**
0.55**
0.53**
0.84**
0.03*
and EI is fixed at a low level within this state, while all other
0.01
0.03
0.01
11
1
measured elements are aligned with their high or low positions
in Figure 2. Similarly, for the dimension 2 profile, we assume
−0.08**
−0.08**
−0.23**
0.52**
0.54**
−0.02
0.02
−0.02
0.01
that EI is fixed at a high level within this state and that intrinsic
10
1
motivation is fixed at a low level within this state, while all
other measured elements are aligned with their high or low
−0.05**
0.05**
−0.08**
0.07**
−0.19**
0.30**
0.01
−0.02
positions in Figure 2.
9
1
In reality, the patterns of the dimensional profile should
represent the pattern of the means of the six predictor variables.
−0.05**
0.06**
0.06**
0.04**
0.05**
−0.07**
−0.03*
For example, if one plotted the six predictor variables’ means in
8
1
a spreadsheet file (i.e., a predictor variable-mean profile for the
dimension 1 profile), its profile pattern should be equal to the
−0.07**
−0.09**
−0.04**
0.04*
−0.03
−0.03
pattern of the dimension 1 profile. To confirm this, we estimated
7
1
the correlation between the predictors’ mean profile and the
dimension 1 profile. The correlation was 0.99, indeed indicating
0.12**
0.22**
0.20**
0.27**
−0.04*
that the two patterns were visually identical.
6
1
Validation of Core Profile Patterns
0.10**
0.08**
−0.01
−0.01
To validate core profile patterns identified from the sample
5
1
(n = 3,213), we first randomly split our original sample into two:
Sample 1 as a calibration sample (n = 1,606) and Sample 2 as a
0.06**
0.77**
0.09**
4
1
validation sample (n = 1,607), and we then compared the two core
profile patterns from Samples 1 and 2. The correlation between
0.13**
the first core profiles from Samples 1 and 2 was 1.00, and the
−0.02
3
1
correlation between the second core profiles from Samples 1 and
2 was 0.99. As expected, the correlations between the core profiles
0.06**
of the whole sample and the core profiles of the validation sample
2
1
(Sample 2) were between 0.99 and 1.00.
We included both profile coordinates in a table (Table 5) and
1
1
juxtaposed profile patterns in a figure (Figure 3). Since there
0.96
0.87
0.91
1.07
1.03
1.02
1.06
1.08
1.05
0.88
SD
was no difference in core profile patterns between the calibration
TABLE 4 | Correlation matrix (n = 3,293).
sample (Sample 1) and the validation sample (Sample 2), we kept
our original profiles estimated from the whole sample because
4.26
4.12
4.11
4.11
4.10
4.19
2.76
1.98
2.00
4.35
M
they were almost identical to those core profiles estimated from
Sample 1 (for calibration) and Sample 2 (for validation). Table 5
(10) Org. justice -distributive
(11) Org. justice -procedural
(12) Org. justice -interactive
(13) Emotional exhaustion
provides the core profile coordinates from the calibration and
(7) Emotional intelligence
validation samples and for the whole sample. Figure 3 illustrates
(16) Job satisfaction
(8) Work motivation
(6) Managerial level
that the PAMS responses between the calibration and validation
samples are visually identical. In sum, all core profile patterns
(5) Teamwork
(15) CWB-O
(14) CWB-I
(1) Gender
identified from Sample 1, Sample 2, and the whole sample were
(4) Tenure
(9) LMX
(2) Age
(3) Edu
virtually the same, and we thus included the core profiles of the
entire sample as the final ones.
Frontiers in Psychology | www.frontiersin.org 11 May 2020 | Volume 11 | Article 851You can also read